ABSTRACT
KADERABEK, LAURA ELLEN BARTH. Effects of Aging on the Physical, Chemical, and Hydrologic Properties of Pine Bark Substrates. (Under the direction of Dr. Brian E. Jackson and William C. Fonteno).
Pine bark (PB) is one of the most commonly used horticultural substrates, and may be used as a fresh, aged, or composted product. Aged PB is most commonly used; however, interest and demand for fresh PB has increased. While both aged and fresh PB can be used successfully, little
research has been done to investigate the differences between fresh and aged PB, as well as PB of specific ages. Additionally, the actual age of PB used for research in the literature is usually
not reported, making it hard to extrapolate anything more than general trends for bark that is considered “fresh” or “aged.” To gain a greater understanding of the effects of aging and pile
management on PB substrates, a twelve-month study was conducted at a local PB supplier in Eagle Springs, NC. Fresh PB was processed and fines (less than or equal to 1.27 cm) were placed in three pile replications of 191 cubic meters each. Beginning at time 0 and every 4 to 5 weeks
for a period of twelve months, stratified subsamples were taken from each pile at three different heights (top, middle, and bottom) at horizontal depths of 0.3 – 1.2 m to account for variations in
pile depth and height, and mixed into one composite sample for each pile to test the physical, hydrologic, and chemical properties. Physical properties included pile volume, temperature, particle size distribution, total porosity, container capacity, air space, bulk density, white wood
content, and color. Hydrologic properties included wettability, saturated hydraulic conductivity, moisture retention curves, equilibrium capacity variable models for nursery containers, and pore
data generated from this study can improve the understanding, product consistency and usability
Effects of Aging on the Physical, Chemical, and Hydrological Properties of Pine Bark Substrates
by
Laura Ellen Barth Kaderabek
A thesis submitted to the Graduate Faculty of North Carolina State University
in partial fulfillment of the requirements for the degree of
Master of Science
Horticultural Science
Raleigh, North Carolina 2017
APPROVED BY:
_______________________________ _______________________________ Dr. Brian Jackson Dr. William Fonteno
Committee Chair Committee Chair
_______________________________ _______________________________ Dr. Dean Hesterberg Dr. Wei Shi
iii
“Equipped with his five senses, man explores the universe around him and calls the adventure
Science.” - Edwin Powell Hubble
I dedicate this work to my family, who have always gone above and beyond to support me and
help me achieve my goals, and for instilling in me a sense of curiosity, and a love of nature and all its wonders. I also dedicate this to my beloved mutts, for their unconditional love,
iv BIOGRAPHY
Laura Ellen Barth Kaderabek was born in Eau Claire, WI to Dr. Robert J. Barth, a professor of archaeology at the University of Wisconsin – Eau Claire, and Janine L. Polk, an avid birder and
herpetologist. After graduating with a degree in Music Performance (flute) from the University of Wisconsin – Eau Claire, she moved to North Carolina in 2007 in pursuit of adventure and warmer climes. The tall trees, lush greenery, extended growing season, and wide array of
beautiful landscape plants helped Laura to foster a deeper connection to nature and gardening. After working at the Durham Crisis Response Center, a non-profit organization for survivors of
domestic violence and sexual assault, for three years she decided to return to school for an undergraduate degree in horticulture at North Carolina State University. During her studies at
NCSU, Laura had the opportunity to work in several labs on campus, including the Gould Entomology Biolab, the NCSU Plant Disease and Insect Clinic, and the Horticultural Substrates Lab, all of which afforded her opportunities for practical multi-disciplinary experience to round
out her education, as well as participation in undergraduate research projects. Laura graduated with honors in May 2014, and was selected to be an intern in Dr. Tom Ranney’s plant breeding
program at the Mountain Crop Improvement Lab in Mills River. After seven months of plant breeding and hiking to mountain peaks and waterfalls, Laura returned to Raleigh to pursue a Master of Science degree in horticulture under Drs. Brian Jackson and Bill Fonteno. When not
playing in the dirt, Laura still utilizes her first degree and is a freelance musician in the Raleigh/Durham area. After completion of her Master’s degree, Laura will begin a doctorate
v ACKNOWLEDGMENTS
I feel incredibly grateful and humbled to have had the help and support of so many
wonderful people during the course of this adventure. To my advisors, Drs. Fonteno and Jackson,
you have done so much for me over the past 5 (!) years during both of my horticulture degrees at NCSU. The opportunities you have given me provided me with a greater scientific and practical knowledge of horticulture, awards, travel, connections, and friendships. I will always be deeply
grateful for the support, guidance, patience, wisdom, and humor throughout my studies, and for your faith in my abilities. I have grown so much as a scientist, scholar, and professional, and I
will use the tools that you have given me for the rest of my life’s journey, wherever it may take me. I hope you both know how much I have truly loved being a part of your program. Bill –
thank you for always lending a sympathetic ear if I was struggling in any area of my life (or if I just needed to vent); for your advice; and for your scientific, artistic and musical talent and sensibilities. You are more than an advisor to me, you are a true friend and kindred spirit. Brian –
you have taught me so much, both in and out of the classroom. Thank you for teaching me to always strive for more and never be complacent; to work as hard as I can but still have fun; to
always maintain my curiosity because that is the core of research; and that taking action and just DOING is often the best solution if I’m thinking too hard and losing sight of the bigger picture. Your drive, dedication, and passion for what you do have continually inspired and motivated me,
and after all these years I still want to be you when I grow up!
A HUGE thank you to Layne, Alvin and everyone at TH Blue, who provided the site,
vi my classes. Every time I go out to the research piles I am reminded of the scope, importance, and
awesomeness of this project. Working with you has been a pleasure, and this has been such a cool experience for me. I hope we will keep in contact after my degree is completed!
To my committee members Drs. Dean Hesterberg and Wei Shi, thank you for your advice and expertise, and for always taking time out of your busy schedules to discuss any questions I had. I really enjoyed taking both of your classes, which were interesting and challenging, and
provided me with a strong foundation in soil science that will carry me through my next degree and beyond.
A big thanks to Abby Wunch, Super Mike, Clay Harris, Corey Ames, Rob Schulz, Logan Haislip, Goose, Tucker Brandt, Adam LeMay, and Logan Stewart for the technical help in the
lab. A lot of work was needed to complete all the tests that were required for this project, and I couldn’t have done it on my own. I had a lot of fun working with all of you in the lab!
To the former and current HSL grad students Ted Yap, Jeb Fields, Lesley Judd, Paul
Bartley, and Turner Smith for the advice, insight, technical help, and sympathetic ears. Ted – thank you for your insight into the pine bark aging process as I was beginning my research.
Lesley – thank you for always making time to assist me with any statistical or procedural needs that I had as an undergrad and throughout the course of this research, even after you graduated. Jeb – thank you for our discussions, and for helping me understand substrate physics and water
relations better through your answers to my questions. Paul – I hope you know how much I’ve enjoyed working with you, and I will miss your curiosity, enthusiasm, passion, and wit. I’m
vii working with someone who has so much enthusiasm and curiosity about substrates! I look
forward to seeing your project develop, and hearing you present at future conferences.
Thank you to my graduate student peers in the department – I have learned from you, and
had a lot of fun with you! There are many of you that I wish I could have spent more time with over the past two semesters. I hope we maintain the connections, no matter where life takes us.
Lastly, thank you to Dr. Wayne Robarge, April Shaeffer, Dr. Joy Smith, Dr. Cheryl
Boyer, Guillermo Ramirez, Dr. Consuelo Arellano, Dr. Cavell Brownie for their assistance with various aspects of my research, and a huge thank you to Rachel McLaughlin for the
viii TABLE OF CONTENTS
LIST OF TABLES ...ix
LIST OF FIGURES ...xi
Chapter I: Literature Review Literature Review...1
Literature Cited ... 12
Tables... 16
Chapter II: Changes in Pine Bark During the Aging Process I: Physical Properties ...17
Abstract... 18
Introduction ...20
Materials and Methods ... 27
Results and Discussion ... 33
Summary... 39
Literature Cited ... 40
Tables... 45
Figures... 50
Chapter III: Changes in Pine Bark During the Aging Process II: Hydrologic Properties....60
Abstract...61
Introduction ...63
Materials and Methods ...68
Results and Discussion ...74
Summary ...79
ix
Tables... 86
Figures... 94
Chapter IV: Changes in Pine Bark During the Aging Process III: Chemical Properties ....97
Abstract...98
Introduction ...99
Materials and Methods ... 102
Results and Discussion ... 107
Summary ... 110
Literature Cited ... 111
Appendices...122
Appendix A...123
Appendix B...124
Appendix C...125
x LIST OF TABLES
Chapter I: Introduction and Literature Review
Table 1.1 Scientific literature containing pine bark of specific ages...16
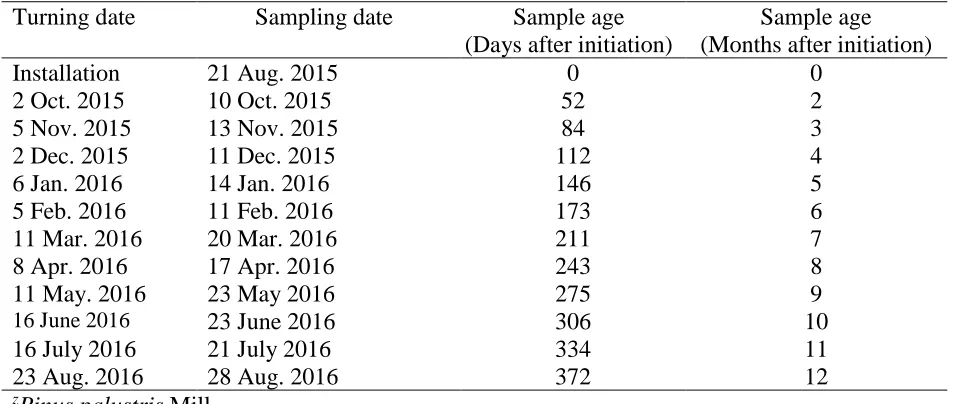
Chapter II: Changes in Pine Bark During the Aging Process I: Physical Properties Table 2.1 Turning and sampling dates, and sample age for pine bark piles over the course of one year. ...45
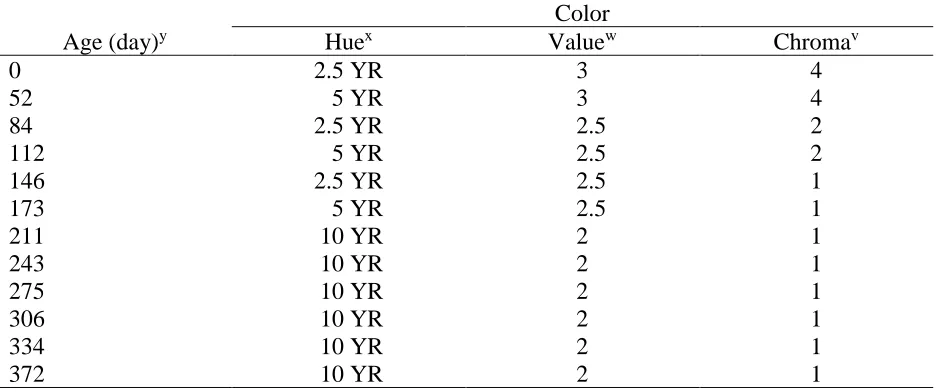
Table 2.2 Color of PB over 12 months of aging using Munsell Soil Color...46
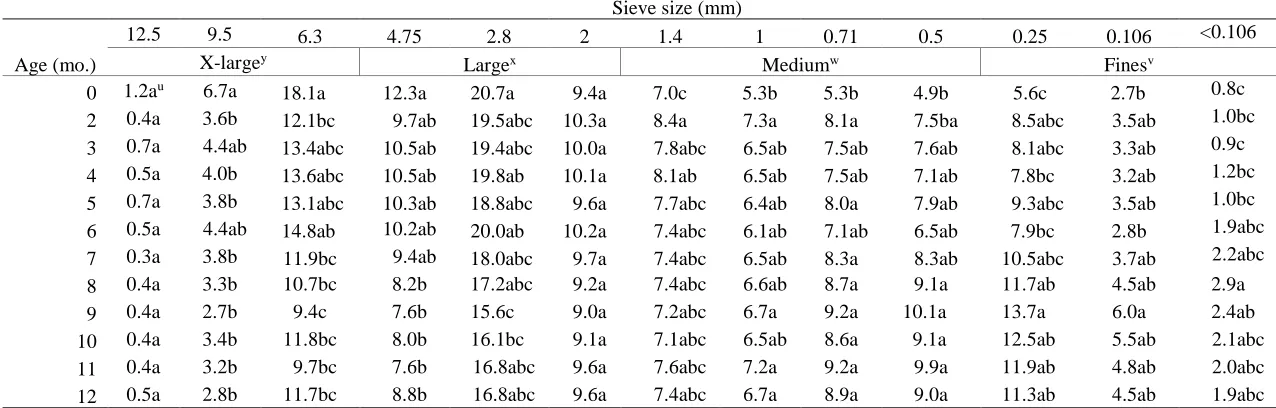
Table 2.3 Particle size distribution of pine bark over 12 months of aging...47
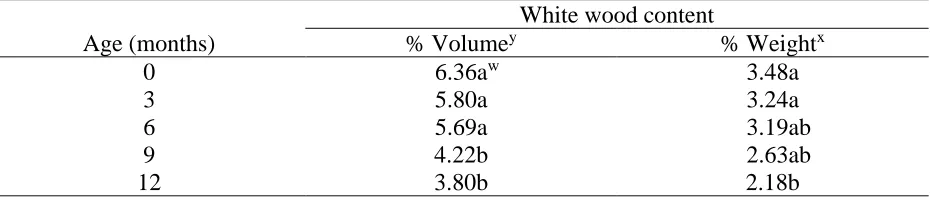
Table 2.4 White wood content of pine bark over twelve months of aging...48
Table 2.5 Sand content of pine bark (Pinus pallustris Mill.) at 0, 3, 6, 9, and 12 months of aging...49
Chapter III: Changes in Pine Bark During the Aging Process II: Hydrologic Properties Table 3.1 Table 3.1. Dimensions of commonly used nursery containers which were used to calculate ECV models...86
Table 3.2 Particle size distribution of pine bark (Pinus palustris Mill.) over twelve months of aging...87
Table 3.3 Saturated hydraulic conductivity (Ksat)values for pine bark (Pinus palustris Mill.) aged 0, 3, 6, 9, and 12 months...88
Table 3.4 Physical and hydrologic properties of pine bark (Pinus palustris Mill.) at 0, 3, 6, 9, and 12 months of aging...89
Table 3.5 Physical properties of pine bark aged 0, 3, 6, 9, 12 months, derived from modeling equilibrium capacity variable values...90
Table 3.6 Sand content of pine bark (Pinus pallustris Mill.) at 0, 3, 6, 9, and 12 months of aging...91
xi Table 4.1 Available nutrients of pine bark over twelve months aging...114
Table 4.2 pH buffering capacity, cation exchange capacity, exchangeable cations
exchangeable acidity, and anion exchange capacity of pine bark after 0, 3, 6, 9, and 12 months of
aging...115 Table 4.3 Elemental carbon, nitrogen, lignocellulose, and ash content and ratios of pine bark
over 0, 3, 6, 9, and 12 months of
aging...116 Table 4.4 Heavy metal detection of pine bark (Pinus palustris Mill.) over twelve months of
aging...117
Table 4.5 Seedling germination and dry weights of three species grown in pine bark after 0, 3, 6, 9, and 12 months of
aging...118
xii LIST OF FIGURES
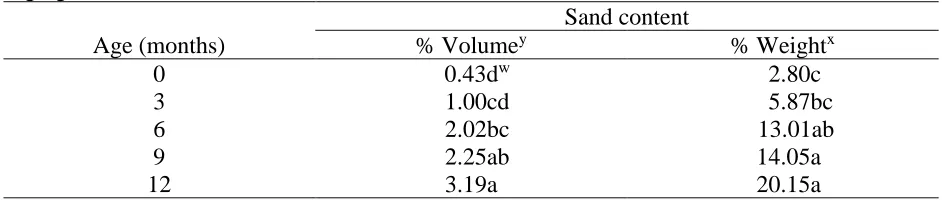
Chapter II: Changes in Pine Bark During the Aging Process I: Physical Properties Figure 2.1 Installation of the 12 month pine bark aging study. A) Fresh bark was brought
from the lumber company and on the research site for further processing. B) The bark was ground and C) screened through a 1.27 cm screen into three fractions: nuggets, mini nuggets, and fines. D) The fines were placed in three piles
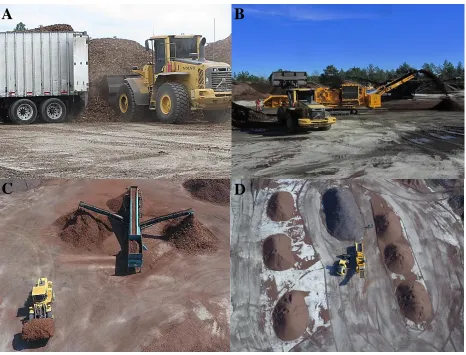
(replications) of approximately 191 m3 each, with dimensions of approximately 16.8 m x 10.1 m x 3.2 m...50 Figure 2.2 Sampling schematic to illustrate height zones, conceptual grid for randomized
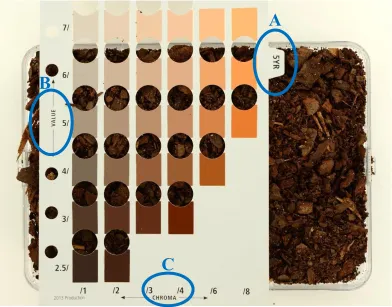
sampling within height zone, and sampling depth. A) Stratified subsamples were taken from 9 locations on each pile at three different height “zones” (top, middle, and bottom). Three locations within each height were randomly selected by conceptually dividing the pile into a grid. B) At each sample location a hole was dug and were taken from horizontal depths of 0.3, 0.6, 0.9, and 1.2 m... ...51 Figure 2.3 Example of a Munsell Soil Color card. Three coordinates – hue (A), value (B),
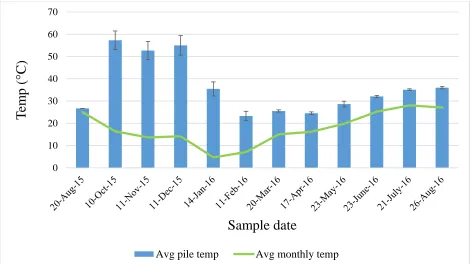
and chroma (C) describe possible colors. Hue refers to the dominant spectral or rainbow color, value indicates the degree of lightness or darkness of a color, and chroma is the purity or saturation of a color. Samples are read in the order of hue value/chroma, e.g. 5YR 3/2...52 Figure 2.4 Average pile temperatures (all heights and depths combined) for each sample
date, average monthly temperatures, and accumulated precipitation (secondary Y axis)...53 Figure 2.5 Temperature measurements at depths of 0.3, 0.6, 0.9, and 1.2 m at three different
height zones (top, middle, and bottom). Data are averaged between piles...54 Figure 2.6 Color changes of bark at (A) 0 months, (B) 2 months, (C) 3 months, (D) 4
months, (E) 5 months, (F) 6 months, (G) 7 months, (H) 8 months (I) 9 months, (J) 10 months, (K) 11 months, and (L) 12 months of aging using a Munsell Soil Color chart...55
Figure 2.7 Percentage of extra-large (>6.3 mm), large (2.0 to 6.3mm), medium (0.5 to 2.0 mm) and fine (< 0.05 mm) particles over twelve months of aging...56
Figure 2.8 Percent differences in particle size fractions between 0 and 3, 0 and 6, 0 and 9, and 0 and 12 months of aging...57 Figure 2.9 Total porosity (TP), container capacity (CC), air space (AS) and bulk density
xiii Figure 2.10 Average volume of pine bark piles and pile bulk density calculated from moisture
content at time of sampling...59
Chapter III: Changes in Pine Bark During the Aging Process II: Hydrologic Properties Figure 3.1 Saturated hydraulic conductivity (Ksat) unit of Drzal (1994). Four 347.5 mL
aluminum cores are fitted with individual funnel adaptor rings on the bottom and a plastic cylinder with a spout on the top. Each core assembly is secured onto an individual stationary funnel. A constant head reservoir, mounted to laboratory jacks, is filled with water and maintained at a constant level by a recirculation system. Rubber tubing is connected from the reservoir to the bottom of the stationary funnel, allowing water to saturate each core unit from the bottom. A hydraulic head is created by raising the reservoir a measured distance above the sample. Piezometers mounted to the reservoir and each core assembly are used to precisely measure hydraulic head differences. ...92
Figure 3.2 Hydration efficiency curves of pine bark (Pinus palustris Mill.) over twelve months of aging at 50% and 25% moisture content by weight, with container capacity for each moisture content represented as solid lines...93 Figure 3.3 Saturated hydraulic conductivity (Ksat) of pine bark (Pinus palustris Mill.) aged 0, 3, 6, 9, and 12 months. ...94 Figure 3.4 Moisture retention curves and Van Genuchten models (log scale) of pine bark
(Pinus palustris Mill.) at 0, 3, 6, 9, and 12 months of aging...95 Figure 3.5 Pore fraction volume analysis...96
Chapter IV: Changes in Pine Bark During the Aging Process III: Chemical Properties Figure 4.1 pH and EC of pine bark samples over twelve months of aging. Three samples
were measured from each pile with a handheld pH meter (HI 9811, Hanna
Instruments, Ann Arbor, MI) using the 1:1 dilution method (Fonteno and Harden, 2010)...120 Figure 4.2 Composite pine bark samples from combined piles at 0, 3, 6, 9, and 12 months of
xiv Appendices
Appendix A Processing of pine bark. Raw pine bark (A) is passed through a hammer-mill (B), and screened into three fractions: nuggets (C), mini-nuggets (D), and fines (less than or equal to 1.27 cm)...123
Appendix B A drone with GPS mapping technology was used to create a site map using DroneDeploy 3-D mapping software (A). This 3-D map can be used to calculate the volume of inventory piles...124
Appendix C Thermal imaging was used as potential technique to measure pile surface temperature (A), inner pile temperature during select sampling dates (B), and during turning on 13 Nov. 2015 (C)...125
1 CHAPTER 1
Literature Review
.History of Container Production and Organic Substrates
Many think of container production as a modern practice, but growing plants in
containers has been documented at various points throughout history, dating back to the Egyptians almost 4,000 years ago. Wall paintings found in the temple of Deir el Bahari depict
what appear to be mature trees being grown and transported in large containers (Raviv and Lieth, 2008). In the seventeenth century, exotic plants began to be cultivated indoors in orangeries to provide fruits, vegetables, and aesthetic value to the wealthy outside of the normal growing
seasons or climates. This can be thought of as the first documented example of a container-growing system, although mineral soil was mostly used in these containers (Raviv and Lieth,
2008).
Composting is thought to be as old as agriculture itself, and was practiced by Chinese farmers and gardeners almost 4,000 years ago (King, 1927). The earliest known written reference
to composting is found on clay tablets dated back to the Akkadian Empire, 2700 BC (Fitzpatrick et al., 1998). The noun “compost” first appeared in the English language in 1587, and the use of
compost as a verb appeared in 1757. At the beginning of the eighteenth century we begin to see detailed descriptions of soil amendments with organic materials. Peat moss was suggested as an additive for soils with a high clay content, and animal dung was suggested for sandy soils. There
is also documentation of an early hotbed that used partially fermented cow manure under a frame covered with glass. John Claudius Loudon, author of “Encyclopedia of Gardening” in 1839,
2 detailed recipes for their composting, as well as suggestions for combining different ingredients
for better plant growth (Raviv et al., 1986). Older references exist that describe the process and end-product of composting, but without the modern terms that we currently use, such as
processing, aging, and stabilization. While the use of compost and organic matter in plant production are practices that have been employed for thousands of years, until recently, the reported benefits of these practices have been mostly anecdotal rather than the result of
controlled scientific experimentation. The earliest scientific reference to aging/composting time is from Howard and Wad (1931), who suggested an optimum time of approximately six months
for mixtures containing at least 75% high carbon material, such as plant debris (Fitzpatrick et al., 1998).
In 1934 a potting compost known as the John Innes mix was introduced. This mix consisted of “7 parts medium loam, by volume, 3.5 parts peat, by volume and 3.5 parts sand, by
volume. To each cubic yard add 2 pounds of hoof and horn meal, 2 lbs superphosphate, 1 lb of sulfate of potash and 1 pound of chalk (calcium carbonate).” This mix was primarily for
greenhouse use (Whitcomb, n.d.). The University of California and Cornell University are often
credited with the initial development of soilless substrates for container production. This is a result of a greater understanding of plant nutritional requirements and greater control of plant pathogens in growing container crops, as well as the increased drainage and decreased
transportation costs associated with the higher porosity of soilless media (Nelson, 2012). In the 1940’s and 50’s scientists at the University of California began researching container media in
3 various chemical additives listed for specific crops. Redwood sawdust was mentioned as a
substitution option for part of the peat (Whitcomb, n.d.).
The profitability of crops grown in soilless substrates is higher than of those gown in soil
due to improved physical and chemical properties of substrates and their low infestation rate with pathogens (Raviv et al., 2008). Soilless substrates consist of a variety of organic and inorganic components. Many different organic substrate components can be utilized in container
production if the proper management is provided (Ingram, et al. 1993). The most popular of these components is peat. Within the last two decades the use of peat has been reevaluated since
it is a non-renewable resource that plays a major role in atmospheric CO2 sequestration, influences groundwater quality, and as an essential habitat for plants and animals in those
ecosystems. Chief among replacement materials for peat have been wood products, especially bark (Raviv and Lieth, 2008).
Pine Bark Structure
Bark is a generic term that includes the inner bark (living phloem) and rhytidome (outer
bark, including cork cells) of a tree. Bark formation is initiated by the process of cell division at the cambium, which produces xylem on the woody (interior) side, and phloem, the primary bark tissue, on the exterior bark side. Phloem tissue contains phloem parenchyma, lignified fibers,
companion cells, and sieve elements. The sieve elements are the main channel for downward movement of sap and nutrients from the leaves. The inner bark is the layer of physiologically
4 compressed, and the sieve elements and surrounding structures collapse. This collapsed tissue
ceases to take part in active physiological processes and is transformed into the relatively inert, dark colored outer bark that comprises the bulk of most tree barks. The structure of bark also
contains a second cambial layer within the bark called the phellogen or cork cambium. Cork, or periderm, is produced by the cork cambium and contributes to the structure of the outer bark. (Harkin and Rowe, 1971).
Bark consists mainly of two contrasting groups of chemical substances: inert, materials including waxes (together with less-durable cellulose), cork, and lignin, and chemically active
water-soluble extractives, mainly tannins and sugars (Aaron, 1976). Bark usually forms 6-16% of the volume of a tree, with 10% being the average value by weight or by volume of the
harvested tree (Bunt, 1988; Aaron, 1991).
History of Pine Bark as a Horticultural Substrate
Often bark intended for horticultural use is a secondary product from lumber
production and pulp and paper mill industries. It was formerly considered a waste product and
disposed of by burning (Bunt, 1988), but there is considerable cost in burning bark at debarking stations, including the cost and cleaning of the incinerators, and the resulting air pollution. Some mills burn bark for energy for drying kilns, recovery boilers, and steam turbines; however, there
are issues when mills do not burn as much bark as they produce and the bark accumulates in large quantities when left on site, where it can become a fire and environmental hazard (Van
5 burning bark residues (Gartner et al., 1973), therefore other uses for bark began to be
investigated.
Research on PB for use as a horticultural substrate began in the US in the late 1960s. One
of the first studies was conducted in the late 1960’s and published in 1971 and 1972 by Dr. Carl Whitcomb, in an effort to create a more porous potting mix for container grown Carissa
macrocarpa Eckl. that were grown in the U.C. mix at a Florida nursery. During a Nursery
Management and Production class that Dr. Whitcomb was teaching, it was mentioned that the U.C. manual had noted that redwood sawdust could be substituted for part of the peat. The class
then discussed the use of ground PB instead of redwood sawdust. A student’s father worked at a pulp mill in Jacksonville, FL that burned large quantities of PB, and a truckload of the PB was
obtained for a study. The coarse particles were screened out, and the remaining bark was used in several test mixes. The results of the study showed that plants grown in PB mixes were larger, and were the only plants in the study to display healthy, white root growth to the bottom of the
container. While some plants displayed symptoms of nutrient deficiencies, indicating a need for more research, interest from nursery growers skyrocketed after the results of the studies were
published (Whitcomb, n.d.). Concurrent PB research and growth trials were also conducted during this time at the University of Texas (1968-1971) involving shredded or ground PB (DeWerth, 1971.), and at the University of Georgia under Dr. Pokorny. Trials utilizing bark
from softwood species in the Pacific Northwest were also being conducted in Oregon during this time (Bollen, 1969).
6 beginning in the early 1960s (Solbraa, 1974). In England, there were several small-scale attempts
to use bark for horticultural purposes. A firm of match manufacturers marketed shredded poplar bark, which was tested by the Parks Department of the former London County Council with
unsatisfactory results, which was hypothesized to be the result of not applying nitrogen fertilizer. A timber merchant in Chester, England marketed bagged, coarse coniferous bark for horticultural use. Other uses for coniferous bark included composting and mulching trials by the Research
Branch of the Silviculture (South) Division of the Forestry Commission; research involving extractives by the Commission’s Utilization Development Section, which resulted in the use of
Sitka spruce tannins for upholstery; and the use of bark as fuel. In 1967, the Forestry Commission resumed work on bark with a concentrated effort on using it for horticultural
purposes. By 1969 it was determined that a wide range of ornamental plants could be grown in a fertilized, bark-only mix, and the concurrent studies in the US further demonstrated the use of PB for both propagation and potting media. In 1970, the development in bark substrates in
England was exhibited in England at the Chelsea Flower Show, where for the next four years a variety of plants and even fungi and forced bulbs were displayed. During this period, the first
horticultural bark manufacturing company was established, which ultimately expanded to become the largest bark producer in England, and other bark operations soon followed (Allen, 1991).
The species of tree most commonly used for softwood bark substrates depends on the country and the region. In Europe, the principal countries that utilize softwood bark in substrates
7 primarily used, and bark from the Monterey pine (Pinus radiata D. Don) is the principal organic
growing media component in New Zealand. (Bunt 1988) In the US, Douglas-fir (Pseudotsuga menzesii Mirb.) is the principal source of bark for substrates in the pacific northwest (Carlile,
year), and loblolly pine (Pinus taeda L.) in the east. In the eastern US, PB often comprises as much as 75 to 100 percent (by volume) of container substrates (Wenliang et al., 2006). In the southeastern US, loblolly pine, shortleaf pine (Pinus echinata Mill.), slash pine, and long leaf
pine (Pinus palustris Mill.) are the predominant species used for PB substrates (Bunt, 1988).
Variability in Pine Bark Substrates
Pine bark can be utilized as a fresh, aged, or composted product, with all three having the
potential to provide excellent results as a substrate; however, PB is a naturally variable material, due to both biological and processing factors, and therefore not all bark supplies will be the same. Fresh PB refers to material that is ground, screened, and sold/used soon afterwards
(Buamscha et al., 2007). Aging refers to the stockpiling and weathering of bark prior to its use, in open air piles established by the bark producer or commercial grower (Pokorny, 1979). No
adjustments are made to pH or moisture content, and fertilizer is not added. Composting is the biological degradation of PB under carefully controlled conditions, where fertilizer, particularly N, is added, and pH, moisture, and aeration are carefully regulated. The advantages of
composting are in the reduction of the carbon to nitrogen ratio, which reduces the potential for nitrogen immobilization, and in the build-up of heat which kills pathogenic organisms (Pokorny,
8 most commonly used in the Southeastern U.S, but there is increasing interest in fresh bark
because of its lower transportation costs and perception that it might be more consistent from batch to batch.
The storage and management of organic substrate components, including PB, can greatly affect the physical, chemical, hydrologic, and biological properties of a substrate (Handreck and Black, 2010). Bulk materials for substrates should ideally be consistent in properties from batch
to batch (Carlile et al., year). Pokorny (1979) reported that of milled bark from six commercial nurseries, none of the barks tested were similar in particle size distribution or physical properties,
which means that different cultural programs are needed to grow a uniform crop in each different medium.
Much of the variability in PB substrates are due to differences in environmental,
mechanical, and processing/handling factors (Jackson, 2014). Environmental factors include the species of pine from which the bark is taken, the thickness of the bark at harvest, where the tree
is harvested, and the soil type the trees were grown in. Mechanical factors include the method of bark removal, and hammer-milling of the bark. During the debarking process, large slabs and
pieces of bark are removed from a log. Sawmills use ring debarkers or Rosserhead debarkers (Van Schoor et al., 1990), while most wood-panel and pulp and paper mills use drum debarkers. Ring, drum, and flail debarking machinery have different mechanisms of removing the bark, and
some may rip and/or tear the bark more than others. These large pieces of bark are then delivered to the bark supplier, and processed by hammer-milling and screening to reduce the particle size
9 bark, the screen size in the hammer-mill, and the horsepower, speed, torque, feeding consistency,
hammer type and amount of wear, hammer tip speed, etc. Processing factors refer to the ways in which bark may be processed (hammer-milled, screened) and aged. Fresh bark may be aged
without being hammer-milled and separated into different particle sizes first, while some
suppliers may separate bark nuggets from fines and age only the fines for use in growing media. Aging times may vary between suppliers, or even for the same supplier at different times of the
year. The resulting end-products are all sold to the consumer as “aged” PB.
The largest cost factor involved in using bark as a growing medium is transport (Van
Schoor et al., 1990). Interest in fresh PB has increased because of its lighter weight, which reduces transportation costs, as well as potential for improved consistency (Fields et al., 2012),
but little research has been done to investigate the differences between PB of various ages. Many of the differences are well known to growers and PB suppliers, but have not been documented or published in the literature. What has been published contains discrepancies about the effect aging
has on PB substrates, and the effective use of fresh PB. Laiche (1974), however, reported reduced plant quality in fresh PB due to difficulty maintaining adequate moisture levels during
the first three months after transplanting, and experienced difficulty in hydrating fresh PB. Self and Pounders (1974) have shown that plants can be grown successfully in fresh PB. Airhart et al. (1978) stated that both fresh and aged PB have been shown to become hydrophobic when
moisture content falls below 34% (by weight). Self (1978) stated that aging of PB is unnecessary except for stockpiling inventory and improving wettability. Nichols (1981) found that seedlings
10 fresh PB as compared to aged, with no difficulty hydrating the fresh PB or symptoms of
phytotoxicity, and the plants grown in fresh bark had equal or higher tissue levels of N,
phosphorus (P), calcium (Ca), and magnesium (Mg). Whitcomb and Appleton (1985) found that
four different woody ornamental species grew similarly in fresh and one-year old aged PB with or without starter N. The Silviculture (South) Division of the Forestry Commission’s Research Branch in England observed that fresh PB severely inhibited the growth of container-grown
plants as well as mushrooms, although this effect varied among PB from different species (Aaron, 1991). Svenson and Witte (1992) found no differences between fresh PB and PB that
had been composted for four months in terms of plant available nutrients, shoot dry weight, pH, physical properties, and particle size. Harrelson (2004) reported reduced growth of Cotoneaster
dammeri ‘Skogholm’ in fresh PB vs aged, due to lower container capacity and available water. Yap and Jackson (2012) showed that root growth of Thuja ‘Green Giant’ was not noticeably different in fresh vs. aged PB. In a study cited by Krewer and Ruter (2012), fresh PB had a water
holding capacity of about 13 % (by vol), while aged PB held 21 % water (by vol). Bilderback et al. (2013) found that PB is generally considered to be non-phytotoxic and can be used without
aging or composting but aging is preferred because fresh PB often has less than 20-30% fine particles, which results in reduced water holding capacity. Aged bark should theoretically hold more water due to an increase in the percentage of fines, increased uniformity of particle sizes,
and decreased hydrophobicity due to the decomposition of wood and cambium (Bilderback, 2002; Bilderback, et al., 2005; Jackson, 2014).
Research on the efficient utilization of PB is often carried out with insufficient
11 the authors reviewed that involve PB substrates, we found 10 that list the specific age of the bark
(Table, 1), and of those 10 articles four of them are studies that look at differences in bark throughout the aging/composting process (Table 1.1). One of these papers is by Cunha-Queda et
al. (2006) looking at the biochemical and microbial population changes in bark throughout a composting process. Two are by C.L. Davis et al. (1992 a,b) looking at microbial population numbers, physiology, and microbe speciation using plating techniques, SEM, and enzymatic
methodology from bark sampled from a commercial composting operation. The most in depth article about documenting the changes during the composting process is by Guedes de Carvalho
et al. (1991), who measured a number of physical, chemical, and biological parameters in a small-scale composting study. To our knowledge there is no commercial-scale research that has
been conducted to investigate the physical, hydrologic, and chemical changes throughout the aging process of PB. Bark substrates are evaluated for readiness of use by growers based on physical factors (dark color, earthy odor, temperature decline of piles), and chemical tests (C/N
12 Literature Cited
Aaron, J.R. 1976. Conifer bark: its properties and uses. Forestry Commission Forest record 110. Aaron, J.R. 1991. Bark becomes of age. Professional Hort. 5:74-76.
Airhart, D.L., N.J, Natarella, and F.A. Pokorny. 1978. Influence of initial moisture content on the wettability of pine bark medium. HortScience 13:432-434.
Bilderback, T.E. Managing Container Substrates.
Bilderback, T.E. 2002. Substrates for plants grown in big containers? Proc. N.C. Nursery Short Course 4:11-14.
Bilderback, T. E., Warren, S. L., Owen, J. S. & Albano, J. P., 2005. Healthy Substrates Need Physicals Too! HortTechnology 15:747-751.
Bilderback, T.E., C. Boyer, M. Chappell, G. Fain, D. Fare, C.H. Gilliam, B.E. Jackson, J. Lea-Cox, A.V. LeBude, A. Niemiera, J. Owen, K.M. Tilt, S. Warren, S. White, T. Whitwell, R. Wright, T. Yeager. 2013. Best management practices: Guide for producing
container-grown plants. 3rd Ed. Southern Nurserymen’s Assoc., Marietta, GA.
Bollen, W.B. 1969. Properties of Tree Barks in Relation to their agricultural utilization. USDA.
Northwest For. Rang. Expt. Sta. Res. Pub. PNW77.
Breitenbeck, G.A. and D. Schellinger. 2004. Calculating the reduction in material mass and volume during composting. Compost Science and Utilization 12(4):365-371.
Buamscha, M.G., J.E. Altland, D.M. Sullivan, D.A. Horneck, and J. P. G. McQueen. 2008. Nitrogen availability in fresh and aged douglas fir bark. HortScience 18:619-623.
13 Carlile, W.R. 2008. The use of composted materials in growing media. Acta. Hort. 779:321-328.
Cunha-Queda, A.C, H.M. Ribeiro, A. Ramos, and F. Cabral. 2006. Study of biochemical and microbiological parameters during composting of pine and eucalyptus bark. Bioresource
Technol. 98: 3213-3220.
Davis, C.L., S.A. Hinch, C.J. Donkin, and P.J. Germishuizen. 1992a. Changes in microbial population numbers during the composting of pine bark. Bioresource Technol. 39: 85–92.
Davis, C.L., S.A. Hinch, C.J. Donkin, and P.J. Germishuizen. 1992b. The microbiology of pine bark composting: an electron-microscope and physiological study. Bioresource Technol.
40: 195–204.
DeWerth, A.F. 1971. The use of pine bark in the production of ornamental crops. Texas A&M
Univ. Texas Agr. Expt. Sta. MP-991.
Fields, J.S., B.E. Jackson and W.C. Fonteno. 2012. Pine bark physical properties influenced by bark source and age. Comb. Proc. Intl. Plant Prop. Soc. 62:433-437.
Fitzpatrick, G.E., E.R. Duke, K.A. Klock-Moore. 1989. Use of compost products for ornamental crop production: research and grower experiences. HortScience. 33(6):941-944.
Gartner, J.B, S.M. Still, and J.E. Klett. 1973. The use of bark waste as a substrate in horticulture. ActaHort. 37:2003-2012.
Guedes de Carvalho, R.A., C.G. Gonzalez Beca, O.R. Neves, and M.C. Sol Pereira. 1991.
Composting of pine and eucalyptus barks. Bioresource Tech. 38: 51-63.
Handreck, K.A. and N. Black. 2010. Growing media for ornamental plants and turf. Sydney:
14 Harkin, J.M. and J.W. Rowe. 1971. Bark and its possible uses. USDA Forest Serv. Research
note. FPL-091.
Ingram, D.L, R.W. Henley, and T.H. Yeager. 1993. Growth media for container grown
ornamental plants. Univ. of Florida Coop. Ext. Bulletin 241.
Jackson, B.E. 2014. Substrate Discrepancies. Nursery Management. October, 30(10):14-26. Jorba, J., M.I. Trillas. 1983. Rapid Bioassay to Control Maturity in Pine Bark Compost. Acta
Hort., 150:67-73.
King, E H. 1927. Farmers of Forty Centuries. Jonathan Cape, London.
Laiche, A.J., Jr. 1974. Pine bark growing media. MAFES Res. Highlights. 37:1-3.
Lemaire, F. 1995. Physical, Chemical, and Biological Properties of Growing Medium. Acta
Hort., 396:273-284.
Lu, W., J.L. Sibley, C.H. Gilliam, J.S. Bannon, and Y. Zhang. 2006 Estimation of U.S. bark generation and implications for horticultural industries. J. Environ. Hort. 24(1):29-34.
Nelson, P. V., 2012. Greenhouse Operation and Management. 7th ed. Pearson, UpperSaddle River, NJ.
Nichols, D.G. 1981.The effect of Pinus radiata bark toxicity on the early growth of plants in containers. Sci. Hort. 15, 291–298.
Raviv, M. & Lieth, J. H., 2008. Soilless Culture Theory and Practice. San Diego: Elsevier.
Solbraa, K. 1974. Different bark qualities and their uses in plant cultivation. Proc. Symp. On the standardization of bark compost in horticulture. Ghent, 78-85.
15 Wenliang, L., Sibley, J., Gilliam, C., Bannon, J., Zhang, Y. 2006. Estimation of U.S. bark
generation and implications for horticultural industries. J. Environ. Hort. 24(1):29-34. Whitcomb, C. N.D. Where did that originate? Ground pine bark in container growth media.
<https://rootmaker.com/sites/default/files/pdf/WherePineBarkPressE.pdf>
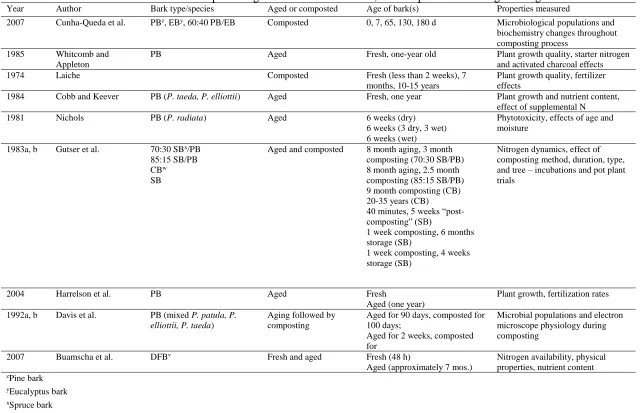
16 Table 1. Scientific literature that state the specific age of bark materials used, and the parameters being investigated.
Year Author Bark type/species Aged or composted Age of bark(s) Properties measured
2007 Cunha-Queda et al. PBz, EBy, 60:40 PB/EB Composted 0, 7, 65, 130, 180 d Microbiological populations and
biochemistry changes throughout composting process
1985 Whitcomb and
Appleton
PB Aged Fresh, one-year old Plant growth quality, starter nitrogen
and activated charcoal effects
1974 Laiche Composted Fresh (less than 2 weeks), 7
months, 10-15 years
Plant growth quality, fertilizer effects
1984 Cobb and Keever PB (P. taeda, P. elliottii) Aged Fresh, one year Plant growth and nutrient content,
effect of supplemental N
1981 Nichols PB (P. radiata) Aged 6 weeks (dry)
6 weeks (3 dry, 3 wet) 6 weeks (wet)
Phytotoxicity, effects of age and moisture
1983a, b Gutser et al. 70:30 SBx/PB
85:15 SB/PB
CBw
SB
Aged and composted 8 month aging, 3 month
composting (70:30 SB/PB) 8 month aging, 2.5 month composting (85:15 SB/PB) 9 month composting (CB) 20-35 years (CB) 40 minutes, 5 weeks “post-composting” (SB)
1 week composting, 6 months storage (SB)
1 week composting, 4 weeks storage (SB)
Nitrogen dynamics, effect of composting method, duration, type, and tree – incubations and pot plant trials
2004 Harrelson et al. PB Aged Fresh
Aged (one year)
Plant growth, fertilization rates
1992a, b Davis et al. PB (mixed P. patula, P.
elliottii, P. taeda)
Aging followed by composting
Aged for 90 days, composted for 100 days;
Aged for 2 weeks, composted for
Microbial populations and electron microscope physiology during composting
2007 Buamscha et al. DFBv Fresh and aged Fresh (48 h)
Aged (approximately 7 mos.)
Nitrogen availability, physical properties, nutrient content
zPine bark
yEucalyptus bark
xSpruce bark
wConifer bark
17 CHAPTER 2
18 Abstract.
Pine bark (PB) is one of the most commonly used horticultural substrates, and may be used as a fresh, aged, or composted product. Aged PB, which is the process of leaving PB inventories
outdoors for a variable period of time with no moisture, pH, or nitrogen adjustments, is what is most commonly used; however, fresh PB may also be used successfully, but there is little
research conducted that investigates the difference between bark over a monitored aging process.
A twelve month study was initiated to better understand the effects of aging and pile
management on PB substrates. The study was conducted at TH Blue, Inc., a PB supplier in Eagle
Springs, North Carolina. Fresh PB was processed and the fines were placed in three pile
replications of 191 cubic meters each. Piles were turned monthly. Beginning at time 0 and every
4 to 5 weeks, one week after turning, stratified subsamples were taken from each pile at three different heights (top, middle, and bottom) at horizontal depths within pile of 0.3 - 1.2 m to account for variations in pile depth and height. The stratified subsamples were mixed into one
composite sample for each pile replication and physical properties of the bark were tested. Physical properties included pile volume, temperature, particle size distribution (PSD), total
porosity (TP), container capacity (CC), air space (AS), bulk density (BD), white wood content (WW), color, and sand content. At the beginning of the aging process there was a rapid increase in pile temperature with a 4-month thermophilic phase ranging from 52.7 to 57.3 °C, after which
temperatures decreased during months 5 and 6 and reflected changes in ambient conditions during the remainder of the study. Color changes followed a similar trend as the temperature
19 4.75 and 9.5 mm and an increase in PSD between 0.25 and 1.0 mm from months 0 through 12.
There were no differences in TP after month 0 with values around 83-85% from months 2 through 12, while CC increased from 34.5 to 51.2 %, AS decreased from 42.5 to 32.2%, and BD
increased from .18 to .20 g/cm3, further illustrating the shift to greater amounts of fine particles over time, resulting in smaller pore sizes within the same pore volume. White wood content decreased from 3.4 to 2.2% in weight and 6.4 to 3.8% by volume, and sand content increased
from 2.8 to 20.2% by weight and 0.43 to 3.19% by volume. Pile volume decreased from 74.7 m3 to 51.9 m3 while pile BD increased from 365 to 537 kg/m3. The results from these tests indicate
20 Introduction
Bark, especially softwood or pine bark (PB), is one of the most commonly used substrate
components for both greenhouse and nursery crop production. It is obtained as a byproduct of the timber industry when it is stripped off logs after harvest, and is then hammer milled and screened to obtain a desirable particle size for plant growth. The advantages of using PB as a
horticultural substrate are numerous: the fact that it is 1) a waste product; 2) a renewable resource; 3) it is less expensive than peat moss; 4) processing PB by hammer-milling and
screening can allow for reproducibility and consistency; 5) PB substrates can have good drainage and aeration; and 6) PB has been shown to contain most minor elements essential to plant growth
(Pokorny, 1979; Van Schoor et al., 1990). It also decomposes at a slower rate than hardwood bark and other composts/green waste, which can help maintain a stable air-water relationship in the substrate and reduce the risk of poor drainage and overwatering (Pokorny, 1979).
Pine bark is used as a composted, fresh, or aged product (Bilderback, 2002); however, some disagreement exists as to whether fresh PB can be used as successfully as aged or
composted PB (Bunt, 1988). Composted PB refers to the end product of a carefully monitored process in which moisture content and pH are adjusted, piles are turned frequently, and nitrogen (N) is added to stimulate microbial populations and reduce the cellulose content of fine PB
particles and fiber to humus through decomposition (Self, 1978). Fresh PB refers to material that is ground, screened, and sold/used soon afterwards (Buamscha et al., 2007). Aging refers to the
21 turned to provide aeration and consistency, but the frequency of turning may vary among
suppliers. Aged PB may be referred to as “composted,” but in the strictest sense, unless it is amended with a nitrogen source, moistened, and turned on a regular basis, it may not truly
compost (Bilderback, N.D.). Aging times can vary between suppliers, or even for the same supplier, depending on inventory and the time of the year (Jackson, 2014). The composting process, while producing a high-quality end product, is used less frequently due to the fact that it
is a more labor and resource intensive process. Aged PB is most commonly used in container production; however, there is interest and demand for fresh PB due to its lighter weight (resulting
in lower freight costs), quick turnaround time for the supplier, and perception by some growers that it is a more consistent product than aged PB.
The storage and management of PB, such as duration of aging, pre-processing conditions, and manufacturing methods can have a great effect on altering the physical properties of a
container mix (Bilderback, 2002). The desirable physical characteristics of container media can
be described in terms of their bulk density (BD), total porosity (TP), container capacity (CC), and air space (AS; Bunt, 1988). Bulk density of a substrate is described as its dry mass per unit
of volume (Raviv and Lieth, 2008). TP is defined as the combined volume of the aqueous and gaseous phases of the substrate, not occupied by mineral or organic particles (Bunt, 1988), and is related to the shape, size, and arrangement of substrate particles. In many cases, TP and BD are
inversely related (Raviv and Lieth, 2008). AS is the volumetric percentage of the substrate that contains air at the end of free (gravitational) drainage (Raviv and Lieth, 2008). Container
22 soils; however, the amount of water retained in a horticultural substrate will be greater than that
present in a mineral soil at field capacity (Bunt, 1988). Fresh PB has been shown to have higher AS, lower container capacity CC, and lower available water content when compared to aged
bark, which could require changes in irrigation management (Bilderback et al, 2005). Container weight is a function of a substrate’s BD and CC. Heavier containers are less likely to blow over in a nursery, but their shipping costs will be higher. In addition, some insecticide applications use
rates based on substrate BD (Buamscha et al., 2007)
Particle size distribution (PSD) affects, and is used to make inferences on, the physical
properties of a substrate, including air and water relationships (Bilderback et al., 2005; Tilt et al., 1987), because of its influence on surface area to volume ratios and pore sizes (Bollen, 1969).
The ratio of small, medium, and large particles determines the percent pore space at CC and moisture retention of the substrate. Large particles should be small enough to avoid irrigation issues, but large enough to ensure a high porosity, and an adequate number of fines are needed to
raise or maintain adequate moisture holding properties (Hoitink and Poole, 1980). Fine particles less than 0.5 mm are generally considered responsible for moisture retention in containers
(Bilderback et al., 2013).Van Schoor et al. (1990) found that the percentage of fine particles (<0.5mm) in PB substrates is highly linearly correlated to AS, with AS decreasing with higher proportions of fine particles. An adequate proportion of fine particles is also needed to increase
cation exchange capacity (CEC); Altland et al. (2014) found that CEC of PB substrates increased with decreasing particle size, and Daniels and Wright (1988) reported a drop in CEC among PB
23 As PB ages, there will be an increase in smaller particles over time due to mechanical
breakdown from turning and microbial activity. During this degradation process, the mass and volume of the material decreases due to decomposition by oxidation of organic carbon to CO2,
and the breakdown of structural organic components to form a matrix of smaller particles with a greater BD (Breitenbeck et al., 2004). Breitenbeck (2004) found that volume reduction of PB piles during a composting process was due as much, if not more, to reductions in particle size
and pore volume as to mass loss from microbial activity. This increase in BD over the course of aging may result in higher freight costs when compared to fresh PB.
During the debarking process pine wood (xylem) may accompany the bark, and this wood is referred to as white wood (WW). WW content in PB substrates is variable, and
influenced by many factors including tree species, time of harvest, bark thickness at time of removal, variations in processing (including aging of piles), and debarking method (Jackson, 2014; Solbraa 1974). Ring and drum debarkers remove little wood from logs and generally
produce bark with a wood content of less than 10% (Hoitink and Poole, 1980). Fresh PB tends to have more white wood than aged PB because it has had less time to break down; however, even
after aging much of the white wood may remain, but it is stained and more difficult to see (Jackson, 2014). The method of debarking also affects white wood content. There are no official standards in place for white wood content in PB substrates; however, a general suggestion is that
10-15% WW is acceptable (Jackson, 2014; Mulch and Soil Council, 2007). In the past, growers preferred PB with little to no white wood; however recent research has shown that white wood is
24 found that physical properties did not change significantly after the removal of WW from bark.
White wood content of 10-15% in a bark substrate may not affect physical properties if the particle size distribution of WW is like that of the bark, but as little as 5 % WW content with a
large particle size (length or diameter) can greatly change the physical properties of PB
substrates (Jackson, 2014). Fields et al. (2012) found that WW content of aged PB was less than half of that of fresh PB from the same supplier, but no significant change was seen in any
physical property after the removal of WW from any of the fresh or aged PB samples that were tested. The BD of WW (approximately 0.14 g/cm3) is lower than that of bark, which indicates
that the addition of WW may lower the weight of PB without altering other physical properties (Fields et al., 2012). In terms of pile management, it has been reported that wood and cambium
in fresh PB may stimulate rapid decomposition, moisture loss, and heat in inventories (Bilderback, N.D).
Temperature profiles during the aging process are characterized by 1) a rapid initial
increase in temperature, 2) a sustained high-temperature period (thermophilic phase), and 3) a decline to near-ambient temperatures. The initial rise and high temperature period is caused by
exothermic reactions associated with the microbial degradation of the readily biodegradable organic matter in PB, and the duration of the subsequent thermophilic phase is determined by the cellulose content (Hoitink, 1980). The decrease in temperature after the thermophilic phase
ideally occurs due to a decrease in microbial activity as the easily biodegradable materials are consumed and more resistant compounds such as cellulose and lignin remain (Wichuk and
25 occur upon turning the pile. However, pile temperature may be affected by ambient conditions
(particularly in cold climates), pile size, extreme temperatures during the thermophilic phase, low AS, oxygen depletion, drying, and excessively high moisture (Wichuk and McCartney,
2010). Ambient conditions such as low temperatures and high winds can lead to heat loss and premature pile cooling, and smaller piles tend to heat up and cool more rapidly than large piles under similar environmental conditions, since their higher surface area to volume ratio provides
less thermal insulation. As a result, in certain circumstances a small pile that has cooled may not be mature, while a large pile that is still warm may actually be stable (Wichuck and McCartney,
2010). There is also a strong temperature gradient within a pile. Temperatures will be lower at the bottom and higher at the top, creating a ‘flue’ effect which draws air into the bottom of the
pile (Van Schoor et al., 1990).
The heat created during the thermophilic phase of the decomposition process causes the color of the stockpiled PB to become darker (Self, 1978). Initially the PB may be a lighter brown
or reddish brown, and as the biological activity declines over time the compost will become a dark brown or black as the rate of change in biological activity changes imperceptibly
(Thompson, 2002). Color is a sensory parameter that is frequently used anecdotally in the industry when discussing age and usability of PB inventories or substrates. The measurement of color changes has been suggested as a parameter to determine stability in composting systems
(Thompson, 2002; Wichuk and McCartney, 2010), but has not been quantified in the literature for PB.
26 through improved water holding capacity and reduced water infiltration rates are, which promote
better hydration (Krewer and Ruter, 2012). Brown and Pokorny (1975) found that amending PB with sand decreased percolation rate and increased bulk density. Niemiera et al. (1994) reported
that PB substrates with 9:1 and 5:1 bark/sand ratios had decreased drainage, TP, AS, and unavailable water at 1.5 kPa tension; and increased AW, BD, and solids content. Greater
concentrations of small pores in the 5 PB: 1 sand substrate allowed for less percolation and pore
dispersion of solution than 100% PB, which demonstrated greater channeling and less retention of water/nutrient solutions (Niemiera et al., 1994). Sand also increases the proportion (by weight)
of smaller particle size fractions (Brown and Pokorny, 1975; Niemiera et al., 1994). This can increase available water due to the addition of sand created micropores that hold water less
strongly than the surface and intraparticle water adsorption sites of PB particles.
The objective of this research was to investigate and quantify the changes in the physical properties of PB during 12 months of managed aging. While both aged and fresh PB can be used
successfully, little research has been conducted to investigate the differences in physical
properties between fresh and aged PB, or PB of specific ages. Additionally, the actual age of PB
used for research in the literature is usually not reported and is either listed as “fresh” or “aged” (if age is mentioned at all), making it hard to extrapolate anything more than general trends. PB that has been aged for three months may be very different from bark that has been aged for
twelve months, and both may be reported in the literature as aged, or sold to a grower as aged, but with different results. This is a factor that leads to high variability in PB substrates, which
can be a concern for growers and the substrate industry.Another concern is substrate
27 component. As a result, there has been a greater interest in developing and using locating and
using substrates from local materials, such as loblolly or longleaf PB in the southeast, to reduce transportation costs (Jackson and Fonteno, 2014) and/or potentially grow and create on-site.
Assessing the properties of PB of different ages will help to understand variability in PB substrates, and aid in the further development and optimal use of these local and sustainable materials to grow horticultural crops.
Materials and Methods
Sampling. The study was implemented on 20 Aug. 2015 at a commercial PB supplier (TH Blue Inc, Eagle Springs, NC). Longleaf PB (Pinus palustris Mill.; Appendix A.A) from two lumber
companies, Jordan Lumber Company (Mt. Gilead, NC) and Troy Lumber Company (Troy, NC) was obtained the week of 17 Aug. 2015 and 15 truckloads were unloaded on the research site for further processing (Fig. 2.1A). The bark was passed through a hammer-mill (Fig. 2.1B;
Appendix AB) and screened (Powerscreen Chieftan, Duncannon, UK) into three fractions: nuggets (Appendix AC), mini nuggets (Appendix AD), and fines (Fig. 2.1C, Appendix AE).
Fines were passed through a 1.27 cm screen. Nuggets and mini-nuggets are sold as mulch, and fines are stockpiled and aged for eventual use as a nursery substrate. The < 1.27 cm fraction was placed in three piles of approximately 191 m3 each, with dimensions of approximately 16.8 m x
10.1 m x 3.2 m (Fig. 2.1D). These were treated as replications. Piles were turned every four to six weeks (Table 2.1) using a front-end loader. The piles were sampled at the time of installation
28 the methods outlined in the US Composting Council’s Test Methods for the Examination of
Composting and Compost (Thompson, 2002). At each sample date, stratified subsamples were taken from different heights (top, middle, and bottom) and horizontal depths (0.3, 0.6, 0.9, and
1.2 m) within each pile. Three locations within each height were randomly selected for sampling by conceptually treating the pile as a three-dimensional grid (Fig. 2.2A), equaling 9 sampling locations per pile. At each of the 9 sampling locations, subsamples were taken by digging a hole
to a depth of 1.2 m, and removing 3 L of bark from the surface every 0.3 m (five subsamples; Fig. 2.2B). This sampling procedure accounts for variation within a pile and reduces possible
errors due to stratification of constituents and conditions within the piles (Breitenbeck, 2004). All subsamples per sampling location were composited on-site by placing them into a 4-mil poly
bag (61 cm x 76.2 cm; Consolidated Plastics, Stow OH) and sealing with a zip-tie to prevent moisture loss. Samples were transported to the Horticultural Substrates Laboratory (North Carolina State University, Raleigh, NC) for storage and subsequent analysis. For each pile,
approximately 8 L of PB from each of the 9 sampling locations were mixed into a composite sample for testing. When not being used for testing, samples were stored indoors in sealed, 4 mil
poly bags at 4°C to minimize any moisture and microbial changes during storage.
Dimensions and volume. The dimensions of each pile were measured manually at each sample date using a 60 m open reel fiberglass tape measure (Apex Tool Group LLC., Sparks, MD).
Measurements taken included the length of the bottom of the pile (L), length of the top of the pile (Ltop), width (W), height (H), and circumference. The volume of each pile was calculated by
29 volume of cone = .262 x CD x CD x H
volume of a triangular prism = H x W x Ltop / 2
Drone imaging. Drone technology is increasingly being utilized for three-dimensional mapping
and inventory control of piles, and has the potential to quickly, efficiently, and cost effectively measure pile volume. To compare this technology to the method used above for measuring pile volume, the research site was mapped on9 Sept. 2016 using a Phantom 4 drone (DJI, Shenzhen,
China) equipped with 3D mapping software (DroneDeploy, San Francisco, CA). To create the map, multiple overlapping photos (80 to 90% overlap) of the site were taken as the drone flew
along an autonomous programmed flight path called a waypoint. To create a waypoint, the area to be flown was outlined on a base layer map, and the software generated a flight plan. The entire
mapping process was automated: following a safety check, the drone automatically took off and flew along the automated flight path and captured images, and then landed back at the starting point. 171 photos were taken from the flight and were uploaded to DroneDeploy to be processed. DroneDeploy’s cloud-based processing stitched the images together to create a model of the site.
To determine the volume of the piles, the area we wished to measure was located in the “2D map” and under the “annotations and measurement” section, “volume” was selected, in which
each pile was outlined, and the volume of the outlined area was calculated (Appendix B). This was done for each pile, and the resulting values were compared with the manual measurements
for month 12.
Temperature. Pile temperatures were measured on-site at each sample date. Measurements were
30 Mountain Technologies, Bainbridge Island, WA.). Three probes were inserted into the three
different pile heights, starting at a depth of 0.3 m, and were manually pushed into the pile in 0.3 m increments allowed to stabilize for 5 to 15 min between readings (depending on the degree of
change in temperature readings) at each depth until the full length of each probe (1.2 m) was inserted into the pile. Temperature data were analyzed as separate readings at each height and depth, as well as averaged across all pile heights and depths to give an average pile temperature
per sample date.
Thermal imaging. The temperature of the pile surface, as well as PB temperature during pile
turning on 13 Nov. 2015, were measured using a thermal imaging camera (FLIR C2, FLIR Systems, Wilsonville, OR). Surface temperature images were taken by placing the thermal
imaging camera on a tripod at a distance of 19 m. Thermal imaging was used to measure pile temperature one day after installation (21 Aug. 2015) in the middle height zone of the piles at a depth of 1.2 m by digging holes into the piles and photographing the inside of the hole
(Appendix CB). Periodically, thermal images were also taken of sampling sites at various depths to compare the camera readings with temperature probe data.
Color. Within 48 h after each sampling time, the color of samples was analyzed using a Munsell Soil Color Book (Munsell Color, Grand Rapids, MI) as described in the US Composting
Council’s Test Methods for the Examination of Composting and Compost (Thompson, 2002).
Munsell Soil Color consists of approximately 250 colored chips with corresponding apertures arranged on hue cards. Three coordinates - hue, value, and chroma - describe the possible colors
31 soil color. The hue cards include 10R, 10YR, 2.5Y, 2.5YR, 5Y, 5YR, 7.5YR, 10Y – 5GY, Gley
1 and 2, 5R, 7.5R, and white. Value indicates the degree of lightness or darkness of a color on a gray scale ranging from black to white. In the Munsell Soil Color Book, value ranges from 0
(pure black) to 10 (pure white). Chroma is the purity or saturation of a color. Chroma ranges from 0 (neutral colors) to 8 (most vivid color) in the Munsell system. Samples are read as hue value/chroma, e.g. 5YR 3/2. Three 500 mL replications of PB from each pile replication per age
(9 replications per sample date) were spread out on a small tray and measured indoors in bright, ambient cool white fluorescent lighting, at the moisture content of the material at the time of
sampling, which was between 50-60%. It is important that samples are measured at the MC at which the color does not change with additional water additions. Color was analyzed by placing
the sample directly behind the apertures on the hue card separating the closest matching color chips. In the case of color differences within samples, the dominant colors were used for measurement (Fig. 2.3).
Particle size distribution. From each composite pile sample per sample date, approximately 3 L of PB was spread out to a depth of 2 cm on a drying pan and placed in a forced air dryer for 48 h
at 105 °C. Particle size distribution was determined by passing three 100 g replications of the dry PB through a column of twelve sieves (W.S. Tyler, Mentor, OH) with screen sizes of 12.5, 9.5, 6.3, 4.75, 2.8, 2.0, 1.4, 1.0, 0.71, 0.5, 0.25, and 0.106 mm, with a pan at the bottom to collect the
particles that passed through the 0.106 mm sieve. The column of sieves was placed in a Ro-Tap Shaker (W.S. Tyler, model B; Mentor, OH) and shaken for five min. The sieves were separated
32 of the total weight of the 100 g sample. Three replications were analyzed from each pile
replication, equaling 9 total replications per sample date.
Porometer. Physical properties including AS, CC, TP and BD were determined at each sample
date using the North Carolina State University Porometer method (Fonteno and Harden, 2010). Samples were tested at a moisture content of 60% as recommended by Fonteno and Harden (2010). Three replications were analyzed from each composite pile replication, equaling 9 total
replications per sample date. Bulk density was also calculated at sample moisture content using the pack weight and core volume to give a representation of BD “as-is” on-site, to provide
insight into freight costs for bark of different ages, and to investigate the relationship between pile BD and volume over time. While this is not the standard procedure to measure BD, which is
measured on a dry weight basis, it may give us insights into transportation costs associated with PB of different ages.
White wood content. Approximately 3 L of PB from each composite pile sample from months 0,
3, 6, 9, and 12 were spread out to a depth of 2 cm on a drying pan and placed in a forced air dryer for 48 h. at 105°C. The dried bark was separated into three 200g replications per pile
replication (9 replications total per sample age), and WW of 0.5 mm or greater in length were manually separated from the bark. WW and bark were weighed separately, and WW content is expressed as a percentage of the total weight of the 200 g sample. The percent volume was also
calculated by placing the WW and bark in 50 and 1000 mL beakers, respectively, and recording the volume of each.