Comparison of ICA Non-gaussianity Methods
Using Performance Metrics as Correlation
Coefficient, Average Execution Time and
Computational Speed
Supriya S. Ankushe 1, Dr. Dharmpal Doye 2
Department of Electronics and Telecommunication Engineering, S. G. G. S. I. E. & T. Nanded, Maharashtra, India
ABSTRACT: New approach is proposed for comparision of two different blind source separation algorithms for audio source separation based on higher order statistics using Independent component analysis non-gaussianity measures, namely Kurtosis and Negentropy. In this new approach, three new performance metrics are added. They are correlation coefficient, average execution time and computational speed of estimation process. The results show that Negentropy provides better execution time, optimal correlation coefficient with minimum number of iterations compared with Kurtosis..
KEYWORDS:Kurtosis; Negentropy; Blind source separation; Independent component analysis; non-gaussianity
I. INTRODUCTION
The problem of separation of audio sources with microphones placed at different locations, in real time, is often referred to as the cocktail-party problem [12]. Audio source separation problem has been examined using the Independent Component Analysis (ICA). ICA is an efficient process for blind source separation (BSS) using the assumption that original sources are mutually independent and non-Gaussian [12] and [7].ICA has applications in the field of signal processing and data analysis.
BSS refers to the fact that, the mixing process is unknown i.e. with a previous knowledge about the characteristics of the source signals and the way of mixing. In this paper, focus is on Independent Component Analysis (ICA), as a solution to resolve the problem of blind separation of audio sources. It is used for estimation of independent components given a set of observed mixture of source signals. In order to enhance the non-gaussianity of source signals, implemented two different ICA algorithms as Kurtosis and Negentropy [12] and [6]. The new approach was used to compare performance of these algorithms.
BASIC ICA MODEL
The simplest case for ICA is the instantaneous linear mixing and demixing model [2],[3] and [12]. Basic architerature of ICA is as shown in Fig.1.
Fig.1: Basic mixing and demixing model of ICA.
In this case mixing process can be expressed as,
X=AS eq. (1)
where Ais the mixing matrix. Mixed signals or recorded signals are the result of microphones, where two persons are talking simultaneously, with two microphones placed at different location in a room [2]. So we could express this by linear equations as,
x
1(t)
=a
11s
1 +a
12s
2 eq. (2)x
2(t)
=a
21s
1 +a
22s
2 eq. (3)where
a
11,a
12, a21, anda
22 are the parameters that depend on the distances of the microphones from the speakers.In this process the mixed signals are obtained from statistically independent and non-Gaussian source signals. Here the source signals s1 and s2 are estimated from the mixed signals x1 and x2 using ICA. This is known as blind
source separation [12]. In the following, W=A-1denote the demixing matrix.Then the estimated source signals Y
are,
Y=WX eq. (4)
II. RELATED WORK
ICA is a popular method for blind source separation (BSS) using the assumption that original sources are mutually independent. It is a statistical signal processing technique which has several applications in the field of signal processing and data analysis. It is a powerful and useful tool to extract independent components given a set of observed mixture of source signals. A. Hyvärinen and E. Oja [12], deals with the basic theory and applications of ICA. It also explains principles and ambiguities of ICA. ICA has been described using measures of non-Gaussianity such as Kurtosis and Negentropy for one unit and several units.
M. K. Nath. [7], has proposed the approach for underdetermined BSS. The conventional ICA estimation method has been combined with binary time-frequency masking. Delayed and filtered versions of the source signals have been taken into consideration, so mixing model is better approximated by using convolutive mixtures.Y. Jianning and F. Yi. [2], proposed the method that, using ICA the mixed chaotic signals can be separated signals can be separated assuming only independence of source signals. Previously there are some other methods to separate the mixed chaotic signals but they have to use internal properties of signals and special constraints
L. Hongyan and R. Guanglong [5], deals with BSS evenly with the presence of noise. In this a method based on single channel ICA speech enhancement algorithm and FastICA algorithm is proposed to separate noisy mixed speech signals. In this first single channel ICA speech enhancement algorithm is used to denoise for each mixed noisy speech and then ICA algorithm to separate denoised speech signals. Kurtosis, which is widely used measure of non-Gaussianity is used for ICA estimation because it is a Fixed-point iteration scheme. Finally, this method reduced the effect of noise and improve the signal to noise ratio of separated signals.
overcomplete ICA where the number of sources are greater than number of sensors and undercomplete ICA where the number of recordings are more than the number of sources. It has proposed a technique while there may be a degree of dependency among the wideband source signals, narrow band filtering of these signals can provide independence among signal sources.
A.E. Mahmoud, Reda A. Ammar, Mohamed I. Eladawy, Medhat Hussien [6],
in this paper, algorithms of BSS using Kurtosis, Negentropy and Maximum Likelihood have been evaluated using metrics such as number of samples, time required for computation and number of sources. A new hybrid approach has been developed which combines algorithms in such a way that, Maximum Likelihood algorithm is used to find separation matrix and then the matrix is tuned to Kurtosis algorithm.III. PROPOSED ALGORITHM
A. Design Considerations:
1. ICA ASSUMPTIONS
For recovery of individual source signal from mixture, source signals must satisfy following assumptions.
1) Count for no. Of source signals and microphones: Count for source signals should not be greater than the number of mixed signals from microphones.
2) Statistical independence of source signals: In terms of probability density function, for statistical independence between two random variables s1 and s2 with p(s1, s2) be the joint probability density
function of s1and s2, marginal probability density functions of s1and s2 be p1(s1) and p2(s2)
respectively, if probability density Function satisfies following equation,
p
(
s
1,
s
2)
p
1(
s
1).
p
2(
s
2)
eq. (5)
3) Invertibility of mixing matrix: Mixing matrix should be invertible, then only we can estimate demixing matrix, required parameter for ICA algorithms.
4) Non-gaussianity of source signals: With assumption that, the source signals are Gaussian and mixing matrix is orthogonal. Then x1and x2 are Gaussian uncorrelated, and of unit variance. This
distribution is illustrated in Fig.2.
Fig.2: Multivariate distribution of two independent Gaussian variables.
2. ICA AMBIGUITY
ICA has ability to estimate original source signals from recorded signals, but with following ambiguities.
1) Permutation ambiguity: Permutation ambiguity is related to the determination of the order of the independent components.
2) Magnitude and scaling ambiguity: Magnitude ambiguity is related to amplitude of estimated signals.
Scaling ambiguity is related to inability of ICA algorithm to determine variances of the independent components [12]. Also, signs of the sources cannot be determined.
Since more important information about source signals is contained in temporal waveform, rather than in amplitude or order, so in many applications of ICA these limitations are ignored.
3. ICA PREPROCESSING
Before applying ICA algorithms, it is usually beneficial to perform preprocessing steps on the mixed signal for better and easier estimation of the original signals.
1) Centering of mixed signals: For centering of data X, substract mean , m=E(X) of data from data X, to make data X as zero mean.
X
c X -E[X]eq. (6)
2) Whitening of mixed signals: After centering, mixed signals are whitened. It includes linear transformation of data, with new components as uncorrelated and of unit variance. Mathematically, whitening is verified as covariance of whitened signals must result into an identity
4. BASIC ICA CLASSIFICATION
Based on count for source signals and mixed signals, ICA can be classified as below.
1)Under-determined ICA: Count for source signals should be less than count for mixed signals, for such case recovery of sources is possible. For better results in real time, number of sources must be at least equal to or less than number of mixed signals
2) Over-determined ICA: Count for source signals should be greater than count for mixed signals, for such case better recovery of sources is not possible.
B. Description of the Proposed Algorithms:
ICA ALGORITHMS: ICA algorithm applies higher order statistics for recovery of the independent source signals. Deflation approach involves estimation of ICs one by one while symmetric approach involves estimation of ICs simultaneously. Two quantitativemeasures of non-Gaussianity used in ICA estimation areKurtosis and Negentropy.
1. KURTOSIS BASED ICA ALGORITHM
Kurtosis is an efficient measure of non-Gaussianity [2] and [6]. It is fourth order moment of the data with constant variance. The Kurtosis of X, for a zero mean variable is given by
Kurt(X)E[X4
]3(E[X2 ])2
eq. (7)
It is the measure of peakedness of data i.e. whether the data is peaked or flat relative to a normal distribution. Signals with negative values of Kurtosis are called as Subgaussian or Platykurtic and for positive values of Kurtosis are called as Supergaussian or Leptokurtic.
PSEUDO CODE:
Stepwise procedure for ICA Kurtosis:
1. Centering of the mixed data to form it as zero mean. 2. Whitening of the centered data to obtain whitened signal Z.
3. Select an initial guess of unit norm W.
4. W WTZ]3}-3W||W||2
5. W W/‖‖ W‖‖
2. NEGENTROPY BASED ICA ALGORITHM
Non-gaussianity is measured by the approximation of Negentropy. As per information theory, Gaussian signal is having the highest entropy amongst all the distributions. Negentropy is a modified form of differential entropy [12] and [6]. In the following, Sgauss is the Gaussian signal with covariance matrix same as that of source signal S. Non-negative Negentropy J is a normalised form of entropy which is represented as
J
(
s
)
H
(
s
gauss)
H
(
s
)
eq. (8)Gaussian signals have zero Negentropy value. Hence Negentropy of non-Gaussian signals is always positive.
PSEUDO CODE:
Step wise procedure for ICA Negentropy: 1. Centering of mixed data to form it as zero mean. 2. Whitening of centered data to obtain whitened signal Z.
3. Select an initial vector W of unit norm. Wg(WTZ
)}-
E{g’(
WTZ)}W, where non-linearity function g is given by,g1(y)= tanh (y) g2(y)= y exp(-y2/2)
4. Let, W W/‖‖ W‖‖
5. If condition of convergence is not satisfied, return to step 4.
IV. SIMULATION RESULTS
A. Simulation results of algorithms implemented
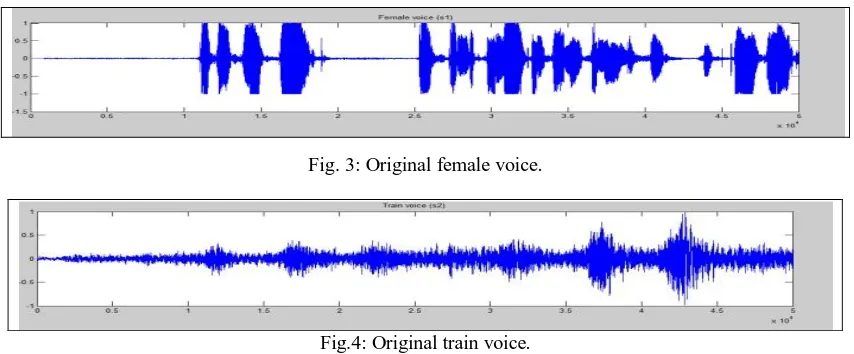
In this simulation two source signals female voice and train voice, recorded from external sources are used. The source signal S, produced by adding the two source signals is multiplied with random matrix A to get a mixed signal. The whitened signal is obtained after preprocessing on mixed signal Fig. 3 and Fig. 4 are the two source signals (female and train voices respectively).
Fig. 3: Original female voice.
Fig.4: Original train voice.
Fig.5: Mixed signal waveform.
Fig.6: Whitened signal waveform.
Then demixing matrix is found by using selected ICA measures as Kurtosis and Negentropy algorithm as explained above. After the implementation of algorithms, estimated signals are shown as below in Fig.7 and in results of Kurtosis we found order ambiguity.
Fig.7: Estimated signals.
B. Illustration of ICA in terms of Scatter plot
Here, is the actual illustration of ICA, joint distribution of two random variables (signals) in terms of scatter plot. Source signals have uniform distribution on rectangle, as source signals are statistically independent. Mixed
signal is generated by multiplying source signals with mixing matrix A. Mixed signals have joint distribution on parallelogram.
After applying preprocessing as centering and whitening, we get joint distribution of whitened signals as rotation of joint distribution of original, but source signals are still not statistically independent. Then to enhance statistical independence between estimated signals apply ICA algorithm, we get joint distribution of estimated signal same as that of original in Fig. 8
Kurtosis based ICA(Order Ambiguity) Negentropy based ICA
Estimated train voice Estimated female voice
Fig.8: Scatter plot results.
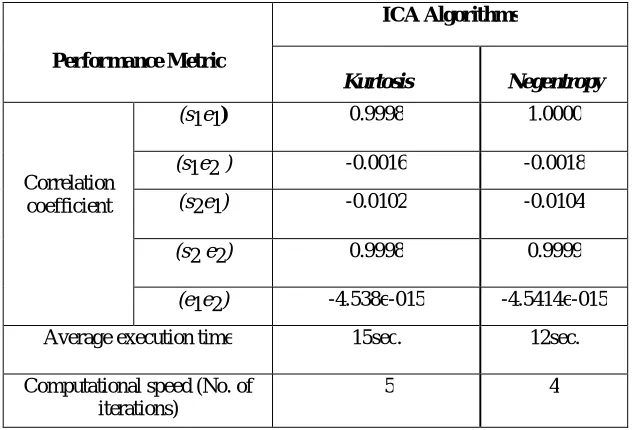
C. Comparison of ICA Algorithms
Many researchers have introduced several algorithms to have solution over the problem of BSS, in past years The evaluation of these algorithms need to be done to select best out of them for given application. Here we have compared two algorithms, Kurtosis and Negentropy using three different performance metrics.
1. Correlation coefficient:
The correlation coefficient is statistics that determines, how much two random variables are correlated i.e. degree of similarity between them. Here we have calculated error in terms of correlation coefficient.
The correlation coefficient is calculated as
Corrcoef (a, b)Cov(a, b)/ Cov(a,a) Cov(b,b) eq. (9)
For two signals to have higher correlation, value of correlation coefficient must be near to unity. value of correlation coefficient achieves value near to zero, then correlation between signals degrades.
2. Average execution time: The time required for an algorithm to retrieve individual source signals from mixture.
3. Computational speed : Computational speed is calculated as count of iterations required to reach the convergence condition in algorithms.
Table I : Performance for Female voice and Train voice
Table II shows the results for audio files as siren of police and drum voice, for the case when there is no order ambiguity in estimated signals i.e. estimated independent components order is not changed in the simulation results. Let us assume that original audio file of siren of police voice as s1, original drum voice as s2, estimated siren police voice as e1and estimated drum voice as e2.
Table II: Performance for Siren of Police Voice and Drum Voice
Performance Metric
ICA Algorithms
Kurtosis Negentropy
Correlation coefficient
(s1e1) 0.9998 0.9999
(s1e2 ) -0.0167 -0.0327
(s2e1) -0.0202 -0.0363
(s2 e2) 0.9998 0.9999
(e1e2)
8.5347e-016 5.9895e-016 Average execution time 20sec. 16sec.
Computational speed (No. of iterations)
6 5
V.CONCLUSIONANDFUTUREWORK
This paper shows that ICA algorithm based on Negentropy provides higher efficiency in estimating source signals
Performance Metric
ICA Algorithms
Kurtosis Negentropy
Correlation coefficient
(s1e1) 0.9998 1.0000
(s1e2 ) -0.0016 -0.0018
(s2e1) -0.0102 -0.0104
(s2 e2) 0.9998 0.9999
(e1e2) -4.538e-015 -4.5414e-015
Average execution time 15sec. 12sec.
Computational speed (No. of iterations)
algorithm based on Kurtosis. In future some modifications have to be done in design considerations of the proposed algorithm. The assumptions used for ICA are too restrictive for real data. This is because nature of real data cannot be predicted. There is a need of a generalized algorithm which works on both Gaussian distribution and non-Gaussian distributions. Also, in real data noise should be taken into consideration.
REFERENCES
1. Pardeep Sharma, Rajesh Mehra, and Naveen Dubey, “Blind audio source separation using weight initialized Independent component analysis”, 2015 1st International Conference on Next Generation Computing Technologies (NGCT-2015), pp. 563-566, 4-5 Sept. 2015 , Dehradun, India
2. Y. Jianning and F. Yi, “Blind Separation of Mixing Chaotic Signals Based on ICA Using Kurtosis”, 2012 International Conference on Computer Science and Service System, pp. 903–905, Aug. 2012.
3. Ganesh R. Naik, Dinesh Kumar, “An overview of Independent component analysis and its application”, Informatica 35, pp.63-81, 2011. 4. Marcos Turqueti, Jafar Saniie, and Erdal Oruklu, “Real-Time Independent Component Analysis Implementation and Applications”, Real time
Conf. 17
th
IEEE NPSS, pp. 1-7, June 2010.
5. L. Hongyan and R. Guanglong , “Blind Separation of Noisy Mixed Speech Signals Based Independent Component Analysis”, 2010 First International Conference on Pervasive Computing, Signal Processing and Applications, pp. 586–589, Sep. 2010.
6. A.E. Mahmoud, Reda A. Ammar, Mohamed I. Eladawy, Medhat Hussien, “Improving the performance of the instantaneous Blind audio Source Separation algorithms”, 2009 IEEE International Symposium on Signal Processing and Information Technology (ISSPIT), pp. 519–526, Dec.2009.
7. M. K. Nath, “Independent Component Analysis of Real Data”, 2009 Seventh Int. Conf. Adv. Pattern Recognit., pp.149–152, Feb. 2009. 8. Michael Syskind Pedersen, DeLiang Wang , Jan Larsen ,and Ulrik Kjems, “Two-Microphone Separation of Speech Mixtures”, IEEE
Transactions on Neural Networks, Vol. 19, N0. 3, pp.475-492, March 2008
9. Ismail Jouny, “Improving music algorithm using BSS”, Antennas and Propagation Society International Symposium, 2007 IEEE, ,pp.5267-5270, 2007.
10. S. Makino, S. Araki, R. Mukai, and H. Sawada, “Audio source separation based on ICA”, Proceedings of the 2004 International Symposium on corcuits and systems, Vol. 5, pp.V-668-V-671, May 2004.
11. Nikolaos Mitianoudis and Michael E. Davies, “Audio Source Separation of Convolutive Mixtures”, IEEE Transactions on speech and audio processing, ,Vol.11, no.5, pp. 489-497, Sept. 2003.