Twitter Sentiment Classification Using
Supervised Lazy Learning Method
Paridhi Pravin Nigam1, Prof. Dinesh D. Patil2
P.G. Student, Department of Computer Engineering, Shri Sant Gadge Baba College of Engineering & Technology,
Near Z.T.C., Bhusawal, Maharashtra, India. 1
Associate Professor & Head, Department of Computer Engineering, Shri Sant Gadge Baba College of Engineering &
Technology, Near Z.T.C., Bhusawal , Maharashtra, India2
ABSTRACT: Twitter is a popular microblogging service where users create tweets which sometimes express opinions about different topics. Sentiment analysis of twitter data is useful for companies that want to monitor the public sentiment of their brands also for consumers who want to research the sentiment of products before purchase. Existing approaches has high complexities, less throughput and consumes more computation time for large dataset. In this paper, we will find polarity of tweets using lazy learning method- K-nearest neighbors classifier. For classification and representing text data when modeling with machine learning we use bag-of-words model here, as it is simple to understand and implement. We performed our experiments using 1.6 million tweets. In order to manage the preprocessed data we are using corpus. Our Experimental evaluations show that our proposed technique is efficient, provides maximum throughput and consumes less time as compared to previous works. We achieve accuracy of 81.1% and specificity of 84.7% of test dataset which is much better than existing approaches.
KEYWORDS: Training dataset, Test dataset, Sentiment Analysis, Preprocessing, Corpus, Bag-of-Words, k-Nearest
neighbor, Polarity.
I. INTRODUCTION
Millions of users share opinions on different aspects of life everyday on popular websites such as Twitter, instagram, Facebook. Moving by this growth, companies and media organizations are increasingly seeking ways to take away these social media for information about what people think about their companies and products. All this information can be obtained from social networks services, as their users post their opinions on many aspects of their life regularly. As sentiment analysis can be described as the process of computationally identifying and categorizing opinions expressed in a piece of text, especially in order to determine whether the writer's attitude towards a particular topic, product, etc. is positive, negative, or neutral. There has been a large amount of research in the area of sentiment classification. Thus most of focused on machine learning algorithms like Naive Bayes, Maximum Entropy, and SVM. Here in this work we present the description of the supervised machine learning system calculating polarity of particular tweet by polarity method for both training data and testing dataset. We performed our experiments using 1.6 million tweets. Thus the system takes as input a tweet message, pre-processes it, extracts features and finally classifies it as positive, negative or neutral. Also we will use K-NN classifier for finding polarity by calculating distance of actual and obtained result. We will be using corpus for managing the uncommon words by forming their Bag of Words.
II. RELATED WORK
There has been a large amount of research in the area of sentiment classification where most of it has focused on classifying larger pieces of text. Tweets do express the thinking of users researches thus offers companies an additional avenue to gather feedback. We now present some of the related work carried out. Manish. in [1] efficient twitter sentiment classification using subjective distant supervision used tweet subjectivity to select the right training samples, also they described the concept of EFWS (Effective Word Score) of a tweet that is derived from polarity scores of frequently used words in order to speed up the sentiment classification. The process they used is quite lengthy and does not use used to methods. But still the method provides high accuracy. Alec Go [2] used Naive Bayes, SVM, and MaxEnt classifiers to train their model. Long Jiang et al [6] specialize in target-dependent Twitter sentiment classification; he used state-of the-art approaches for finding and adopted the target-independent strategy, which may assign tangential sentiments to the given target. Typically it's not enough to think about solely this the other set for sentiment classification. Read [7] shows that using emoticons as labels for positive and sentiment is effective for reducing dependencies in machine learning techniques. Another significant effort in sentiment analysis on Twitter data is by Barbosa [8]. They use polarity predictions from three websites as noisy labels to train a model and use 1000 manually labelled tweets for tuning and another 1000 for testing. They present the use of syntax features of tweets like punctuation, retweet, hashtags, link, and exclamation marks in addition with features like prior polarity of words and POS of words. Ayushi Dalmia[9] put forward a model with a more involved preprocessing stage, and used features like scores from Bing Lius Opinion Lexicon, and number of positive, negative POS tags. This model achieved high accuracies considering the fact that their features were the not the conventional bag of-words, or any n-grams.
III.RESOURCES
A. Annotated Data: In order to build the system we first downloaded these training and test dataset from sentiment 140. Our training dataset1 has 1.6 million tweets and 500 tweets in the test dataset.
It contains the following 6 fields:
1. target: the polarity of the tweet (0 = negative, 2 = neutral, 4 = positive) 2. ids: The id of the tweet ( 2087)
3. date: the date of the tweet (Sat May 16 23:58:44 UTC 2009)
4. flag: The query (lyx). If there is no query, then this value is NO_QUERY. 5. user: the user that tweeted (robotickilldozr)
6. text: the text of the tweet (Lyx is cool) [11]
Thus in order to find polarity we will be needing columns target and text, rest all columns in dataset can be concealed. Tweet class labeled as 0, 2, 4 means -ve, 0, +ve was given in dataset. After detecting the blank tweets while preprocessing we get only 333 test tweets. We remove emoticons from our training and test data. [1][2]
1The URL is http://twittersentiment.appspot.com/. This page has a link to our training data and test data.
B. Common Words List: We made a list of common words those are used in daily communication. Most common words are very large collection of texts from around the world that are written in the English language. Thus these common word if exist in tweet can be filtered out while preprocessing thus reducing the complexity.
IV.METHODOLOGY
Figure 1and 2 gives a brief succinct of our system. The basic building blocks of the system include Pre-processing, Feature Extraction and Classification. In simple polarity method we find polarity of tweets ending up with polarity score, while in k-NN method includes same steps while it is used as classifier.
1. PREPROCESSING- In this step, raw data are cleaned to make learning easier. Pre-processing includes a large set of actions on the observed data. In order to reduce feature space we take advantage of unique properties of the Twitter language model. Most of the preprocessing steps are common to most of the previous works in the field.
1) Tokenization: After downloading the tweets using the tweet IDs provided in the dataset, we first tokenize them. The simple dividing of tweet into cells is done.
2) Basic steps: We first remove off the emoticons from the data. Also numbers, special symbols, underscores in between words are also stripped off as these are not needed for finding sentiment of tweet.
3) Remove URL’s: The URL’s which are present in the tweet are shortened due to the limitation on the length of the tweet text. These shortened URL’s do not carry much information regarding the sentiment of the tweet. Thus these are removed.
4) Remove common words: While forming the corpus we will cross check through common words list and for stemming, the official porter stemmer file is used in order to stabilize the words.
5) Meaningful words: In a corpus while preprocessing if we get repeated words then that word is not feeded in corpus again to follow feature reduction.
6) Repeated letters: For example, if we search “sooooon” with an arbitrary number of o’s in the middle on Twitter, there will most likely be a non-empty result set. We use preprocessing so that any letter occurring more than once in a row is replaced with one occurrence. After all the above modifications, tweets are converted into lowercase to avoid confusion between features having same content, but are different in capitalization.
2. CORPUS- Preprocessed data set can be managed well by corpus creation. After stripping off the common words in preprocessing we will get some meaningful words which can be feeded in a corpus. While forming and indexing corpus we will keep on calculating the score of how many times the words are repeated while forming corpus of dataset. After the words are feeded in panel while processing the words in corpus are arranged alphabetically so that the search becomes faster while creation of Bag of Words to training and test dataset [12].
3. Bag-of Words-A bag-of-words model, or BoW for short, is a way of extracting features from text for use in modeling, such as with machine learning algorithms. It is called a “bag” of words, because any information about the order or structure of words in the document is discarded. The model is only concerned with whether known words occur in the document, not where in the document. Hence this feature reduction strategy is used here to find out the words in corpus and their location. Here binary formation of Bag of Words is used. Thus if the word is found in corpus, then that particular index number in corpus will set to 1 in BoW and If not found then will be set to 0.
4. POLARITY METHOD- In this method we will find out polarity of training dataset. This can be done by finding out polarity of each cell word and calculating its addition for each tweet followed by corpus. The same methodology is used for test dataset, after pre processing if the word found in corpus, then polarity count will be incremented. And polarity score can be calculated as
=
Fig.1: Sentiment classification using Polarity Method Fig.2: Sentiment classification using k-NN
5. K-NN Method- We will be using K-nearest neighbor classifier for finding out distance between training BOW parameter and testing BOW parameter. Finding out tweet with minimum distance by using k-NN, then by checking the label of training dataset, if positive then define its polarity positive and vice-versa.
For calculating the distance we will use Euclidean Formulae below. After calculating distance we will find out minimum value among them.
Distance= ∑ ( − )
Where x and y are training and test dataset. And k is some positive integer. Thus by comparing this current label with training tweet , if got the same label suppose as positive then define polarity as positive else define polarity as negative if training tweet’s label is negative. Hence by calculating the average of training and test data tweets we calculate confusion matrix as in further section.
V. PERFORMANCEEVALUATION
For measuring the performance, the following terms like accuracy, specificity, error rate and miss rate measures are used to find the effectiveness of text classifier. Accuracy of classifier is the percentage of documents correctly classified by classifier.
TP (True Positive): The number of documents correctly classified to that class. TN (True Negative): The number of documents correctly rejected from that class. FP (False Positive): The number of documents incorrectly rejected from that class. FN (False Negative): The number of documents incorrectly classified to that class.
Accuracy=
Fig. 3: Confusion matrix for Polarity method Fig. 4: Confusion matrix for KNN classifier.
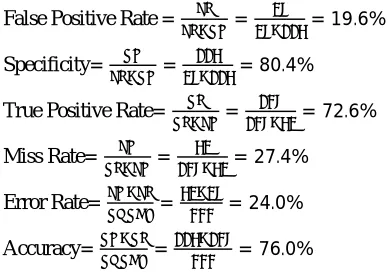
Using the same dataset we calculate the accuracy using both Polarity and k-NN classifier method. Then we will compare the results and accuracy. Hence the confusion matrix for both the methods describing results as follows. For Polarity as in figure 3 confusion matrix, the row and column are the labels of positive and negative tweets detection form database. There are 2 sets of classes and each class having different set of results. Thus the confusion matrix of polarity method shows that total 333 samples of test data set have been taken, out of which 52 tweets are wrongly detected as positive but in normal case 115 are detected correctly as negative. Also, 28 tweets are wrongly detected as negative but in normal 138 tweets are detected correctly as positive.
False Positive Rate = = = 19.6%
Specificity= = = 80.4%
True Positive Rate= = = 72.6%
Miss Rate= = = 27.4%
Error Rate= = = 24.0%
Accuracy= = = 76.0%
The confusion matrix plot indicates accuracy i.e. 76.0% for polarity method.
While for k-NN Classifier, Confusion Matrix as in figure 4 evaluates that he row and column are the labels of positive and negative tweets detection form database. There are 2 sets of classes and each class having different set of results. Here the confusion matrix of KNN classifier shows that total 333 samples of test data set have been taken, out of which 40 tweets are wrongly detected as positive but in normal case 127 tweets are detected correctly as negative. Also, 23 tweets are wrongly detected as negative but in normal 143 tweets are detected correctly as positive.
False Positive Rate = = = 15.3%
True Positive Rate= = = 78.1%
Miss Rate= = = 21.9%
Error Rate= = = 18.9%
Accuracy= = = 81.1%
The confusion matrix plot indicates accuracy i.e. 81.1% for this approach. Thus the result shows that the accuracy of k-NN classifier is very high as compared to normal polarity classifier.
VI.CONCLUSION
The performance evaluation showed that k-NN classifier performs better with the high accuracy and throughput. Previously Sentiment analysis of twitter data was never evaluated using Bag of words and k-NN classifier. As the performance is much better than existing algorithms, this system provides less working time and is efficient. This method works well on large dataset and with a much faster computation time, and hence provides the better results. This method can be further extended using emoticons for finding sentiment. Thus, Corpus-based methods can produce lists of positive and negative words with relatively high accuracy. Most of these methods need very large labeled training data to achieve their full capabilities.
VII. ACKNOWLEDGEMENT
I feel great pleasure in submitting this paper on “Twitter Sentiment Classification using supervised lazy learning method”. I wish to express true sense of gratitude towards my Principal Dr. R. P. Singh and special thanks to my guide and H.O.D., Prof. D. D. Patil who at every discrete step in preparation of this report contributed his valuable guidance and help to solve every problem that arose. Also I thank all the researchers and authors of reference papers referred by us. Also, most likely I would like to express my sincere gratitude towards my parents for always being there when I needed them the most. With all respect and gratitude, I would like to thank all the people, who have helped me directly or indirectly. I owe my all success to them.
REFERENCES
1. Tapan Sahni, Chinmay Chandak, Naveen Reddy Chedeti, Manish Singh “Efficient Twitter Sentiment Classification using Subjective Distant Supervision”, 2017 IEEE 9th International Conference on Communication Systems and Networks (COMSNETS), 548-553. 2. Alec Go, Richa Bhayani, and Lei Huang. “Twitter Sentiment Classification using Distant Supervision” CS224N Project Report, Stanford,
pages 1-12. 2009.
3. Bing Liu. Sentiment Analysis and Subjectivity. In Handbook of Natural Language Processing, Second Edition. Taylor and Francis Group, Boc. 2010.
4. https://en.wikipedia.org/wiki/Training,_test,_and_validation_sets
5. N.Saranya, Dr. R.Gunavathi “A Study on Various Classification Techniques for Sentiment Analysis on Social Networks” International Research Journal of Engineering and Technology (IRJET), pp- 1332-1337.
6. L. Jiang, M. Yu, M. Zhou, X. Liu, and T. Zhao, “Target-dependent Twitter sentiment classification”, in Proceedings of the Association for Computational Linguistics: Human Language Technologies – Vol.1, Portland, Oregon, 2011, pp. 151–160.
7. J. Read. Using emoticons to reduce dependency in machine learning techniques for sentiment classification. In Proceedings of ACL-05, 43nd Meeting of the Association for Computational Linguistics. Association for Computational Linguistics, 2005.
8. Luciano Barbosa and Junlan Feng. Robust sentiment detection on twitter from biased and noisy data. Proceedings of the 23rd International Conference on Computational Linguistics: Posters, pages 3644. 2010
9. Ayushi Dalmia, Manish Gupta*, Vasudeva Varma. Twitter Sentiment Analysis The good, the bad and the neutral! IIIT-H at SemEval, 2015.
10. Bhawna Nigam “Document Classification Using Expectation Maximization with Semi Supervised Learning” International Journal on Soft Computing ( IJSC ) Vol.2, No.4,pp- 37-44, November 2011.
11. Go, A., Bhayani, R. and Huang, L., 2009. Twitter sentiment classification using distant supervision. CS224N Project Report, Stanford, 1(2009), p.12.