ISSN(Online): 2320-9801
ISSN (Print): 2320-9798
I
nternational
J
ournal of
I
nnovative
R
esearch in
C
omputer
and
C
ommunication
E
ngineering
(An ISO 3297: 2007 Certified Organization)
Vol. 4, Issue 3, March 2016
A Unique Hybrid Automatic Clustering
Method for Dynamic Determining the Number
of Cluster and Classify the
Clusters- UHAC-SA
R.SatyaPrasad1, Marri. Suneetha2, R.Mahesh3
Department of CS & E, Acharaya Nagarjuna University, Andhra Pradesh, India
Research Scholar, Department of CSE, ANU, Andhra Pradesh, India B.Tech Student, JNTU University, Andhra Pradesh, India
ABSTRACT: Clustering is important technique in data mining. In this paper, a new UHAC-SA method has been proposed which has been extended from the original VFC-SA algorithm in four ways. The newly proposed algorithm performance has been evaluated on seven oral cancer FTIR spectra data and the results compared to clinical analysis, the standard fuzzy c-means and the original VFC-SA. The XB validity index was used as the evaluation method to measure the quality of the clusters produced. The experimental results have shown that our proposed UHAC-SA algorithm can escape the sub-optimal solutions obtained as in the other two approaches and hence produce better clusters.
KEYWORDS: UHAC-SA, VFC-SA, FTIR.
I. INTRODUCTION
In a real medical diagnostic application, for a previously unseen tissue sample, the number of different types of cells is normally not known in advance. Based on this fact, a clustering technique which can automatically obtain the appropriate number of tissue types is required. There have been many clustering methods have been developed in attempt to automatically determine the optimal number of clusters. Recently, Bandyopadhyay proposed a Variable String Length Simulated Annealing (VFC-SA) algorithm [4], which applied a simulated annealing algorithm to the fuzzy c-means clustering technique and used a cluster validity index measure as the energy function. This has the advantage that, by using simulated annealing, the algorithm can escape local optima and, therefore, may be able to find the globally optimal solution(s). The D-VC index was used as the cluster validity index to evaluate the quality of the solutions; the author stated that this is because it has been shown to be able to detect the correct number of clusters in several experiments [5]. The smallest index value corresponds to the best clustering obtained from all partitions that are generated by the clustering method. Hence this VFC-SA algorithm can generally avoid the limitations which exist in the standard fuzzy c-means algorithm. However when we implemented this proposed algorithm, it was found that sub-optimal solutions could be obtained in certain circumstances. In order to overcome this limitation, we extended the original VFC-SA algorithm to produce the A unique hybrid automatic clustering Simulated Annealing Clustering (UHAC-SA) algorithm. In this paper, the original VFC-SA and the extended UHAC-SA algorithm are described in detail. The experiments in this paper were performed on the same seven FTIR spectra datasets containing oral cancer cells in order to evaluate the performance of the VFC-SA and UHAC-SA clustering algorithms in comparison with the original fuzzy c-means algorithm. The study and description of Oral Cancer Datasets are given in [1].
II. VFC-SA CLUSTERING ALGORITHM
ISSN(Online): 2320-9801
ISSN (Print): 2320-9798
I
nternational
J
ournal of
I
nnovative
R
esearch in
C
omputer
and
C
ommunication
E
ngineering
(An ISO 3297: 2007 Certified Organization)
Vol. 4, Issue 3, March 2016
1/(1 + exp(−( − )/ ))
,
where represents the new energy and current energy respectively, and T is the current temperature.
The VDC was used to compute the evaluation of a cluster. The initial state of the VFC-SA was generated by randomly choosing c points to be cluster centers from the datasets where c is an integer within the range [ , ].
The values = 2, =√n (where n is the number of data points) was used following the suggestion proposed by Bezdek in [2]. The initial temperature T was set to a high temperature , a neighbour of the solution was produced by making one of several possible random alterations to the string describing the cluster centers (as described below) and then the energy of the new solution was calculated. The new solution was kept if it satisfied the simulated annealing acceptance requirement. This process was repeated for a certain number of iterations, k, at the given temperature. A cooling rate r, where 0 < r < 1, was used to decrease the current temperature by = . This was repeated until the T reached the termination criteria temperature , at which point the current solution was returned. The whole VFC-SA algorithm process is summarized in the steps shown below:
The process of altering the current cluster centers comprised three functions. They are: perturbing an existing centre (Perturb Centre), splitting an existing centre (Split Centre) and deleting an existing centre (Delete Centre). At each iteration, one of the three functions was randomly chosen. When splitting or deleting a centre, the cluster sizes were used to select a centre. The size, Cj , of a cluster, j , can be expressed by:
| | = ∝
, = , … … ( . )
ALGORITHM 1-VFC-SA clustering algorithm procedure.
where ‘c’ is the number of clusters. The three functions are described below. 1) Set parameters , , , , .
2) Initialised the string by randomly choosing c data points from the dataset to be cluster centres. 3) Compute the corresponding membership values using Equation (1.2)
4) Calculate the initial energy using index from Equation (1.3)
5) Set the current temperature = . 6) While T≥Tmin
6.1) For i 1to k
6.1.1) randomly alter a current centre in the string
6.1.2) Compute the corresponding membership values using Equation (1.2). 6.1.3) Compute the corresponding centres with the equation
6.1.4) Calculate the new energy En from the new string.
6.1.5) If < , then accept the new string and set it as current string. 6.1.6) Else accept the new string with a certain probability.
6.2) End for 6.3) T = rT . 7) End while.
8) Return the current string as the final solution.
a) Perturb Centre
A random centre in the string is selected. This centre position is then modified through addition of the change rate cr[d]=r*pr*v[d] where v is the current center and d = 1,..., N , where N is the number of dimensions. r is a random number between [−1, 1] and pr is the perturbation rate which was set through initial experimentation as 0.007 as this gave the best trade-off between the quality of the solutions produced and time taken to achieve them. If vcurrent [d] and
vnew [d] represent the current and new centre, respectively, then Perturb Centre can then be expressed as: vnew [d] =
vcurrent [d] + cr[d] .
b) Split Centre
ISSN(Online): 2320-9801
ISSN (Print): 2320-9798
I
nternational
J
ournal of
I
nnovative
R
esearch in
C
omputer
and
C
ommunication
E
ngineering
(An ISO 3297: 2007 Certified Organization)
Vol. 4, Issue 3, March 2016
c) Delete Centre
As opposed to Split Centre, the smallest cluster is identified and its centre deleted from the string encoding.
III. UHAC-SA CLUSTERING ALGORITHM
When the original VFC-SA algorithm was implemented on a wider set of test cases than used by the original authors [3], it was found to suffer from several difficulties. In order to overcome these difficulties, four extensions to the algorithm have been proposed. In addition, some details were not explicit in the original algorithm, so that there were ambiguities present. In this Section, the focus is placed on the extensions to VFC-SA in order to describe the proposed UHAC-SA algorithm. Also, the entire algorithm is stated explicitly in order to resolve the ambiguities.
The first extension is in the initialisation of the string. Instead of the original initialisation in which random data points were chosen as initial cluster centres, the fuzzy c-means clustering algorithm was applied using the random integer c [cmin , cmax ] as the number of clusters. The cluster centres obtained from the fuzzy c-means clustering are then utilised as the initial cluster centres for UHAC-SA. This is because using the clustering results from previous clustering results leads to a better initialization.
The second extension is in Perturb Centre. The method of choosing a centre in the VFC-SA algorithm is to randomly select a centre from the current string. However, this means that even a ‘good’ centre can be altered. In contrast, if the weakest (smallest) centre is chosen, the situation in which an already good (large) centre is destabilized is avoided. Ultimately, this can lead to a quicker and more productive search as the poorer regions of a solution can be concentrated upon.
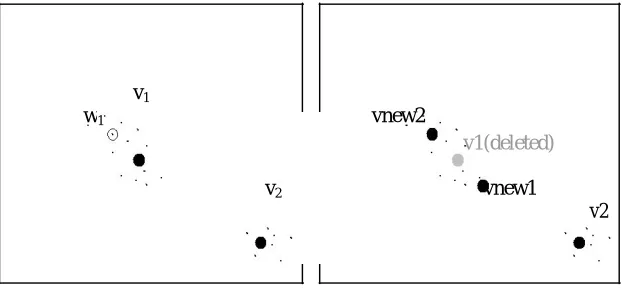
The third extension is in Split Centre. If the boundary between the biggest cluster and the other clusters is not obvious (not very marked), then the approach that original authors use is to choose a reference point with a membership degree that is less than but closest to 0.5. That is to say there are some data points whose membership degree to the chosen centre is close to 0.5. However, there is another situation that can also occur in the process of splitting centre; the biggest cluster is separate and distinct from the other clusters. For example, let there be two clusters in a set of data points which are separated, with a clear boundary between them. The corresponding cluster centres at a specific time in the search are v1 and v2, as shown in Figure 1.3 (shown in two-dimensions). The biggest cluster is chosen, say v1.
Then a data point whose membership degree is closest to but less than 0.5 can only be chosen from the data points that belong to v2 (where the data points have membership degrees less than 0.5 to v1). So, for example, the data point w1
(which closest to v1) is chosen as the reference data point. The new centres will then move to vnew1 and vnew2. Obviously these centres are far from the ideal solution. Although the new centres would be changed by the Perturb Centre
function afterwards, it will inevitably take a longer time to ‘repair’ the solutions. In the modified approach, two new centres are created within the biggest cluster. The same dataset as in Figure 1.3 is used to illustrate this process. A data point is chosen, w1, that has a cluster membership closest to the mean value of the membership degree above 0.5. Remembering that the memberships of all clusters sums to one, it is obvious that if the membership is greater than 0.5 then this must be the largest membership. Hence, points with memberships above 0.5 can be deemed to be ‘close’ to the cluster centre. The mean of memberships above 0.5 thus represents a point which is close, but nottoo close, to the cluster centre. Then two new centres vnew1 and vnew2 are createdaccording the distance between v1 and w1. This is shown in Figure 1.4. It is obvious that the new centres are better than the ones in Figure 1.3 and therefore better solutions are likely to be found in same time (number of iterations).
ALGORITHM 2 Split centre procedure:
A brief overview of the split centre procedure is as follows:
1) Calculate the size of the cluster and select the biggest cluster, whereby its cluster centre is v1.
2) Check whether there is any data point within the biggest cluster, which has membership value to v1 is lies
in between 0.4-0.5.
2.1) If there is , then apply the prutrub center to find the reference data point, as illustrated in Figure 1.3.
2.2) Else, apply the extended split centre approach to find the reference point, as illustrated in Figure 1.4.
ISSN(Online): 2320-9801
ISSN (Print): 2320-9798
I
nternational
J
ournal of
I
nnovative
R
esearch in
C
omputer
and
C
ommunication
E
ngineering
(An ISO 3297: 2007 Certified Organization)
Vol. 4, Issue 3, March 2016
throughout the whole duration of the search.
Aside from these four extensions, we also ensure that the number of clusters never violates the criteria there by the number of clusters C should be within the range of [Cmin , Cmax ] . Therefore, when splitting a centre, if the number of clusters has reached Cmax then the operation is disallowed. Dually, when deleting a centre and if the no of clusters in the current solution is Cmin then the operation is not allowed.
vnew2 v1
v1(deleted)
w
1 v2
v2
vnew1
11
0.15,
12
0.85
Figure 1.1 An illustration of Split Centre from the original algorithm with distinct clusters (where
11and
12represent the membership degree of w1 to the centers v1 and v2 respectively).
v1
vnew2 w1
v1(deleted)
v2 vnew1
v2
Figure 1.2 the new Split Centre applied to the same dataset as Figure 1.1, above, (where w1 is now the data
point that is closest to the mean value of the membership degree above 0.5).
ALGORITHM 3: UHAC-SA clustering algorithm:
Based on all the extensions and enhancements to the VFC-SA algorithm, the UHAC-SA algorithm procedure can be described in the following steps:
1) Set parameters Tmax ,Tmin , c, k, r .
2) Initialized the string by applying fuzzy c-means algorithm to generate c cluster centers from the original dataset. 3) Calculate the initial current energy Ec and best energy Eb based on the obtained cluster centers and membership
values to apply VXB index from equation (1.4).
4) Set the current temperature T = Tmax . 5) while T≥Tmin
5.1) For i < 1to k
5.1.1) randomly alter the state of a current centre in the string.
ISSN(Online): 2320-9801
ISSN (Print): 2320-9798
I
nternational
J
ournal of
I
nnovative
R
esearch in
C
omputer
and
C
ommunication
E
ngineering
(An ISO 3297: 2007 Certified Organization)
Vol. 4, Issue 3, March 2016
5.1.3) Compute the corresponding centers with the equation (1.2). 5.1.4) Calculate the new energy En from the new string.
5.1.5) If En < Ec , then accept the new string and set it as current string.
5.1.6) Else, accept the new string with a certain probability.
5.1.7) if Ec < Eb , then Eb = Ec , and set current string as the best string. 5.2) End for
5.3) T = rT . 6) End while.
7) Return the best string as the final solution.
IV. EVALUATION OF VFC−SA AND UHAC-SA CLUSTERING OF ORAL
Cancer Cells:
In order to assess the relative performance of the VFC-SA and UHAC-SA algorithms in comparison with the standard fuzzy c-means algorithm, the following experiments were conducted. The same clinical seven oral cancer datasets as used in chapter 4 were used in this investigation. The number of different types of cells in each tissue section from clinical analysis was considered as the number of clusters to be referenced. They were also used as the parameter for fuzzy c-means. The VXB
Xie-Beni index value has been utilised throughout to evaluate the quality of the classification for these three algorithms. The parameters for VFC-SA and UHAC-SA were: Tmin 10−5 , k 40 , r 0.9 . Tmax was set as 3 in all cases. That is because the maximum temperature has a direct impact on how much worse the XB index value of a solution can be accepted at the beginning. If the Tmax value is set too high, this may result in the earlier stages of the search being less productive because simulated annealing will accept almost all of the solutions and, therefore, will behave like random search. In the original VFC-SA algorithm, the initialization value for Tmax was 100, but this led to a large time being spent on random search. In the present experiments, Tmax was empirically determined to be three based on the observation that the percentage of worse solutions that were accepted was around 60%. In 1996, Rayward-Smith et al discussed starting temperatures for simulated annealing search procedures and concluded that a starting temperature that results in 60% of worse solutions being accepted yields a good balance between the usefulness of the initial search and overall search time (i.e. high enough to allow some worse solutions, but low enough to avoid conducting a random walk through the search space and wasting search time) [5].
ISSN(Online): 2320-9801
ISSN (Print): 2320-9798
I
nternational
J
ournal of
I
nnovative
R
esearch in
C
omputer
and
C
ommunication
E
ngineering
(An ISO 3297: 2007 Certified Organization)
Vol. 4, Issue 3, March 2016
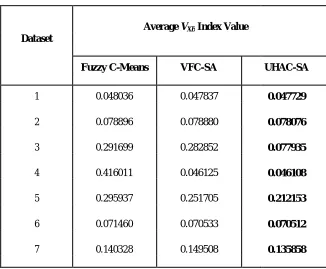
Table 1.1 Average of the VXB index values obtained when using thefuzzy c-means, VFC-SA and UHAC-SA
algorithms.
Dataset
Average VXB Index Value
Fuzzy C-Means VFC-SA UHAC-SA
1 0.048036 0.047837 0.047729
2 0.078896 0.078880 0.078076
3 0.291699 0.282852 0.077935
4 0.416011 0.046125 0.046108
5 0.295937 0.251705 0.212153
6 0.071460 0.070533 0.070512
7 0.140328 0.149508 0.135858
From Table 1.1, it can be seen that in all of these seven datasets, the average VXB values of the solutions found by UHAC-SA are smaller than both VFC-SA and fuzzy c-means. This means that the clusters obtained by UHAC-SA have, on average, better VXB index values than the other two approaches. Put another way, it may also indicate that UHAC-SA is able to escape sub-optimal solutions better than the other two methods.
In the datasets 1, 2, 4 and 6, the average of VXB index values in UHAC-SA is only slightly smaller than that obtained using VFC-SA. Nevertheless, when the Mann-Whitney test (with p<0.01) [6] was performed on the results of these two algorithms, the VXB index for UHAC-SA was found to be statistically significantly lower than that for VFC-SA for all datasets.
The number of clusters obtained by VFC-SA and UHAC-SA for each dataset is presented in Table 1.2. The brackets indicate the number of runs for which that particular cluster number was returned. For example on dataset 5, the VFC-SA algorithm found 2 clusters in 5 runs and 3 clusters in the other 5 runs. The number of clusters identified by clinical analysis is also shown for comparative purposes.
ISSN(Online): 2320-9801
ISSN (Print): 2320-9798
I
nternational
J
ournal of
I
nnovative
R
esearch in
C
omputer
and
C
ommunication
E
ngineering
(An ISO 3297: 2007 Certified Organization)
Vol. 4, Issue 3, March 2016
Table 1.2 Comparison of the number of clusters achieved by clinicalanalysis, VFC-SA and the UHAC-SA methods.
Dataset
Number of Clusters in Solution
Clinical VFC-SA UHAC-SA
1 2 2(10) 2(10) 2 2 2(10) 2(10) 3 2 2(10) 3(10) 4 3 2(10) 2(10) 5 2 2(5), 3(5) 3(10) 6 2 2(10) 2(10) 7 3 3(9), 4(1) 3(10)
It can be observed that the corresponding VXB average index values for UHAC-SA for datasets 3, 4 and 5 produced much smaller values than fuzzy c-means. These three datasets are also the datasets for which UHAC-SA obtained a different number of clusters to clinical analysis. In dataset 3, the average VXB index value in UHAC-SA is much smaller than in VFC-SA. This is because the number of clusters obtained from these two algorithms is different (see Table 1.2). Obviously a different number of clusters lead to a different cluster structure, and so there can be a big difference in the validity index. In datasets 5 and 7, the differences of VXB index values are noticeable, though not as big as dataset 3. This is because in these two datasets, some runs of VFC-SA obtained the same number of clusters as UHAC-SA.
In order to examine the results further, the data has been plotted using the first and second principal components in two dimensions. These have been extracted using the principal component analysis (PCA) technique [2,7]. The data has been plotted in this way because, although the FTIR spectra are limited to within 900 1800cm−1 , there are still 901 absorbance values corresponding to each wave number for each data. The first and second principal components are the components that have the most variance in the original data. Therefore, although the data is multidimensional, the principal components can be plotted to give an approximate visualization of the solutions that have been achieved. Figures 1.3−1.9 show the results for datasets 1-7 respectively using fuzzy c-means, VFC-SA and UHAC-SA (the data in each cluster is depicted using different markers and each cluster centre is represented by a star). The first and second principal components in datasets 1-7 contain 96.14, 96.30, 89.76, 93.57, 79.28, 94.17 and 82.64 percent of the variances in the original data, respectively. The percent of the total variability explained by the first two principal components was obtained from the third output (variances) of the function ‘princomp’ in Matlab. The formula can be expressed by:
percent = 100 × sum(first N variances) / sum(all variances) (1.2)
ISSN(Online): 2320-9801
ISSN (Print): 2320-9798
I
nternational
J
ournal of
I
nnovative
R
esearch in
C
omputer
and
C
ommunication
E
ngineering
(An ISO 3297: 2007 Certified Organization)
Vol. 4, Issue 3, March 2016
Figure 1.3 Fuzzy C-Means, VFC-SA and UHAC-SA cluster results for dataset 1.
ISSN(Online): 2320-9801
ISSN (Print): 2320-9798
I
nternational
J
ournal of
I
nnovative
R
esearch in
C
omputer
and
C
ommunication
E
ngineering
(An ISO 3297: 2007 Certified Organization)
Vol. 4, Issue 3, March 2016
(a) (b) Figure 1.5 Cluster results for dataset 3 obtained from
ISSN(Online): 2320-9801
ISSN (Print): 2320-9798
I
nternational
J
ournal of
I
nnovative
R
esearch in
C
omputer
and
C
ommunication
E
ngineering
(An ISO 3297: 2007 Certified Organization)
Vol. 4, Issue 3, March 2016
Figure 1.6 Cluster results for dataset 4 obtained from (a) Fuzzy C-Means (b) VFC-SA and UHAC-SA
(a) (b) Figure 1.7 Cluster results for dataset 5 obtained from
(a) Fuzzy C-Means and 5/10 runs from VFC-SA (b) UHAC-SA and 5/10 runs from VFC-SA. Figure 1.8 Fuzzy C-means, VFC-SA and UHAC-SA cluster results for dataset.
From the clustering results displayed in these figures, it can be seen that three of the clustering algorithms generated the same partition results in datasets 1 and 6 (as shown in Figure 1.3 to Figure 1.8 respectively). In addition, the obtained the two clusters in each dataset also matched the clinical analysis results (see legends in these two figures).
In Figure 1.3, the number of clusters obtained from VFC-SA and UHAC-SA are the same as clinical analysis results, for example two clusters. However, it can be seen that in Figure 1.3(a), the clustering output from VFC-SA and 3 out of 10 runs of UHAC-SA are the same as that from fuzzy c-means and, further, that there is one tumour data point (19) that was misclassified as stroma. Figure 1.3(b) shows the clustering results from the other 7 out of 10 runs of UHAC-SA, in which this data point was correctly categorized as tumour. This indicates that running both algorithms the same number of times; UHAC-SA has more probability to obtain the right classification.
ISSN(Online): 2320-9801
ISSN (Print): 2320-9798
I
nternational
J
ournal of
I
nnovative
R
esearch in
C
omputer
and
C
ommunication
E
ngineering
(An ISO 3297: 2007 Certified Organization)
Vol. 4, Issue 3, March 2016
SA produced a different number of clusters than clinical analysis, from this two dimensional PC space (Figure 1.4(b)), it would appear more reasonable to group this dataset into three clusters rather than two. In addition, if the clusters which have the most similar biochemical characteristics could be merged together, then the squared green cluster (points 35-37) and the diamond red cluster (points 41-44) will be merged. In this case, the accuracy of the clustering will be significantly improved. In contrast, the clustering results generated from Figure 1.4(a) cannot obtain the similar results by such a merging technique.
Cluster results for dataset 4 are presented in Figure 1.5. The clinical analysis was that there are three types of cells in this tissue section, as shown in Figure 1.5(a).Applying the fuzzy c-means algorithm using the number of clusters from clinical analysis, the clustering output obtained is also displayed in Figure 1.5(a). The early keratinisation data points were split into two clusters, the data points belong to stroma and tumour clusters were mixed up. From the data distribution in PC1 and PC2 space, it will appear to be very difficult to separate tumour and stroma data points as clinical study described (although, of course, the clinical partition might become more apparent if further dimensions were to be considered). Figure 1.5(b) shows the two clusters obtained from VFC-SA and UHAC-SA, which appears more representational of the existing data structure, although the data points belong to stroma and tumour were still joined together. This is also why both algorithms produced different number of clusters from clinical analysis.
Figure 1.6 displays the clustering algorithms applied on dataset 5, in which two types of tissue samples were achieved from clinical study (as shown in Figure 1.6(a)). This figure also shows the clustering results from fuzzy c-means and 5 out of 10 runs of the VFC-SA algorithm. Although the number of clusters obtained from some runs of VFC-SA is the same as clinical analysis, from Figure 1.6(a) it can be seen that some data points which belong to the tumour cluster were misclassified as stroma, for instance, points 115, 125, 126 and 130. On the other hand, although UHAC-SA and the rest of the 5 runs of VFC-SA algorithms produced a different Figure1.6 (b), if a technique can merge clusters with the most similar biochemical characteristic clusters, then in this case, all the data points belong to tumour will be combined, and so the same clustering results as clinical study would be obtained.
Finally, Figure 1.7 presents the results obtained on dataset 7 for the fuzzy c-means, VFC-SA and UHAC-SA algorithms. Figure 1.7 (a) shows that in 9 out of 10 runs of VFC-SA algorithm and all 10 runs of UHAC-SA algorithm the same number of clusters as clinical analysis were obtained. However, three data points were misclassified (points 235, 204 and 208). All these three points should belong to the tumour cluster, but in this case, data point 235 was marked as necrotic and data points 204, 208 were marked as stroma. Nevertheless, apart from these three points, the rest of the data points were correctly categorised. Figure 1.7(b) shows the clustering result from 1 out 10 runs of the VFC-SA algorithm in which four clusters were obtained. This is due to the fact that the data points that should belong to tumour and stroma clusters were split into three groups with the third cluster being on the border between the tumour and stroma clusters. Although this occurred quite rarely (only in 1 out of 10 runs), it does indicate the variety of clusters obtained from the VFC-SA clustering algorithm.
From Figure 1.3 − 1.8, it can be seen that although in some datasets, such as dataset 3 and 5, the VFC-SA algorithm (and some runs of the VFC-SA algorithm) obtained the same number of clusters as clinical analysis, while the UHAC-SA algorithm did not. This does not necessarily mean that the clustering accuracy of VFC-SA on these datasets is better than UHAC-SA’s. Rather, it is just that the clustering results from UHAC-SA appear more reasonable through visual inspection. In addition, if a technique which can merge the most similar biochemical characteristic clusters could be developed and then be applied to the partition results from UHAC-SA, the accuracy of clustering results will be significantly improved. In the clustering results from dataset 2 (Figure 1.4), both VFC-SA and UHAC-SA algorithms achieved the same number of clusters as clinical analysis. However, when these two algorithms were run ten times, UHAC-SA is more likely to achieve the same results as clinical study. In dataset 4, both VFC-SA and UHAC-SA algorithms obtained a different number of clusters from clinical analysis. Nevertheless, two well separated clusters can be seen when displaying this dataset in the first two PCs dimensional space. Thus, it is hard to see how any technique might end up with three clusters (to match clinical analysis) for this particular dataset.
ISSN(Online): 2320-9801
ISSN (Print): 2320-9798
I
nternational
J
ournal of
I
nnovative
R
esearch in
C
omputer
and
C
ommunication
E
ngineering
(An ISO 3297: 2007 Certified Organization)
Vol. 4, Issue 3, March 2016
practice. A third possibility is that the FTIR spectroscopic data has not extracted the required information necessary in order to permit a correct determination of cluster numbers –i.e. there is a methodological problem with the technique itself. None of these explanations of the difference between the clustering results obtained automatically and those from clinical analysis detract from the fact that the UHAC-SA produces better solutions than VFC-SA in that it consistently finds better (statistically lower) values of the objective function (VXB index).
V. CONCLUSION
A new UHAC-SA method has been implemented and extended from the original VFC-SA algorithm in four ways. The newly proposed algorithm performance has been evaluated on seven oral cancer FTIR spectra data and compared to clinical analysis, the standard fuzzy c-means and the original VFC-SA. The XB validity index as the evolution method for generating quality of clusters. The experimental results have shown that the UHAC-SA algorithm can escape the sub-optimal solutions obtained in the other two approaches and hence produce better clusters. On the other hand, the numbers of clusters obtained by UHAC-SA in some datasets are not in agreement with those provided through clinical analysis. [This can be visualized by plotting the clustering results into the first two dimensions of PC space]. ----to be verified. For different number of cluster datasets, UHAC-SA results appear to more reasonably reflect the structure of the underlying data. In addition, this also can be explained in following three ways. Firstly, the number of clusters identified from clinical analysis may not be correct; secondly, the XB validity index as may not be suitable to apply on these clinical data; and thirdly, the FTIR technique has not (for these datasets) captured sufficient information to facilitate correct classification. However, more results and information are needed before the conclusion can be made in this case. Nevertheless, this UHAC-SA algorithm is a further step towards the automatic classification of data for real medical application.
REFERENCES
[1]R. Satya Prasad, Marri. Suneetha, R. Mahesh , A Novel Methods of Investigation on Bio-Medical Cancer Tissues using Advanced Clustering Techniques, International Journal of Computer Applications (0975 – 8887) Volume 129 – No.12, November2015.
[2] Bezdek, J., 1998, Pattern Recognition in Handbook of Fuzzy Computation, IOP Publishing Ltd. Boston, NY. [3] Jolliffe, I.T., 1986, Principal Component Analysis, Springer-Verlag. New York.
[4] Bandyopadhyay, S., 2003, "Simulated Annealing for Fuzzy Clustering: Variable Representation, Evolution of the Number of Clusters and remote Sensing Applications", unpublished, private communication.
[5] Pal, N. R. and Bezdek, J., 1995, "On Cluster Validity for the Fuzzy C-Means Model", IEEE Trans.Fuzzy System., vol. 3, pp. 370-379. [6] Rayward-Smith, V.J., Osman, I.H., Reeves, C.R., and Smith, G.D., 1996, Modern Heuristic Search Methods, John Wiley & Sons. [7] Conover, W.J., 1999, Practical Nonparametric Statistics, John Wiley & Sons.