Automatic Date Fruit Recognition from
Natural Images Using Random Forest
Algorithm and SVM
A.Chitra1, Mr.C.Augustine M.E.,2
P.G. Student, Department of ECE, GRT Institute of Engineering and Technology, Tiruvallur, Tamil Nadu, India 1
Assistant Professor, Department of ECE, GRT Institute of Engineering and Technology, Tiruvallur, Tamil Nadu, India 2
ABSTRACT: Depending on the type of the date fruit, dates have many features that should help in recognizing and classifying a date. The main features of the date fruit are the color, texture and the shape of date fruit. This article thus analyzes image based date fruit classification and recognition. In this regards, this paper has two contributions, firstly, as there is no standard dataset available, a dataset of 9 date’s classes is constructed. This dataset presents an interesting challenge for computer vision algorithms. Secondly, Gabor features and Color Layout features are used. These features are then fused to increase the classification performance. The proposed approach takes into account different types of fruits. The main goal is to come up with a method for classifying these different types of fruits accurately and efficiently. Images are preprocessed in order to separate the fruit in the foreground from the background. Texture features from Gray-level Co-occurrence Matrix (GLCM) and statistical color features are extracted from the segmented image. Two types of features are combined in a single feature descriptor. A Support Vector Machine (SVM) classification model is trained using these feature descriptors extracted from the training dataset. Once trained, the model can be used to predict the category for an unlabeled image from the validation set. The proposed approach also works best for embedded systems and single board computers as it realizes the trade-offs of these devices.
KEYWORDS: Age detection , DCNN , State of art
I. INTRODUCTION
low-accordingly. Thevarious classifiers include Probabilistic Neural Network(PNN), Support Vector Machine (SVM), and BackPropagation Network (BPN), K-Nearest Neighbour (KNN)algorithm, K-Mean classifier, Naive Bayes Classifier,Linear Discriminant classifier and others
II. RELATEDWORK
Development of an electronic-nose system for fruit maturity and quality monitoring - Li-Ying Chen ; De-Ming Wong ; Chen-Yu Fang ; Chen-I Chiu ; Ting-I Chou ; Cheng-Chun Wu ; Shih-Wen Chiu ; Kea-Tiong Tang
Potential application of a metal oxide semiconductor based electronic nose (E-Nose) as a non-destructive system for monitoring the change in volatile organic production of fruit during the maturing process. Using PCA analysis, it was possible to distinguish and to classify the different stages. The result showed that this method yielded highest average accuracies greater than 90% in classifying fruit maturity.
Application of fuzzy logic in recognition of tomato fruit maturity in smart farming - Joan Baez U. Dimatira ; Elmer P. Dadios ; Francisco Culibrina ; Jo-Ann Magsumbol ; John Dela Cruz ; Kristine Sumage ; Mary Tamar Tan ; Mike Gomez
The tomato crop (Solanumlycopersicum L.) is of great importance in the world. It is useful not just for the livelihood it provides for farmers, but also for its health benefits. Tomato is also rich in vitamin C and lycopene. Lycopene can lower the risk of breast and prostate cancer, osteoporosis and it can also cure male infertility. With the help of Smart Farming technology, the production of tomato fruit in season or not is made possible. This study deals more of the appearance of the fruit because it is the most important characteristic because it defines the product's commercialization value. The tomato's good appearance as well as its good quality will only be met if it reaches its maturity. Tomato maturity is closely relevant to its surface color, so evaluating the tomato's level of maturity by visual recognition is a feasible mean
Fruit maturity estimation based on fuzzy classification-RijaHasan ; Syed Muhammad G Monir
In this paper an efficient approach of fruit maturity classification based on apparent color of the specimen is implemented by the aid of fuzzy inference system (FIS). Heuristically acquired hue and its corresponding saturation and lightness are the attributes of choice, which are utilized to classify the sample into three classes; Raw, Ripe, and Overripe. The membership functions and fuzzy rules required by the Mamdani FIS are estimated by the approach of classification tree. The experimentation is performed upon 200 guava samples. The fuzzy system is trained upon 60% of the dataset, yielding 93.4% classification accuracy.
III.PROPOSEDALGORITHM
The methodology or algorithm that involves in this schemeinvolves the following steps:
1. Fruit Feature Matrix has been declared and initialized toZero.
2. Hausdroff fractal dimension has been calculated from thefiltered image passing through the log Gabor filter. Thisfeature is considered as Texture property of the image.
3. The fruit area has been identified and the mean hue of thatarea is calculated. This is considered as color Feature.
4. Perimeter and area have been calculated to find Shapeattribute..
5. The values of the three attributes have been stored in theFeature Matrix.
6. Steps 2 to 6 have been repeated for all sample fruits.
7. The Fruit Class Matrix has been created.
Feature Extraction
classifying fungal symptoms. So, we have considered both color and texture features for recognition and classification purpose. Image texture, defined as a function of the spatial variation in pixel intensities (gray values). The use of color features in the visible light spectrum provided additional image characteristic features over traditional gray-scale representation. CCM is a method in which both color and texture features are taken into account to arrive at unique features which represent that image. The CCM method involved three major steps. First, transformations of an RGB (Red, Green, Blue) color representation of an image to an equivalent HSI (Hue, Saturation, Intensity) color representation. Once this process is completed Color Co-occurrence Matrices from the HSI pixels is generated. Lastly, texture features from the CCM matrices are generated [8 & 9]. Input RGB image is converted to the HSV image. Each pixel map is used to generate a Color Co-occurrence Matrix, resulting in three CCM matrices, one for each of the H, S and I pixel maps. The Color Co-occurrence texture analysis method was developed through the use of spatial gray level dependence matrices (SGDM’s). The Gray Level Co-occurrence Method (GLCM) is a statistical way to describe shape by statistically sampling the way certain grey-levels occur in relation to other grey-levels[10]. The GLCM is based on the repeated occurrence of some gray-level configuration in the texture. This method measures occurrence of gray levels between a specific position P (i, j) in the image and a neighboring pixel, according to a given distance d and
direction θ.
Support Vector Machine
Support Vector Machine performs classification by constructing an N-dimensional hyper plane that optimally separates the data into different parts. SVM models are closely related to neural networks. SVM evaluates more relevant information in a convenient way. As with any supervised learning model, we first train a support vector machine, and then cross validate the classifier. We used the trained machine to classify (predict) new data.
IV.RESULTSANDDISCUSSIONS
The overall classification accuracy with the 8 features and their combinationsusing GLCM on the dataset of different dates class. The first eight rowspertain to the individual features, row 9 to the best two features, row 10 to the best fourfeatures, row 11 to the best six features and row 12 to all the features. It is observed thatthe top four features are sufficient for providing an accuracy of 95.24%.
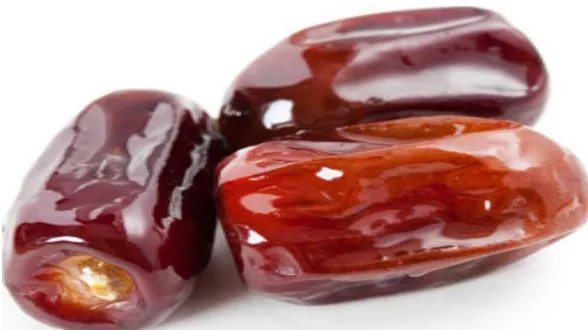
Figure 4.1 is an Original Image obtained from DATES which is an RGB image.
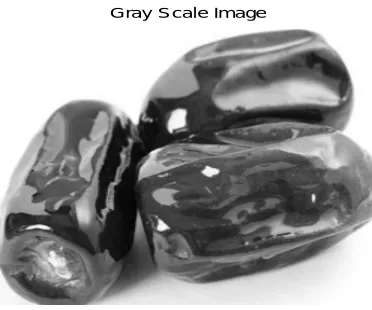
Fig 4.2 shows an gray scale image. The original RGB image is converted to black and white image (Gray scale image). I=rgb2gray(RGB) which converts the color image RGB to grayscale intensity image I by eliminating the hue and saturation information while retaining the luminance. Gray levels represent the interval number of quantization in gray scale image processing. At present, the most commonly used storage method is 8-bit storage. There are 256 gray levels in an 8 bit gray scale image, and the intensity of each pixel can have from 0 to 255, with 0 being black and 255 being white.
Fig 4.3 shows a High pass filter image. A high-pass filter can be used to make an image appear sharper. These filters emphasize fine details in the image – exactly the opposite of the low-pass filter. High-pass filtering works in exactly the same way as low-pass filtering; it just uses a different convolution kernel. In the example below, notice the minus signs for the adjacent pixels. If there is no change in intensity, nothing happens. But if one pixel is brighter than its immediate neighbors, it gets boosted.
High Pass Filter Image
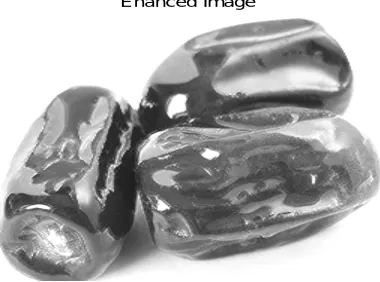
Fig 4.4 shows a Enhanced image. Image enhancement is the process of adjusting digital images so that the results are more suitable for display or further image analysis.
Ehanced Image
Level 1 Morphological operator Level 1 Morphological operator
Level 2 Morphological operator Level 2 Morphological operator
Morphological image processing is a collection of non-linear operations related to the shape or morphology of features in an image. Morphology is a broad set of image processing operations that process images based on shapes. Morphological operations apply a structuring element to an input image, creating an output image of the same size. In a morphological operation, the value of each pixel in the output image is based on a comparison of the corresponding pixel in the input image with its neighbors. By choosing the size and shape of the neighborhood, you can construct a morphological operation that is sensitive to specific shapes in the input image.
The most basic morphological operations are dilation and erosion. Dilation adds pixels to the boundaries of objects in an image, while erosion removes pixels on object boundaries. The number of pixels added or removed from the objects in an image depends on the size and shape of the structuring element used to process the image. In the morphological dilation and erosion operations, the state of any given pixel in the output image is determined by applying a rule to the corresponding pixel and its neighbors in the input image. The rule used to process the pixels defines the operation as a dilation or an erosion. This table lists the rules for both dilation and erosion.
Image thresholding is a simple, yet effective, way of partitioning an image into a foreground and background. This image analysis technique is a type of image segmentation that isolates objects by converting grayscale images into binary images. Image thresholding is most effective in images with high levels of contrast.
Clustering can be considered the most important unsupervised learning problem; so, as every other problem of this kind, it deals with finding a structure in a collection of unlabeled data
V. CONCLUSIONANDFUTUREWORK
A system for automatically classifying animal footprints by first classifying them by means of the connected components algorithm, and then using morphological features to further classify them into a correct species of animal was created. 3 Distance formulas and a combination of all three formulas were used to make classifications. The algorithm boasted a 97% final accuracy rate and a perfect 100% accuracy rate for initial classification. The age of the animal is also predicted.
REFERENCES
1. Rachmawati, E., Khodra, M.L., Supriana, I.: Histogram based color pattern identification ofmulticlass fruit using feature selection. In: 5th International Conference on ElectricalEngineering and Informatics (ICEEI), pp. 43–48. IEEE (2015)
2. Roomi, S.M.M., Priya, R.J., Bhumesh, S., Monisha, P.: Classification of mangoes by objectfeatures and contour modeling. In: International Conference on Machine Vision and ImageProcessing (MVIP), pp. 165–168. IEEE (2012)
3. Seng, W.C., Mirisaee, S.H.: A new method for fruits recognition system. In: InternationalConference on Electrical Engineering and Informatics (ICEEI), vol. 1, pp. 130–134. IEEE(2009)
4. Zawbaa, H.M., Hazman, M., Abbass, M., Hassanien, A.E.: Automatic fruit classificationusing random forest algorithm. In: 14th International Conference on Hybrid IntelligentSystems (HIS), pp. 164–168. IEEE (2014)
5. Naskar, S., Bhattacharya, T.: A fruit recognition technique using multiple features andartificial neural network. Int. J. Comput. Appl. 116(20), 23–28 (2015) 6. Al-falluji, R.A.A.: Color, shape and texture based fruit recognition system. Int. J. Adv. Res.Comput. Eng. Technol. 5(7), 2108–2112 (2016)
7. Kuang, H.L., Chan, L.L.H., Yan, H.: Multi-class fruit detection based on multiple colorchannels. In: International Conference on Wavelet Analysis and Pattern Recognition(ICWAPR), pp. 1–7. IEEE (2015)
8. Wang, X., Huang, W., Jin, C., Hu, M., Ren, F.: Fruit recognition based on multi-feature andmulti-decision. In: 3rd International Conference on Cloud Computing and IntelligenceSystems (CCIS), pp. 113–117. IEEE (2014)
9. Dubey, S.R., Jalal, A.S.: Robust approach for fruit and vegetable classification. Procedia Eng.38, 3449–3453 (2012)
10. Ninawe, P., Pandey, S.: A completion on fruit recognition system using k-nearest neighborsalgorithm. Int. J. Adv. Res. Comput. Eng. Technol. 3(7), 2352–2356 (2014) 11. Haidar, A., Dong, H., Mavridis, N.: Image-based date fruit classification. In: 4th InternationalCongress on Ultra Modern Telecommunications and Control Systems and Workshops(ICUMT), pp. 357–363. IEEE (2012)
12. Jana, S., Parekh, R.: Intra-class recognition of fruits using color and texture features withneural classifiers. Int. J. Comput. Appl. 148(11), 1–6 (2016) 13. Otsu, N.: A threshold selection method from gray-level histograms. IEEE Trans. Syst. ManCybern.9(1), 62–66 (1979). IEEE
14. Computers and Optics in Food Inspection. http://www.cofilab.com/portfolio. Accessed 15Dec 2016