_____________________________________________________________________________________________________
*Corresponding author: E-mail: [email protected];
Correlation between Retinal Nerve Fiber Layer
Thickness and Cup-to- Disc Ratio in Glaucoma
Suspects Using Optical Coherence Tomography at
University of Port Harcourt Teaching Hospital,
Port Harcourt, Rivers State, Nigeria
Chidi Gift Nwokocha
1*, C. N. Pedro-Egbe
2, A. O. Adio
2and R. D. Komolafe
11
Department of Ophthalmology, Braithwaite Memorial Specialist Hospital, Port Harcourt, Nigeria. 2
Department of Ophthalmology, University of Port Harcourt Teaching Hospital, Port Harcourt, Nigeria.
Authors’ contributions
This work was carried out in collaboration between all authors. Author CGN designed the study, performed the statistical analysis and wrote the protocol, author CNPE wrote the first draft of the manuscript, author AOA managed the analyses of the study and author RDK managed the literature searches. All authors read and approved the final manuscript.
Article Information
DOI: 10.9734/BJMMR/2017/32918 Editor(s): (1) Barbara Giambene, Eye Clinic, Department of Translational Surgery and Medicine, University of Firenze, Italy. Reviewers: (1)Asaad Ahmed Ghanem, Mansoura University, Egypt. (2)Italo Giuffre', Catholic University of Rome, Roma, Italy. (3)Lampros Lamprogiannis, Aristotle University of Thessaloniki, Greece. Complete Peer review History:http://www.sciencedomain.org/review-history/19100
Received 23rd March 2017 Accepted 20th April 2017 Published 17th May 2017
ABSTRACT
Aim: To determine the correlation between retinal nerve fiber layer thickness and vertical cup disc
ratio in glaucoma suspects in the University of Port Harcourt teaching hospital, Port Harcourt, Nigeria.
Study Design: Hospital-based observational study conducted between October 2nd, 2012 and January 31st 2013.
Methodology: Participants were selected using consecutive allocation of glaucoma suspects as
they presented to the glaucoma clinic. Observations were done using the Optical Coherence Tomography machine. Data was analyzed using the statistical package EPI info version 6.04d.
Results: One hundred and twenty participants (n =120) comprising 60 males (50%) and 60
females (50%) with a mean age of 42.8±13.79 were examined; The age range was 19 to 75 years. The average retinal nerve fiber layer was 132.254 µm in the inferior quadrant, 127.504 µm in the superior quadrant, 80.533 µm in nasal quadrant and 61.500 µm in temporal quadrant. Vertical cup disc ratio increased with decreasing RNFL thickness (p<0.05; r = - 0.21). Disc size was noticed to increase with increasing VCDR (p= 0.001).
Conclusion: There was no strong correlation between vertical cup disc ratio and retinal nerve fiber
layer thickness among the glaucoma suspects. There was a weak positive correlation between the optic disc diameter and the retinal nerve fiber layer thickness of the subjects.
Keywords: Retinal nerve fiber layer; glaucoma suspects.
1. INTRODUCTION
Glaucoma is described as a group of diseases that have in common a characteristic optic neuropathy with associated visual function loss. Although elevated intraocular pressure (IOP) is one of the primary risk factors, its presence or absence does not have a role in the definition of the disease. [1]
The prevalence of all glaucoma (open angle and angle closure) varies slightly worldwide. Coffey et al. [2] reported a prevalence of 2.4% among Europeans in Roscommon West Ireland, which is almost similar to that reported by Quigley et al. [3] in Hispanics of United States (2.1%) and Ramakrishnan et al. [4] in southern India (2.6%). A higher prevalence (3.7%) was however reported among the Chinese in Tanjong Pagar Singapore [5] which is probably due to the high prevalence of angle closure glaucoma among the Chinese [6]. The highest prevalence (4.2%) was reported in Africa [7] and this is likely due to the high prevalence of primary open angle glaucoma (POAG) among blacks [7-9]
Available data suggests that age specific glaucoma prevalence in population surveys in Nigeria is about 6.5% in people over 40 years [10], given that 20% of the over 150 million population are 40 years and older [11], it then implies that there are approximately 2 million people over 40 years with glaucoma in Nigeria. Of these, 1.8 million (90%) individuals are undiagnosed and there is considerable visual dysfunction at time of diagnosis. [10] Published works in Nigeria show that glaucoma is the second commonest cause of blindness being responsible for between 16.7% and 43.3% of cases of blindness.[12,13] Glaucoma studies done in Rivers State revealed a prevalence of 7.95% [14] and blindness from glaucoma accounted for 20.8% [15] of blindness in the region.
A glaucoma suspect is defined as an adult who has one of the following findings in at least one eye: an optic nerve or nerve fiber layer defect suggestive of glaucoma (enlarged cup–disc ratio, asymmetric cup–disc ratio, notching or narrowing of the neuro-retinal rim, a disc hemorrhage, or suspicious alteration in the nerve fiber layer), a visual field abnormality consistent with glaucoma and an elevated IOP greater than 21 mm Hg [16]. Usually, if two or more of these findings are present, the diagnosis of POAG is supported, especially in the presence of other risk factors such as age, a family history of glaucoma and the black race. The diagnosis of a glaucoma suspect is also dependent on a normal open angle on gonioscopy. [16] Some authors have however classified glaucoma suspects into open angle and closure suspects. The angle-closure suspects were based on the following criteria [17]: Posterior trabecular meshwork not visible 180 degrees [18], pigmented trabecular meshwork not visible 270 degrees without indentation [19] or posterior trabecular meshwork not visible 180 degrees and IOP 22 mmHg or higher [20].
The World Health Organization (WHO) recommended that the public health problem of glaucoma could be tackled through a program approach and therefore, it was important to have data on the prevalence, distribution and risk factors to developing glaucoma to be able to reduce morbidity from the disease; [22] unfortunately many studies have been done on glaucoma globally but very few on glaucoma suspects [23,24].
There is thus a need to further evaluate glaucoma suspects to ascertain those who actually have the disease, monitor closely those with a tendency to progress to glaucoma and commence treatment when necessary to avoid progression to blindness. It is also necessary to rule out those without glaucoma and save them from the psychological, emotional and financial burden of being labeled a glaucoma patient [25].
2. MATERIALS AND METHODS
Hospital-based observational study using consecutive allocation of glaucoma suspects as they presented to the Glaucoma Clinic, University of Port Harcourt Teaching Hospital (UPTH) between October 2nd, 2012 and January 31st, 2013.
2.1 Inclusion Criteria
1. Glaucoma suspects aged 18 years and above presenting at the ophthalmology clinic, UPTH.
2. Glaucoma suspects with open angles on gonioscopy (grades III and IV Shaffers’ grading system)
3. Glaucoma suspects consenting to the study.
4. Glaucoma suspects with normal central visual field.
5. Glaucoma suspects with signal strength above 5 on optical coherence tomography testing.
2.2 Exclusion Criteria
1. Glaucoma suspects below the age of 18 years.
2. Glaucoma suspects not consenting to the study
3. Glaucoma suspects with occludable and closed angles on gonioscopy.( I, II,slit and 0 of Shaffers’s grading system)
4. Glaucoma suspects with inability to maintain fixation on the OCT machine
5. Glaucoma suspects with abnormal central visual field.
6. Glaucoma suspects with signal strength less than 6 on optical coherence tomography testing
2.3 Study Procedure
The participants were referred to the Glaucoma Clinic from the General Ophthalmology Clinic on account of suspicious discs or elevated IOP after treatments for other ocular conditions.
Each participant recruited was informed of the purpose of the study and gave a written consent to participate. The participant’s pupils were then dilated using tropicamide 1% and phenylephrine 2.5% after intra-ocular pressure measurement by applanation tonometry. A slit lamp binocular indirect ophthalmoscopy using +78D (Volks) lens was used to examine the optic nerve head and retinal nerve fiber layer. Participants with superficial splinter hemorrhage, focal loss of neuro-retinal rim (notching), generalized loss of neuro-retinal rim (VCDR ≥0.5), cup-disc ratio asymmetry (≥ 0.2) or loss of retinal nerve fibers were allowed to proceed with the study. Also included were participants whose optic nerve head and nerve fibers appeared normal but had IOP greater than 21 mmHg.
Automated static visual-field examination was done using 24-2 Swedish Interactive Thresholding Algorithm standard visual-field examination (Humphery visual-field analyzer, model 750). Participants with normal fields were then dilated for the OCT testing using tropicamide 1% and phenylephrine 2.5%. Each participant was seated in front of the equipment with his or her chin on the chin rest.
pigment epithelial cell layer. Retinal nerve fiber layer (RNFL) of each eye was imaged using fast-RNFL-thickness 3.4 scanning protocol, which automatically records three circular scans of diameter 3.4 mm around the center of the optic disc for 256 points along the scanning circle. Mean RNFL thickness in micrometers along the whole circle circumference, four quadrants, twelve clock hours, and at 256 A-scan lengths were obtained. The sectors were defined in degrees, wherein 0° was temporal horizontal point and the 360° measurements along the circle were clockwise in right eye and anti-clockwise in left eye. Superior quadrant was from 45° to 135°, nasal from 135° to 225°, inferior from 225° to 315°, and temporal quadrant was from 315° to 45°. Twelve 30° sectors were also defined in clockwise order for right eye and in counterclockwise order for the left eye: 1-superior-nasal, 2-nasal-superior, 3-nasal, 4-nasal-inferior, 5-inferior-nasal, 6-inferior, 7-inferior-temporal, 8-temporal-inferior, 9-temporal, 10-temporal-superior, 11-superior-temporal, and 12-superior.
2.4 Ethical Consideration
Approval to carry out this study was sought and gotten from the Ethical Committee of the University of Port Harcourt Teaching Hospital, Port Harcourt and the Faculty of Ophthalmology, National Postgraduate Medical College of Nigeria
2.5 Statistical Methods and Data Analysis
The data were analyzed using the statistical package EPI info version 6.04d,a software
package designed by the Centers For Disease Control and Prevention(CDC) USA in 2001.
Frequency was presented in percentages. Means and standard deviation were calculated for descriptive and comparative purposes. For comparison between the two groups, all data were subjected to student t-test and p-value. The correlation between RNFL thickness and disc parameters were analyzed using the Pearson’s correlation coefficient. The level of significance was set at p < 0.05
3. RESULTS
A total of 240 eyes of 120 participants were examined in this study.
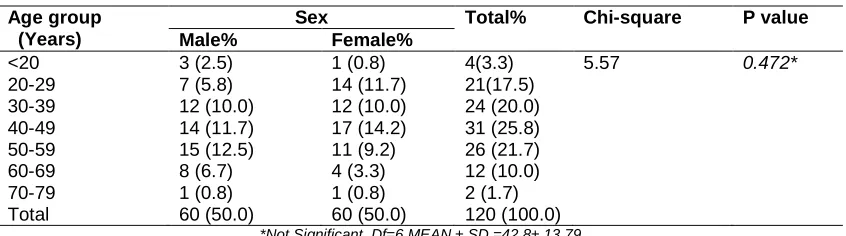
There were 60 (50%) males and 60 (50%) females giving a male to female ratio of 1:1 (Table 1). The ages ranged from 19 years to 75 years with a mean of 42.8 ± 13.79. The age group 40-49 years had the highest representation (25.8%; n = 31/120) while those aged 70-79 years constituted the least (1.7%; n = 2/120). There was no statistically significant difference in sex and gender representation (p>0.05).
Table 2 shows the distribution of the RNFL in all quadrants with the inferior quadrant having the thickest RNFL followed by the superior then the nasal with the temporal quadrant having the thinnest RNFL. This follows the ‘I S N T’ rule and was statistically significant with p < 0.05.
Table 1. Age and sex distributions of study subjects
Age group (Years)
Sex Total% Chi-square P value Male% Female%
<20 3 (2.5) 1 (0.8) 4(3.3) 5.57 0.472*
20-29 7 (5.8) 14 (11.7) 21(17.5)
30-39 12 (10.0) 12 (10.0) 24 (20.0)
40-49 14 (11.7) 17 (14.2) 31 (25.8)
50-59 15 (12.5) 11 (9.2) 26 (21.7)
60-69 8 (6.7) 4 (3.3) 12 (10.0)
70-79 1 (0.8) 1 (0.8) 2 (1.7)
Total 60 (50.0) 60 (50.0) 120 (100.0)
*Not Significant. Df=6 MEAN ± SD =42.8± 13.79
Table 2. RNFL Thickness in the different quadrants
RNFL Mean thickness (µm) SD t-test p-value
Inferior quadrant 132.254 ±24.772 23.9 0.001
Superior quadrant 127.504 ±26.455
Nasal quadrant 80.533 ±21.247
In Table 3, the RNFL thickness increased with increasing disc size from the medium sized discs to the very large discs. This can be generalized in this study since 97.1% (n = 233/240) of eyes fall between medium and very large discs. There is a statistical significance in this distribution with a p- value = 0.02 (p<0.05).
In Table 4, 90.4% (n = 217/240) of the eyes had VCDR greater than 0.5, while 9.6% (n = 23/240) of the eyes had VCDR of 0.5 or less. It also shows that the VCDR of 0.51-0.6 range has the thickest average RNFL while the VCDR of 0.81-0.9 range had the thinnest RNFL. There is a general decrease of RNFL with increasing VCDR especially among eyes with VCDR greater than 0.5 which forms the bulk of the eyes tested (90.4%). This is also reflected in the different quadrants of the RNFL (inferior, superior, nasal and temporal). This was statistically significant in all but the temporal quadrant (p= 0.12)
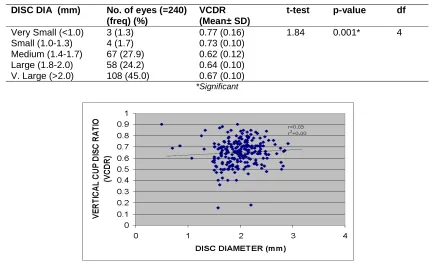
In Table 5, the mean VCDR is higher at the extremes of disc sizes. The highest VCDR
(0.77±0.12) was found among the very small discs followed by the very large discs (0.67±0.10).The lowest VCDR (0.62±0.12) was found among the medium sized discs. VCDR is noticed to increase with increasing disc diameter (medium = 0.62, large =0.64, very large = 0.67) with a p- value of 0.001, this is statistically significant.
Table 6 shows a very weak positive correlation between disc diameter and RNFL thickness in all the quadrants.
Table 7 shows a very weak negative correlation between VCDR and the different quadrants of the RNFL
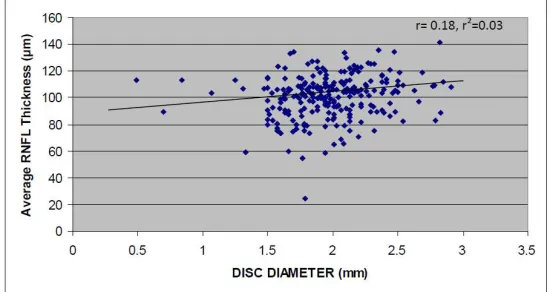
Fig. 1 shows that disc diameter increases as the average retinal nerve fiber layer thickness increases though very weak.
Fig. 2 shows that VCDR increases, as the average retinal nerve fiber layer thickness decreases. This though is a poor correlation.
Fig. 1. Scatter plot graph of disc diameter and average RNFL thickness
6
Table 3. Relationship between optic disc size (vertical diameter) and RNFL thickness
DISC diameter (mm) No. of eyes
(=240) (freq) (%)
Average RNFL Thickness (Mean± SD)
Inferior quadrant fibers
(Mean± SD)
Superior quadrant fibers
(Mean± SD)
Nasal quadrant fibers
(Mean± SD)
Temporal quadrant fibers (Mean± SD)
Very small(<1.1) 3 (01.3) 105.03 (13.79) 132.00 (27.07) 135.33 (15.31) 102.33 (8.14) 50.33 (17.61)
Small(1.1-1.3) 4 (01.7) 95.62 (24.86) 118.00 (33.30) 113.50 (41.15) 56.00 (28.93) 88.75 (62.04)
Medium (1.4-1.7) 67 (27.9) 94.98 (18.09) 125.06 (27.61) 119.63 (27.21) 76.61 (20.77) 56.54 (15.12) Large (1.8-2.0) 58 (24.2) 102.49 (13.22) 133.60 (22.54) 128.12 (27.27) 83.38 (17.46) 61.48 (13.19) Very large (>2.0) 108 (45.0) 103.01(15.61) 136.43 (23.01) 132.35 (24.33) 81.61 (22.51) 63.98 (15.67)
Total 240 (100.0)
t-test 1.74 1.62 1.68 1.77 2.29
P-value 0.02* 0.04* 0.03* 0.02* 0.001*
Df 4 4 4 4 4
Table 4. Relationship between vertical cup disc ratio (VCDR) and RNFL thickness
VCDR No. of eyes
(=240) (freq) (%)
Average RNFL Thickness (Mean± SD)
Inferior quadrant fibers
(Mean± SD)
Superior quadrant fibers
(Mean± SD)
Nasal quadrant fibers
(Mean± SD)
Temporal quadrant fibers
(Mean± SD)
0.1-0.3 2 (0.8) 90.80(19.65) 102.50 (4.95) 89.00 (05.65) 127.50 (106.77) 44.00 (18.39)
0.31-0.4 4 (1.7) 101.18 (17.56) 133.75 (29.34) 128.25 (19.26) 79.00 (12.46) 63.00 (12.75)
0.41-0.5 17 (7.1) 103.32 (12.59) 136.47 (19.68) 132.06 (28.47) 84.12 (17.15) 62.88 (18.60)
0.51-0.6 57 (23.8) 106.48 (16.59) 139.71 (26.46) 136.65 (28.65) 83.49 (18.01) 63.49 (14.37)
0.61-0.7 89 (37.1) 101.63 (12.59) 133.65 (19.69) 126.83 (24.19) 81.23 (19.26) 63.23 (19.05)
0.71-0.8 55 (22.9) 96.63 (16.10) 127.64 (24.77) 124.33 (24.19) 77.15 (19.26) 59.64 (14.95)
0.81-0.9 16 (6.7) 85.19 (22.81) 112.63 (35.23) 109.38 (32.33) 68.50 (23.53) 51.56 (16.77)
Total 240 (100.0)
t-test 2.22 1.9 1.88 1.78 1.31
P-value 0.001* 0.001* 0.002* 0.001* 0.118
Table 5. Relationship between disc size and VCDR
DISC DIA (mm) No. of eyes (=240) (freq) (%)
VCDR (Mean± SD)
t-test p-value df
Very Small (<1.0) 3 (1.3) 0.77 (0.16) 1.84 0.001* 4 Small (1.0-1.3) 4 (1.7) 0.73 (0.10)
Medium (1.4-1.7) 67 (27.9) 0.62 (0.12) Large (1.8-2.0) 58 (24.2) 0.64 (0.10) V. Large (>2.0) 108 (45.0) 0.67 (0.10)
*Significant
Fig. 3. Scatter plot graph of disc diameter and VCDR
Fig. 3 above shows no significant correlation between disc diameter and VCDR.
Table 6. Correlation between disc diameter and RNFL thickness in the quadrants
RNFL thickness In the
quadrants
Disc diameter (mm) Pearson
correlation coefficient, r
r2
I FIBRES 0.21 0.04
S FIBRES 0.18 0.03
N FIBRES 0.07 0.00
T FIBRES 0.12 0.02
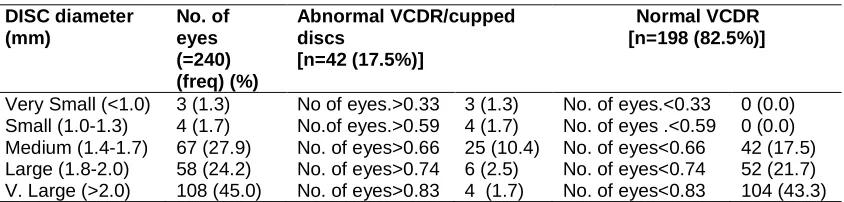
Table 8 shows that all the very small and small discs are cupped 3% (n = 7/240); 14.6% (n = 35/240) of the medium to very large are also cupped. The remaining 82.5% (n = 198/240) are normal.
4. DISCUSSION
The early diagnosis of glaucoma is a critical step in the management of the disease. If treated early, the prognosis for vision is excellent. One of the first structures to be damaged in glaucoma is the retinal nerve fiber layer (RNFL); therefore the
ability to quantify changes in RNFL thickness early in the course of glaucoma is one of the features that make OCT appealing as a diagnostic tool for glaucoma.
Table 7. Correlation between VCDR and RNFL thickness in the quadrants
RNFL thickness In the quadrants
VCDR Pearson correlation coefficient, r
r2
I FIBRES -0.15 0.02
S FIBRES -0.12 0.02
N FIBRES -0.19 0.04
T FIBRES -0.09 0.01
Table 8. Relationship between disc size and cupping
DISC diameter (mm)
No. of eyes (=240) (freq) (%)
Abnormal VCDR/cupped discs
[n=42 (17.5%)]
Normal VCDR [n=198 (82.5%)]
Very Small (<1.0) 3 (1.3) No of eyes.>0.33 3 (1.3) No. of eyes.<0.33 0 (0.0) Small (1.0-1.3) 4 (1.7) No.of eyes.>0.59 4 (1.7) No. of eyes .<0.59 0 (0.0) Medium (1.4-1.7) 67 (27.9) No. of eyes>0.66 25 (10.4) No. of eyes<0.66 42 (17.5) Large (1.8-2.0) 58 (24.2) No. of eyes>0.74 6 (2.5) No. of eyes<0.74 52 (21.7) V. Large (>2.0) 108 (45.0) No. of eyes>0.83 4 (1.7) No. of eyes<0.83 104 (43.3)
previous histological studies showing that the optic nerve fiber count increases with enlarging optic nerve head size. [26] Although these studies analyzed the retrobulbar portion of the optic nerve, it may be extrapolated that a similar correlation also exists in the peripapillary RNFL. Additional evidence is provided by the positive correlation found by Savini et al. [27] in Italy, where a positive correlation was noted between RNFL thickness and optic disc size. Their study found no correlation with the nasal fibers.
From a clinical point of view, it is important to observe that if larger discs really do contain more retinal ganglion cell axons they may benefit from a higher anatomic reserve capacity in progressive optic neuropathies. On the other hand, we may consider our findings in a different light and interpret them as an artifact of the OCT methodology, owing to the fact that the circular scan has a fixed diameter of 3.4 mm, as suggested by previous studies. [28] It is likely that the positive correlation between the disc diameter and RNFL thickness depends on the distance between the OCT circular scan and the disc margin. RNFL thickness, in fact, has been shown to decrease at increasing distances from the disc margin. [29] If a fixed-diameter circular scan is employed, the distance between the scan and the disc margin will obviously be reduced in the presence of a large disc diameter. Such an artifact may lead to an overestimation of RNFL thickness in patients with large disc which may be the case in this study where 97% of the subjects had disc diameters greater than 1.4 mm. Kaushik et al. [30] in their work in India revealed that in normal subjects, disc size does not appear to affect RNFL measurements by OCT using the fixed-diameter protocol (p = 0.92) but was inversely proportional to disc size using the proportional protocol thus indicating that RNFL thickness may be related to distance from the center of the optic disc rather than the margin, but in glaucoma suspects, the optic-disc
area correlated with RNFL thickness using the fixed-diameter protocol. These findings therefore suggest that the findings on glaucoma suspects in this study are not as a result of artifact and are thus reliable. Racette et al. [31] reported larger optic discs and thicker RNFL measurements in healthy eyes of black individuals compared with Caucasians. They rationalized that if a large and small disc had the same number of nerve fibers, the large disc would provide more space for the fibers at the disc margin and so would in fact have thinner RNFL measurements at the disc margin than the smaller disc. At any fixed distance from the center of the optic disc, mean RNFL-thickness measurements would be the same for optic discs containing the same number of fibers, regardless of the disc size. They hypothesized that the thicker RNFL found in larger discs of African–Americans was due to a higher number of nerve fibers rather than a measurement artifact. If more studies confirm this hypothesis it will then imply that glaucoma patients with large discs would have more RNFL reserve than those with smaller discs.
risk factor in the diagnosis of primary open angle glaucoma.
5. CONCLUSION
There was no strong correlation between vertical cup disc ratio and retinal nerve fibre layer thickness among the glaucoma suspects. There was however a weak positive correlation between the optic disc diameter and the retinal nerve fibre layer thickness of the study subjects in our environment.
CONSENT
As per international standard or university standard, patient’s written consent has been collected and preserved by the authors.
ETHICAL APPROVAL
As per international standard or university standard, written approval of Ethics committee has been collected and preserved by the authors.
COMPETING INTERESTS
Authors have declared no competing interests exist.
REFERENCES
1. George ACF, Jane D, Girkin CA, Gross RL, Peter A, John RS. Introduction to glaucoma: Terminology, epidemiology, and heredity: Basic and clinical science course, section 10, chapter 1 American Academy of Ophthalmology, Singapore. 2011;3-7.
2. Coffey M, Reidy A, Wormald R. Prevalence of glaucoma in the west of Ireland. Br J Ophthalmol. 1993;77:17-21. 3. Quigley HA, West SK, Rodriguez J. The
prevalence of glaucoma in a population-based study of Hispanic subjects: Proyecto VER. Arch Ophthalmol. 2001;11:1819-1826.
4. Ramakrishnan R, Nirmalan PK, Krishnadas R. Glaucoma in a rural population of southern India: The Aravind comprehensive eye survey. Ophthalmology. 2003;110:1484-1490. 5. Foster PJ, Oen FT, Machin D. The
prevalence of glaucoma in Chinese residents of Singapore: A cross-sectional
population survey of the Tanjong Pagar district. Arch Ophthalmol. 2000;118:1105-1111.
6. Quigley HA, Broman AT. The number of persons with glaucoma worldwide in 2010 and 2020 Br J Ophthalmol. 2006;90:262-267.
7. Buhrmann RR, Quigley HA, Barron Y. Prevalence of glaucoma in a rural East African population. Invest Ophthalmol Vis Sci. 2000;41:40-48.
8. Tielsch JM, Sommer A, Katz J, Royall RM, Quigley HA, Javitt J. Racial variations in the prevalence of primary open-angle glaucoma. The Baltimore Eye Survey. Jama. 1991;266:369-374.
9. Leske MC, Connell AM, Schachat AP, Hyman L. The barbados eye study. Prevalence of open angle glaucoma. Arch Ophthalmol 1994;112:821-829.
10. Adeyinka Ashaye: Glaucoma-Global Facts :in: Glaucoma Blindness facts, fancies and fables, Annual Faculty Lecture; Ibadan; Book builders ,July; 2010.6-7.
11. National Population Commission; 2012. Available:http://www.population.gov.ng/ (Accessed on June 16, 2012)
12. Rabiu MM, Kyari F, Ezelum C, Elhassan E, Sanda S, Murthy VS, Sivasubramaniam S, et al. Review of the publications of the Nigeria national blindness survey: Methodology, Prevalence, Causes of Blindness and Visual Impairment and Outcome of Cataract Surgery Ann Afr Med. 2012:11:(3):125-130.
13. Awoyesuku EA, Ejimadu CS. Visual disability in newly diagnosed Primary open Angle Glaucoma (POAG) patients in a tertiary Hospital in Nigeria. Nigerian Journal of Medicine. 2012;20(1):12-16. 14. Pedro-Egbe CN, Chukwuka IO. Subjective
optic disc assessment and single measurement intraocular pressure to screen a cohort of pensioners in Port Harcourt. Nigerian Journal of Ophthalmology. 2010;18:62-65.
15. Pedro-Egbe CN. Blindness and visual impairment in the Niger-Delta: A study of Ahoada East LGA of Rivers State Nigeria. P Med J. 2006;1(1):56-61.
17. Yanoff M, Duker JS: Epidemiology of Glaucoma: In: Ophthalmology, 3rd ed. Spain; Mosby 2008; Part 10, section 1, chapter 10.1; 2008.
18. Alward WL, Bender TR, Demske JA, Hall DB: High prevalence of myopia among young adult Yupik Eskimos. Can J Ophthalmol. 1985;20:241-245.
19. Foster PJ, Baasanhu J, Alsbirk PH: Glaucoma in Mongolia. A population-based survey in Hovsgol province, northern Mongolia. Arch Ophthalmol. 1996;114:1235-1241.
20. Alsbirk PH. Primary angle-closure glaucoma. Oculometry, epidemiology and genetics in a high risk population. Acta Ophthalmol Suppl. 1976;127:5-31.
21. Yanoff M, Duker JS: Clinical examination of Glaucoma: In: Ophthalmology, 3rd ed. Spain; Mosby 2008; Part 10, section 2,chapter 10.4; 2008.
22. Thylefors B, Negrel AD. The global impact of glaucoma. Bull World Health Organ. 1994;72:323-326.
23. Bourne RRA, Sukudom P, Foster PJ, Tantisevi V, Jitapunkul S, Lee PS, et al. Prevalence of glaucoma in Thailand: A population based survey in Rom Klao District, Bangkok. Br J Ophthalmol. 2003;87:1069-1074.
24. Sah RP, Badhu BP, Pokharel PK, Thakur SKD, Das H, Panda A. Prevalence of glaucoma in Sunsari district of Eastern Nepal. KUM J. 2007;5:343-348.
25. Cost-effective evaluation of the glaucoma suspect. Curr Opin Ophthalmol. 2007; 18(2):97-103.
26. Jonas JB, Schmidt AM, Muller-Bergh JA, Human optic nerve fiber count and optic disc size. Invest Ophthalmol Vis Sci. 1992;33:2012–2018.
27. Savini G, Zanini M, Carelli V, Correlation between retinal nerve fibre layer thickness and optic nerve head size: An optical coherence tomography study. Br J Ophthalmol. 2005;89:489–492.
28. Schuman JS, Pedut-Kloizman T, Hertzmark E. Reproducibility of nerve fiber layer thickness measurements using optical coherence tomography. Ophthalmology. 1996;103:1889–1898. 29. Jonas JB, Gusek GC, Naumann GO: Optic
disc, cup and neuroretinal rim size, configuration and correlations in normal eyes. Invest Ophthalmol Vis Sci. 1988;29:1151–1158.
30. Kaushik S, Pandav SS, Ichhpujani P, Gupta A. Fixed-diameter scan protocol preferable for retinal nerve fiber layer measurement by optical coherence tomography in all sizes of optic discs; Br J Ophthalmol. 2009;93:895-900.
31. Racette L, Boden C, Kleinhandler S, Differences in visual function and optic nerve structure between healthy eyes of blacks and whites. Arch Ophthalmol 2005;123:1547–1553.
32. Teal PK, Morin JD, McCulloch C. Assessment of the normal disc. Trans Am Ophthalmol Soc. 1972;70:164–177. 33. Bujak MC. Yan DB. Correlation between
cup–to–disc ratio asymmetry and optic disc size in glaucoma suspects and open angle glaucoma. Invest Ophthalmol Vis Sci. 2004;45:5543.
_________________________________________________________________________________ © 2017 Nwokocha et al.; This is an Open Access article distributed under the terms of the Creative Commons Attribution License (http://creativecommons.org/licenses/by/4.0), which permits unrestricted use, distribution, and reproduction in any medium, provided the original work is properly cited.
Peer-review history: