113 - CSPBRBER
Revised January 2002
Class size, pupil attentiveness and peer relations
Peter Blatchford*, Suzanne Edmonds** and Clare Martin*
*Institute of Education, University of London **National Foundation for Educational Research, Slough
ABSTRACT
Background
Despite a long-running debate over the effects of class size differences on educational
performance there is little evidence on the classroom processes that might be involved.
Aims
The effects of class size differences are examined in relation to social and behavioural
adjustment to school, in terms of two dimensions: attentiveness and peer relations. It was
predicted that as class size increased there would be more inattentiveness in class and more signs
of social difficulties between children in the form of more rejection, asocial, anxious and
aggressive behaviour, and less prosocial behaviour.
Samples
Data came from a large-scale longitudinal study of children over KS1 (4-7 years). The
observation study was based on a sub-sample of 235 children in 21 small (average 19 children)
and 18 large (average 33 children) reception classes (aged 5 years). The PBR sample involved
over 5000.
Methods
There were two complementary methods of data collection: first, a systematic observation study
children and when not interacting – and in terms of work, procedural, social and off task
activities; and, second, a teacher administered Pupil Behaviour Rating (PBR) scale comprising
over 50 items rated on a three point scale grouped into six ‘factors’: hyperactive/distractible,
aggressive, anxious/fearful, pro-social, asocial, and excluded.
Results
Observations showed that children in large classes were more likely to show off task
behaviour of all kinds, and more likely to interact with their peers in terms off task behaviour,
social, and also on task behaviours. Connections between class size and PBR factors were not
strong, but there was a slight though consistent tendency for worse peer relations, in terms of
aggression, asocial and excluded, in the smallest classes.
Conclusions
There was confirmation that children in large classes are more distracted from work and more
often off task. The unexpected result, based on teacher ratings, that small classes may lead to
less social and more aggressive relations between children is discussed, along with
INTRODUCTION
The effect of class size differences on young pupils in school can be considered conceptually in
relation to two main aspects of adjustment to school. First, and most obviously, adjustment can
be seen in terms of academic progress. The acrimonious debate over the educational
consequences of class size differences has centred on the effectiveness of class size reduction
initiatives in improving children’s academic performance (Grissmer, 1999). The most widely
quoted research is the experimental Tennessee STAR project which found that smaller classes,
at least below 20, and for the youngest children in school, have positive effects on pupil
academic performance (e.g. Finn & Achilles, 1999, Nye, Hedges & Konstantopoulos, 2000). In
the UK, current Government policy is for a maximum class size of 30 at Key Stage 1 (4-7 years),
but this still leaves a good deal of variability in class sizes, and concerns over the effects of
larger classes remain.
However, adjustment to school can be seen in a second way, in terms of social and behavioural
adjustment. Though there are some suggestions of classroom processes connected to class size
differences, research evidence is patchy (Blatchford & Martin, 1998), and there is little
understanding of classroom processes, including social and behavioural factors, that might be
involved (Grissmer, 1999). It might be expected that in larger classes there will be more
distractions and, with more children bidding for the teacher's attention, they will be more likely
expectations are tested systematically.
The importance of a child's early social and academic adjustment to school has been recognised
in Britain for some time. Research was conducted at the end of the 1970s on factors influencing
successful transition into infant and first school (e.g. Cleave et al, 1982) and nursery school
(Blatchford et al, 1982). But a number of factors have led to a renewed interest. Recent
initiatives in the U.K. regarding school entry assessments has encouraged interest in more
precisely assessing children's adjustment to school, soon after entry. Schools in England enter
children in the year within which they are five, and some of these children are only just four
years old on entry. There are concerns about the appropriateness of existing teaching methods,
class sizes and staffing. Concerns with behaviour and indiscipline in schools have also
heightened awareness of problems posed by some young children in school. There appear to be
signs that difficult behaviour in schools is increasing. Day, Tolley, Hadfield, Parking, & Watling
(1996) review research linking class size with pupil behaviour and argue that large class sizes are
at odds with a wish to improve behaviour in schools and help management of problem
behaviour.
One theme of several studies is that in smaller classes behaviour is better and classroom
management of behaviour is easier (Cahen et al in Cooper 1989, Carter in Cooper, 1989, Filby in
Klein 1981). Pate-Bain, Achilles, Boyd-Zaharias & McKenna (1992) report, on the basis of
diary records of teachers involved in the pre-STAR research, that there were fewer student
interruptions, and potential discipline problems were identified and solved more quickly.
larger classes adversely affect behaviour in class. Glass, Cahen, Smith & Filby (1982) found in
their meta-analysis that there were fewer misbehaviours in smaller classes.
In this paper social and behavioural adjustment in relation to class size is considered in terms of
two dimensions: attentiveness in class and peer relations. Results come from a large-scale
longitudinal study of class size differences, based at the Institute of Education, University of
London.
1. Attentiveness in class
Regardless of any connection with class size, many studies show that a key aspect related to
educational achievement is attentiveness, active learning time, time on task or some equivalent
term (e.g. Creemers, 1994, Rowe, 1995). It seems clear that pupils will learn to the extent that
they are attentive to the topics being discussed or the work presented to them, and common
sense would suggest that with more children in the class there will be more potential for
distraction, and more possibility of being off task. Cooper (1989), in his review of evidence,
found several studies which showed that pupils in smaller classes attend more and spend more
time on task (Cahen in Cooper 1989, Carter, 1984 in Cooper 1989, Klein 1985). Finn &
Achilles (1999) have argued that the benefits of small classes are primarily in terms of increased
student engagement in learning. But this conclusion is based on a follow up at grade 4 of the
STAR sample (i.e., after the experimental intervention had ended). They admit that further
research is needed on the connection between class size and student engagement. It might also
be noted that Shapson et al (1980), in a systematic observation study, did not find that pupils in
There is a need to clarify constructs used to measure class size effects on attentiveness. If large
classes cause children to be more distracted this could take two forms: first, an externalising
form in the sense of overtly disruptive behaviours and ‘mucking about’, or, second, a more
internalising form in the sense of being disengaged and distracted from work. These two forms
of behaviour are recognised as distinct in studies of behavioural difficulties where 'externalising'
behaviours, for example, conduct problems, hyperactive and distractible behaviour, are
distinguished from 'internalising' behaviours, such as those of an anxious-fearful nature. There is
a good deal of evidence, extending over several decades, that pupils' externalising behaviour
problems, in the form of disruptive and maladjustment problems, are connected to low
achievement (see Rowe, 1995). As measured by Ladd & Profilet (undated),
distractible/hyperactive behaviours are externalising forms of behaviour that conceptually
overlap with lack of concentration and inattentiveness in class. It was hypothesised that as class
size increased distractible and inattentive behaviour would also increase.
There is a more subtle distinction that might need to be made in terms of distractible behaviour
and aggression. Many researchers have found close links between aggression and
hyperactive/distractible behaviours. Some have combined these in one factor, as externalising
behaviours or conduct disorders. St James-Roberts, Singh, Lynn & Jackson (1994), along with
others, combine aggressive behaviour and conduct disorder in one factor, but McGuire &
Richman (1986), on the basis of a pre-school sample, found some distinction between these two
dimensions, and others have also separated them. Although it is likely that the two forms of
behaviours should be considered as distinct. In this study these two components are measured
separately in relation to class size.
2. Peer relations
There is little systematic research on the effects of class size differences on peer relations, though
there are suggestions that large class sizes, or large pupil:staff ratios, can adversely affect the
quality of relationships between very young children. Research on children at nursery level
indicates that less favourable pupil:staff ratios can lead to more negative relations between
children, including more aggression, annoying and teasing (Smith, McMillan, Kennedy &
Ratcliffe, 1989). Smith & Connolly (1980) found that there were higher levels of aggression
when there is more overcrowding in pre-school settings. But other research with older pupils
seems less clear. And Shapson et al (1980), in a study of grade 4 and 5 children, found no
difference between different sized classes in conflicts between pupils.
In considering the effects of class size on relations between children it is important to take
note of the extensive literature on peer relations, stemming from developmental social
psychology. While there is not space to review this work here (see Rubin, Bukowski, &
Parker, 1998) there is a lot of evidence that children's early social behaviour toward peers is
an important predictor of later social and personal adjustment (Parker & Asher, 1987). The
effects of children's prosocial, withdrawn and aggressive behaviours toward peers have
received most empirical support.
to relate to the development of friendships (see review in Ladd & Profilet, no date). In one study,
it was reported that children in smaller classes were more appreciative of each other and showed
an increased desire to assist one another (Pate-Bain et al, 1992). In the present study, it was
hypothesised that as class size decreased there would be more signs of pro-social behaviours
between peers.
In the case of withdrawn behaviours, it is important to be clear about allied but distinct
behaviours. Although withdrawn behaviour is often taken as a single dimension, on conceptual
grounds different facets need to be distinguished. Rubin & Asendorpf (1993, in Ladd & Profilet,
no date) have distinguished three forms: first, there are children who prefer to play alone, and
can be called 'asocial'; second, children who are rejected or excluded by other children; and,
third, children who are wary or fearful of other children. Each of these types of withdrawn
behaviour may have different origins and different relationships with later functioning.
Withdrawn behaviour might be expected to be made worse by larger classes, and it may be more
difficult for teachers in larger classes to keep an eye on, and seek to draw out, children who are
withdrawn, let alone find the time to distinguish between different forms of withdrawn
behaviour. On the basis of the work just described we distinguished between three forms of
withdrawn behaviour and hypothesised that as class size increased asocial, excluded/rejected and
anxious/fearful behaviours would also increase.
There is also considerable support for the importance of aggression as a factor in predicting later
the best predictors of later maladjustment, including peer rejection, delinquency, criminality,
mental illness, underachievement and dropping out of school (Parker & Asher, 1987, Coie &
Dodge, 1998). As described above it may be important to separate aggression from
distractibility. One reason for this is that in school contexts aggression, but not necessarily
distractibility, is usually reflected in relations with other children.
In addition to the literature on peer relations, there is also a separate and large literature on
collaborative or co-operative group work in classrooms. Again there is not space to review this
here (see review in Slavin, Harley & Chamberlaine, 2000). Naturalistic studies of children's
interactions in classrooms, show that much learning in classrooms takes place in groups with
other children, though many have commented that the extent of collaborative group work is
limited (e.g. Galton, Simon & Croll, 1980, Tizard et al, 1988). In this study, we wanted to
examine the extent to which class size differences affected peer interactive work-related
behaviours. It might be expected that in larger classes teachers would be less able to monitor and
control behaviour and that along with other distractions, children will engage in more social and
off task behaviours with each other. In larger classes, teachers may more easily miss squabbles
between children.
The various concepts concerning children's behaviour and social relations in class are therefore
complex. Measures of classroom behaviour, peer relations, and school adjustment overlap with
each other and need to be conceptualised and measured carefully so that similar but different
behaviours are treated separately. There is recognition that the most widely used scales need
non-peer related items have sometimes been lumped together. Although general measures of
adjustment to school have been developed (Thompson, 1975), we felt that conceptualisation of
adjustment to school needed to take account of recent research on children's social and
behavioural difficulties and research on social relationships, described above. One aim of this
study, therefore, was to develop a conceptualisation of, and a means of measuring, social and
behavioural functioning in classrooms, including peer relations, likely to be affected by size of
class.
Aims of the study
On the basis of a review of the literature the following aspects of social and behavioural
classroom behaviour were investigated in relation to size of class:
1. pupil inattentiveness
2. relations between children in terms of:
a. asocial
b. excluded
c. anxious/fearful
d. aggressive behaviour
e. pro-social behaviour
In line with research reviewed above, the strongest prediction was that there would be a tendency
as class size increased for children to show more signs of being inattentive and off task. We also
predicted that there would be more signs of social difficulties between children as class size
signs of anxious behaviour, and more aggressive behaviour, though previous research does not
allow firm predictions about this.
Research approach
Previous research is limited in two main ways. One problem is the diversity of research methods
used. Different research studies use different research approaches, e.g. teacher report and
interviews, teacher accounts of time spent, and observation studies. These focus on different
aspects and integration of findings then becomes difficult. Also, methods used in studies are not
always clearly described or adequate. Much is relatively anecdotal and based on open-ended
reported experience of individual teachers. Though valuable, there are questions about the
validity and generalisability of such views, especially given Shapson et al’s (1980) finding of
discrepancies between teacher reports and classroom observation data. It seemed to us that an
advance in understanding connections between class size and teaching would be to use a
multi-method approach which, in this paper, would combine use of carefully designed teacher ratings
of child behaviour (rather than open ended reports) and systematic classroom observations. The
systematic observation data provided for each child frequencies task and non-task related
behaviours directed at teachers, other children and when not interacting, while the teacher ratings
provided qualitative judgments of selected aspects of peer relations. The two forms of data
collection were designed to cover allied but different aspects of attentiveness and peer relations
in school.
Another feature of the research approach used in this study concerns the overall research
(Blatchford, Goldstein & Mortimore, 1998, Goldstein & Blatchford, 1998), and have identified
limitations which make interpretation of relationships between class size and outcomes
problematic. It is often assumed that experimental designs, and randomised controlled trials
(RCTs) more specifically, are superior, and necessary to provide the basis for causal
interpretations. However, RCTs can themselves be questioned (Goldstein & Blatchford, 1998).
The overall strategy in the Class Size Project has been to employ a longitudinal research design,
random selection of participating schools, and a systematic approach to capturing information on
classroom processes affected by class size. A naturalistic design can be more useful in
addressing policy issues in that it is more 'authentic', and reflects adjustments and processes as
they occur under normal circumstances. The study had two aims, overall: to examine
connections between: a) size of class and pupils’ progress, and b) size of class and classroom
processes, such as teacher and pupil behaviour, within class grouping practices, teacher self
perceptions, assessment and record keeping. In this paper we focus on connections between size
of class and pupil attentiveness and peer relations. In other papers we look at class size and
within class grouping practices (Blatchford, Baines, Kutnick & Martin, 2001); class size and
teaching (Blatchford, Moriarty, Edmonds & Martin, in press), class size and teacher's
professional self perceptions (Moriarty et al, 2001), and class size and academic progress over
the reception year (Blatchford, Goldstein, Martin & Browne, in press).
METHOD
Sample: schools, classes and children
reception classes during 1996/7, and a second separate cohort of pupils who entered reception
classes one year later during 1997/8. At the start of the project there were, in Cohort 1, 7142
pupils in 330 classes in 199 schools in 9 Local Education Authorities (LEAs). The second
cohort comprised 4244 pupils in 212 classes, in 134 schools in 6 LEAs. The children were
followed for the whole of KS 1, that is, through the three years: reception, Y1 and Y2. The
research design involved a random selection of schools within the participating LEAs. All
children entering reception in a selected school during the year were included in the study. At
the start of the study 49% of the sample were female and 51% male, 17% were eligible for
free school meals (a measure of low family income), the vast majority (97%) spoke English
as a first language, and most (91%) were classified as from White UK ethnic backgrounds.
Schools were either all through primary schools (i.e., children aged 4 – 11 years) – 74% - or
Infant schools (i.e., children aged 4 – 7 years) – 26%.
There were a number of forms of data collected in the study, including start of school and end of
year pupil academic assessments, termly teacher completed questionnaires, teacher and
headteacher completed end of year questionnaires, Pupil Behaviour Ratings on each child in the
study, and systematic observations and case studies conducted on sub samples of the main
sample. For this paper we have made use of two types of data: systematic observations in
classrooms and teacher completed Pupil Behaviour Ratings. Data on school entry attainments
and eligibility for free school meals are also presented.
Systematic classroom observations
of school was of particular interest, the observation component reported in this paper involved a
sub-sample of reception classes from Cohort 1. Three of the participating LEAs were
approached and agreed to take part in the observation component. Schools were selected on the
basis of information already provided on class sizes. Classes with small (20 or under) and large
(30 and over) reception classes were identified and a random selection of schools with such
classes approached to see if they were willing to take part. The aim was to get forty classes,
divided between large and small classes. In the event 39 classes in 27 schools with the required
characteristics agreed to take part. There were 18 large and 21 small classes. Those identified as
small classes had on average 19.4 children and those identified as large classes had 32.5 children
on the register, according to the observer notes at the time of the observations. For each class,
observers were provided with the names of six children – three boys and three girls - randomly
chosen by the researchers, along with two reserves to be observed in cases where the sample
children were absent. In the event there were observations on 235 children (one class had
observations on 7 children).
A systematic observation schedule developed in previous research (Blatchford, Burke, Farquhar,
Plewis & Tizard, 1987, Tizard, Blatchford, Burke, Farquhar & Plewis, 1988) was used. This
involved direct, i.e. on-the-spot, observations of selected children in terms of previously
developed categories and in terms of 5-minute observation sheets divided into continuous
10-second time samples. The schedule was child-based in the sense that one child at a time was
observed, the ‘target’ child. The aim was to provide a description of the child’s behaviour;
teachers and other children were observed only when they came into contact with the target
of time spent in three 'social modes' - when with their teachers, other children and when not
interacting. Within each of these three 'modes' sub-categories covered work, procedural, social
and off task activity. A list of categories in the schedule is shown in Appendix 1. In this paper
we concentrate on the child-child categories and total off-task behaviour. Teacher child
interactions are described in Blatchford, Moriarty, Edmonds and Martin, 2002). A ‘predominant
activity sampling’ method was used (the most prevalent category within a sub-set of categories
was coded) and observers recorded behaviours by ticks on observation forms (see Blatchford et
al, 1987 for more details).
The basic principle was to observe during classroom-based work activities, i.e. those parts of the
day when language, maths, other work like craft and painting, and free play in the classroom
could have taken place. The aim was to observe the 6 children in each class 5 times per day, for
three days. In the event the average number of completed observation sheets per child was 14,
and there were 3,238 sheets overall. This amounted to 97,140 10-second observations overall
(30 per sheet), and there were on average 413 of these observations per child (this number fell a
little short of the theoretical maximum – 450 – because of missing data, observer error and codes
not being readable). In terms of time there were 69 minutes of observation per child, which
amounted to 270 hours for the whole sample. Observations were conducted over a period of a
few weeks at the same time during the Spring term. Observations within classes were as far as
possible on consecutive days, though this was not sometimes possible because of events in
schools, that kept children out of class, e.g., rehearsals in the hall, and child absences requiring
Observers were recently retired senior teachers and headteachers, contacted through participating
LEAs, who then received initial training, practice observations in a reception class not involved
in the study, and then a follow-up training session. Reliability checks were carried out through
the training sessions. A reliability study carried out in earlier work showed that observer
agreement for the main sets of mutually exclusive categories was high. Teacher-child ‘social
setting’, ‘child role’, ‘teacher content’, child to teacher ‘child contribution’, ‘child content’ and’
not interacting’ all had reliability coefficients (kappa) greater than 0.80. Kappa for child-child
content was 0.77 (see Blatchford et al, 1987, Blatchford in preparation for more details).
Pupil Behaviour Ratings (PBR)
Existing behaviour schedules (e.g., Edelbrock & Achenbach, 1984, McGuire & Richman, 1988,
Rutter, 1967) were not satisfactory for our purposes: first, on conceptual grounds, for example,
in terms of how different aspects of social and behaviour aspects of school behaviour were
defined (see above), second, there were technical concerns, in terms of the structure of the
measures and the reliability of sub scales, and, third, because of their length and their
appropriateness for the age of children in the Class Size study.
Given the numbers of pupils involved in the project, and the way that teachers have privileged
information about students in their class, we decided that a teacher administered procedure
would be preferable. Ladd & Profilet (no date) justify the use of teacher reports as the basis for
information on peer relations, especially when judgements required are of a more qualitative
kind (e.g. how empathetic a child is toward peers). Teachers are likely to be more
measure that teachers, given their other commitments to the research project, would not find
inconvenient and too time consuming to complete. The PBR was developed at the Institute of
Education and was based on other behaviour rating scales (particularly Ladd & Profilet's
(undated) Child Behaviour Scale, with additional items taken from Thompson's (1975)
Adjustment to School Scale, Rowe's (1995) Behavioural Rating Inventory, the Avon Baseline
Assessment (1996), and the Pre-School Behaviour Checklist (McGuire & Richman, 1988).
Teachers completed a PBR for every child in the study at the same time during the middle of the
summer term. It comprised over 50 items rated on a three-point scale ('certainly applies to this
child', 'applies sometimes to this child', 'does not apply to this child'). Scores on conceptually and
empirically linked items that made up a set of factors were added. The factors were:
hyperactive/distractible (15 items), aggressive (14 items), anxious/fearful (3 items), pro-social (7
items), asocial (7 items), and excluded (7 items). Cronbach alphas were high:
hyperactive/distractible - 0.96, aggressive - 0.91, anxious/fearful -0.82, pro-social - 0.94, asocial
- 0.88, and excluded -0.93. Individual items that made up each factor are presented in Appendix
2.
Class sizes
Data were collected on class sizes in two forms: first in terms of the number of children on the
school register, and, second, in terms of the number of children actually in the classroom at a
given point during a morning session pre-selected by the researchers. This was collected termly
and averaged over the year to give measures of ‘registered’ and ‘experienced’ class size for each
involved in measuring class sizes.)
Entry attainments and eligibility for free school meals
It is clearly important to establish that there are no prior differences between children in large
and small classes that might affect results from the observation study. The relationship between
class size and background factors such as income level and attainment level is not clear-cut in
the U.K. but in order to check if there were prior differences between large and small classes,
two sources of data were used:
i. School entry attainment: Information was collected when the pupil entered school
by means of a baseline entry assessment conducted by the teacher. The procedure
was the Avon Reception Entry Assessment (1996), which covers literacy and
mathematics and comprises information from teacher ratings, based on classroom
observations, and tasks completed by children. A measure of literacy knowledge
was derived by adding for each child scores on 15 items in language, 18 in
reading, 17 in writing and a test of letter identification (how many of 26 letters
were recognised in terms of either name or sound), and a measure of mathematics
was based on total correct out of 19 items. Training was provided for class
teachers in its use.
ii. Information on free school meal entitlement was collected for each child (as a
measure of low family income).
Differences between children in large and small classes
In order to ensure that there were no existing differences between children in large and small
classes, that might affect interpretation of observation results, differences between classes in
terms of 1. school entry assessments in literacy and mathematics, and 2. eligibility for free
school meals (the percentage in a class) were analysed with ANOVA. There were no differences
between classes on these two measures, indicating that children did not differ on entry to small
and large classes in terms of attainment or poverty/income levels.
1. The Systematic observation results
Total scores for the three 'social mode' categories, i.e., teacher-child, child-child and not
interacting, were calculated for each child by adding each of the teacher to child 'content'
categories (and the child to teacher 'content' categories, which are almost but not exactly the
same, see below), the child-child categories, and the not interacting categories. These total
scores therefore give a broad picture of how children's time was distributed between the three
modes. Mean differences (i.e., the average number of 10 second observations per child)
between large and small classes are shown in Table 1.
Table 1 here
It can be seen that children in small classes were more often observed interacting with their
can differ slightly, e.g., a child might initiate a contact in a time interval but the teacher has
not yet or does not respond to it. Just taking the teacher to child measures, in a small class
children were observed on average 213 times with their teacher, as compared to 144 times in
a large class. Conversely, Table 1 shows that children in large classes are more likely to
interact with other children (average of 54 v 76 observations per child) and be on their own
(131 v 154 observations).
Table 2 here
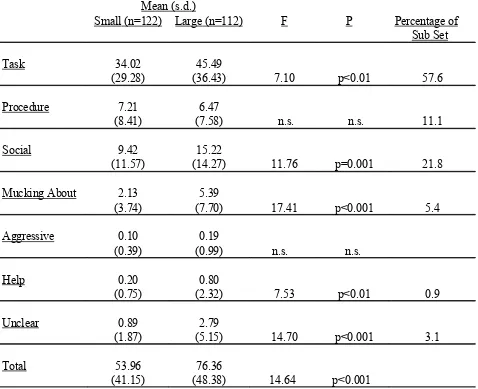
We now look more closely at the categories describing interactions with other children (see
Table 2). About 60% of the child-child contacts are classified as task - i.e., concerned with
allocated work - and there were more of these in large classes. This proportion is in line with
the greater amount of child-child contacts overall in large classes. However there were also
more off task behaviours with peers, i.e. more 'mucking about' (more than twice as much in
large classes), and this seems to reflect more than just more time overall with other children.
Apart from task related behaviours, the most frequent category of child-child contact is social
behaviours - more than 20% of child-child interactions. There were significantly more social
interactions in large classes. There were no differences between class sizes in the amount of
interactions involving procedural matters. There were very few coded instances of aggression
and help between children. So, in summary, there are more contacts overall between children
in large classes, involving task, social and off task behaviours.
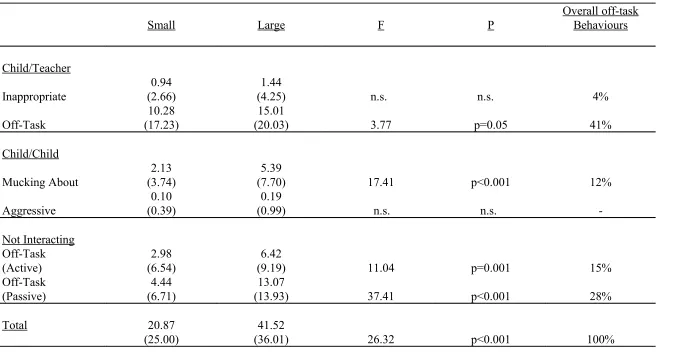
We can add up all the off task behaviours in the three social modes to give a total off-task
score for each child (i.e., the total of child to teacher inappropriate and off task, child to child
mucking about and aggressive, and not interacting off task active and off task passive - see
Table 3). Social activities (e.g., talking about television programmes, someone’s appearance)
are in a sense off-task but are excluded for the purpose of this analysis because they were by
definition not deemed to be unacceptable to the teacher, and therefore not deliberately off task
in the same way as the off-task categories. It is common for work related behaviour to be
accompanied by social talk. A more precise term for 'off task' might be something like 'task
avoidant', though we retain the more common usage here.
Table 3 here
It can be seen in Table 3 that there is twice as much off task behaviour overall in large classes
in comparison to small classes (42 v 21 observations). The most frequent forms of off task
behaviour are not attending to the teacher and not attending to their work when on their own.
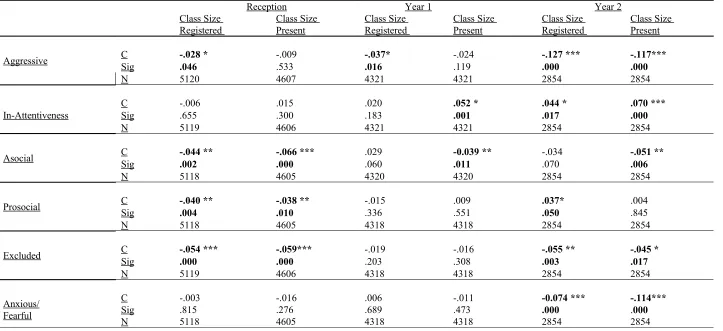
2. Class size and the PBR Factors
Correlations were calculated between mean class size over the reception year and total scores
on the six PBR factors. This was done with the class and also for the individual child as the
unit of analysis. Results are shown in Table 4 for the child level analyses
Class size differences are weakly though significantly related to the six factors. Perhaps most
consistent are relations with the aggressive, asocial, and excluded factors, but in an
unexpected way. Although not strong, there is a tendency across all three years for children in
larger classes to be rated as less aggressive, asocial, and less excluded, or, to turn this on its
head, for children in smaller classes to be rated as more aggressive, asocial, and more
excluded. The results concerning the prosocial factor were not clear. Only in the reception
year is there some evidence that children in smaller classes are more prosocial.
These results on aggression, asocial and excluded were puzzling and the relationship between
these PBR factors and class size was explored further in terms of class size as a categorical
variable, divided into bands of 20 or less, 21-25, 26-30, and 31 plus pupils (see Mortimore &
Blatchford, 1993). This approach can be helpful in detecting relationships between PBR
scores and particular parts of the class size distribution. Results were calculated separately for
Reception, Y1 and Y2, for Cohort 1 and are shown in Table 5.
Table 5 here
In line with the correlational results there were significant differences between the four class
size bands and Aggressive, Asocial and Excluded scores at reception and between class size
and Asocial and Excluded scores at Y1. Examination of mean scores at reception level
indicates a tendency for children in small classes of 20 or less to be MORE inclined to be
rated as aggressive, asocial and excluded by their peers. This was supported by post hoc tests
band and the other three bands). There was a similar pattern for Y1 for asocial and excluded.
Connections between class size and Aggressive at Y1 were in the expected direction, with
higher scores in the two smaller class size categories (20 or less and 21-25), but differences
between the four groups were not statistically significant. Results for Y2 were not so clear
and this may have been affected by there being few small classes under 20; however, there
was still no sign of more aggressive, asocial or excluded behaviour in large classes – if
anything there was less in the largest classes of 30 or more children.
It needs to be stressed that these results, even when statistically significant, are not strong
(and results involving scales at the school class level are not as clear); nevertheless they are
consistent in indicating that children in the smallest classes may have the most difficulties
with their peers, and that there is no evidence that classroom peer related behaviour, in terms
of aggressive, asocial and excluded behaviours, is worse in larger classes.
Attentiveness in class
We have examined relations between class size and attentiveness or on/off task behaviour, on
the basis of systematic observations in classrooms; here we look at the associations between
the PBR attentiveness (hyperactive /distractible) factor and class size.
The association was not strong, as can be seen in Table 4. For the child level data, there was
no clear association at reception, but there were significant but weak relationships at Y1 (for
class size present) and Y2 (for both class size registered and class size present). As expected
no clear association with the class level data.
Finally, associations between class size and the Anxious/Fearful Factor were not significant
for reception and Y1; in Y2 there was a negative relationship, indicating again that there was
more anxious/fearful behaviour detected as class sizes became smaller.
DISCUSSION
The overall conclusions from this study are that:
- results from systematic observations showed that children in large classes are more
likely to be off task, particularly in terms of not attending to the teacher and not
attending to their work when on their own.
- results from the systematic observation study showed that children in large classes
are more likely to interact with their peers (and be on their own), and interact less with
the teacher. Children in larger classes engage in more task-related contacts, more
social interactions and also more off task behaviours, in the form of 'mucking about'.
-associations between class size and factors measured in the PBR (distractible,
asocial, excluded, anxious/fearful, aggressive behaviour, pro-social behaviour,
aggression, asocial) were not strong, but there was a slight though consistent tendency
for worse peer relations, in terms of aggression, asocial and excluded, in the smallest
classes.
forms of data collection it produces data on the basis of careful recording of on-going
behaviour (rather than, say, ratings or judgements). Criticisms of systematic observation have
usually centred on validity issues (e.g. Delamont & Hamilton, 1986), but it can be useful
research tool when answering specific research questions where data are needed on relatively
easily observed, high frequency behaviours (Croll, 1986, McIntyre & Macleod, 1986).
The present study also supports the value of developing an instrument like the PBR in
allowing distinctions between, and separate measurement of, similar but distinct forms of
social functioning. The value in separating distractible/inattentive (externalising) behaviour
from aggressive behaviour and from distractible anxious/fearful (internalising) behaviour is to
a degree validated because they had different relationships with class size.
Attentiveness and off task behaviour
Results from the observation study therefore showed that children in large classes were more
likely to be off task. They were less likely to attend to the teacher and to be off task in
contacts with her, more likely to be actively off task with other children, and more likely to be
off task when on their own, especially in the passive form of being disengaged from allocated
work. Results from the PBR were less clear, though there were weak but significant
relationships between class size and distractibility. There is then some confirmation of the
expectation that children in large classes will be more distracted from work and more often
off task.
(Blatchford, Goldstein, Martin & Browne, submitted), they are also less likely to be off task.
In separate analyses, and in line with previous research (e.g., Rowe, 1995), we have also
found that there are strong connections between distractibility as measured in the PBR and
academic attainment and progress. However, it would be too early to say that it is lack of
concentration in class that mediates the class size effect. In future work we will examine the
extent to which attentiveness, and other classroom processes such as teaching time, seem to
mediate class sizes effects on adjusted end of year scores.
As described in the Introduction the observation and PBR data covered allied but different
aspects of peer relations and attentiveness in class. That the observation measures seem more
clearly related to size of class than the PBR data is perhaps not surprising. The observation
measure deals with moment-by-moment behaviour in classrooms, while the PBR is a
retrospective rating by the teacher, and is therefore not so likely to be sensitive to immediate
contextual influences. The PBR Hyperactive/distractible factor certainly involves items that
reflect a lack of concentration or attention but is likely to reflect a relatively stable and
perhaps more endogenous, within-child description. For this reason this measure may be
especially useful not so much as an outcome of class size differences but as a factor to be
controlled for when considering class size effects on educational progress, for example, as a
class ‘compositional’ variable in the form of the percentage of children in the class with
difficulties.
There may appear to be something of a conflict between the observation and PBR results, in
aggressiveness are more likely in small classes, but the observation results show off task
behaviour to be more likely in large classes. However, the measures are not really tapping the
same thing. We have seen that most off task behaviour in the observation study involves not
attending to the teacher or work. In the case of peer interactions of task behaviour is mostly
'mucking about' which is not the same as aggressiveness. In fact, aggression between children
is very rare.
Class size and peer relations
We have seen that the most consistent results from the analysis of relationships between class
size and the PBR factors was for children in the smallest classes to be more likely to be rated
as aggressive, asocial and rejected. How do we explain these seemingly odd findings from the
PBR?
There are two main possibilities. The first explanation is in terms of the effect of class size on
teachers' perception of children in their class. One possibility is that teachers have a clearer
and more visible picture of children in smaller classes. There is perhaps a tendency for
children to be more salient. As one of the research team put it: 'they're all normal until you get
to know them.' Some support for this explanation comes from case studies and end of year
questionnaires carried out as part of the wider Class Size Study. With fewer children a teacher
can get know her children better (Blatchford, Moriarty, Edmonds & Martin, in press), and this
would allow her to be more aware of the difficulties some children might have in relating to
It is not possible to exactly test this explanation, which in a sense relates to the validity of the
PBR, though it is unlikely to fully account for the findings. It is known that the PBR ratings
do correlate reasonably well with judgements of external researchers, peer nominations and
observational data on the same dimensions (Blatchford, Baines & Pellegrini, submitted),
which indicates a fair degree of validity for the PBR. Ladd & Profilet (no date) also show
high validity for their teacher-administered Child Behaviour Scale, which is similar to the
PBR. Moreover, if the experience of a smaller class increases the likelihood of a feel-good
factor, with teachers less stressed (Moriarty, Edmonds, Blatchford & Martin, 2001), we might
expect this to affect their judgements of children in a positive at least as much as a negative
direction.
The second possible explanation is that the associations are saying something real about
social relations in small and large classes, i.e., rather than something to do with teacher's
perceptions. But if this is true why might children in smaller classes show more of a tendency
toward less social and more aggressive behaviour toward their peers? One possible
explanation is found in the observation results which as we have seen showed that children in
larger classes spend more time with each other, interacting about work, socially as well as
'mucking about'. Conversely, in smaller classes children interact more with their teachers (and
this includes more social contacts with their teacher.) The case studies have indicated that in
small classes, especially very small ones under 20, children can come to rely on the teacher,
and look to her for direction, while in a larger class the children may be more likely to
develop a degree of independence from the teacher, and a working and social relationship
too few children in a class and it could mean that if children fell out their social relations
could suffer, and this might give teachers the impression that they are excluded or asocial.
Using a family size analogy, it may be that in a small class the children can become over
dependent on the teacher, while in a larger class children (analogous to siblings) may have to
rely more on each other. In one school with a small class the teacher, like others, no matter
what the size of class, encouraged children to learn from each other, but it was also noticeable
during observations that one rather immature boy looked to her for a lot of attention, which
she (albeit sometimes reluctantly) gave. In a larger class she would simply not have had the
time for such attention, and the boy would have been forced to look elsewhere for help.
Whether this feature of small classes outweighs the academic benefits is debatable, but does
suggest one potential difficulty with small classes, that teachers would need to guard against,
and one way in which large classes may have unexpected consequences.
This second explanation remains speculative at the moment but is interesting in the light of
the accepted wisdom in much of the literature of generally positive effects. On the evidence
so far from the Class Size Study, small classes may be good academically for young children
(Blatchford, Goldstein, Martin & Brown, submitted), but not necessarily socially.
If one starts from the assumption that teacher child contacts are likely to be the most
conducive social context for learning and achievement then the situation in large classes is
worrying. However, one should not quickly dismiss the view that task related contacts with
peers are unimportant. Although we have seen that children engaged in more off task
peers. This can be seen in positive and negative terms. If children, by being less able to get a
teacher's attention, then turn their attentions to their peers then this may be a distracting
influence and not productive. On the other hand using peers as sources of information may
actually be a valuable context for learning. Much will depend on the quality of interactions
between peers, which were not examined in the present study. Descriptive research has shown
that the level of talk between peers can be low level and unchallenging (Bennett, Desforges,
Cockburn & Wilkinson, 1985), even though in terms of definitions used in this study they
would still have been classified as task related. A number of authors are now recognising the
potential of peer interactive contexts in relation to achievement and motivation (O'Donnell &
King, 1999), and this in turn suggests that one type of strategy teachers could make when
faced with larger classes is to make more deliberate use of peer interactive contexts. This will
require helping pupils to work productively together, e.g. in terms of gaining trust and
confidence in each other, listening to each other, and giving and receiving explanations
(Webb & Falivar, 1999), as well as attention to features of within class groupings (Blatchford,
Baines, Kutnick and Martin, 2001, Kutnick, Blatchford & Baines, in press).
APPENDIX 1
Systematic Observation Categories
Observation categories and brief definitions and examples are as follows:
(A) The Social Modes
(1) Teacher-Child Contact
(a) Social setting: one-to-one,group or whole class.
child is focus in group or class involving target child, or teacher interacts to same extent
with all children). These two sets of categories described the behavior coded in the
‘teacher content’ section.
(c) Teacher content: task-teach: contacts directly concerned with the substantive content
of children’s task activities, i.e. communicating concepts, facts or ideas by explaining,
informing, demonstrating, questioning, suggesting (‘task’ here includes any activity in
settings, other than transition times). Task-preparation: contacts directly concerning the
organization and preparation of children’s task activities and not their substantive
content. Task-silent: a teacher’s contribution to task contact is passive, e.g. hearing child
read, looking over child’s work. Procedure: contacts concerned with classroom
management and organization of classroom routine, often at transition times, e.g. milk,
washing, changing, organizing materials. Social: personal or social comments, e.g. about
life outside the classroom, children’s appearance, health, etc. Unclear: not possible to
code reliably.
(2) Child-Teacher
(a) Child contribution: codes child’s contribution to interaction with teacher in terms of
respond to teacher, initiate contact with teacher, attend to teacher, continued interaction
from previous time intervals and unclear. These categories describe the child’s
contribution to the behavior coded in the ‘child content’ section. If the child interacted in
an overt way (‘respond’, ‘initiate’, continued’), these were coded; only when the child
attended for the whole ten-second interval was ‘attend’ coded. Because of its likely low
within the same interval. Predominant activity sampling therefore (see below) was not
used for the ‘child contribution’ categories.
(b) Child content: task: all child behaviors in contact with teacher that are concerned
with ‘task’ as defined for ‘teacher content’, above. Procedure: equivalent to teacher
‘procedure’, above. Social: equivalent to teacher ‘social’, above. Inappropriate: child
behavior to teacher obviously unrelated to teacher request or situation, e.g. not answering
a question on maths, but making a comment about a television program the previous
evening. Off-task: child behavior involving the teacher, but not directed at her, that is,
inappropriate or unrelated to situation (e.g. not attending to story). Unclear.
(B) Child-Child
Coded when child is in contact with other children but not teacher. Task: all contacts
with other children that are concerned with the content of ‘tasks’ as defined for ‘teacher
content’, above. Procedure: all contacts with other children concerning classroom
organization and routine. Social: social or personal contacts not related to work or
procedure. Mucking about: contacts that involve fooling around. Like social contacts,
they are not about task or procedural activities, but are more obviously off-task.
Aggressive: target child is aggressive (verbally or physically) towards other child(ren).
Help: target child helps another child, e.g. helps tie her shoelaces. Unclear: behavior
with other children that cannot be coded reliably, as above.
(C) Not Interacting
Coded during time intervals child is not in contact with teacher or other children.
above). Procedure: activity concerned with procedure or routine. Off-task (active): target
child focuses on something other than task in hand. Off-task (passive): target child is
disengaged during task activity, e.g. wandering around or daydreaming. Audience: target
child observes other children or teacher when not in contact with them. Unclear:
behavior when not interacting that cannot be reliably coded, as above.
APPENDIX 2
Pupil Behaviour Rating (PBR) Scale
Aggressive (with peers) (14 items):
Aggressive child
Bullies other children
Threatens other children
Taunts and teases other children
Fights with other children
Kicks, bites, hits
Difficult to manage or control; defiant
Irritable
Argues with peers
Destroys own or others’ belongings
Disrupts peers’ activities
Is disobedient
Restless
Hyperactive-Distractible/ Purposeful-Attentive (15 items)
Perseveres
concentrates
persistent, sustained attention span
poor concentration
purposeful
likes to work things out for self
inattentive
behaves appropriately (less structured)
not much difficulty understanding instructions
squirmy
independently selects and returns equipment
moves to new activity on completion of a task
coherent
behaves appropriately (classroom routines)
coping well with school, not a cause for concern
Anxious-Fearful (4 items)
Is worried
Fearful or afraid
cries easily
Peer relations
Asocial with peers (6 items)
Likes to be alone
Solitary child
Keeps peers at a distance
Prefers to play alone
Avoids peers
Withdraws from peer activities
Excluded by peers (7 items)
Peers refuse to let child play
Peers avoid this child
Is ignored by peers
Excluded from peers activities
Not chosen as playmate by peers
Ridiculed by peers
Not much liked
Prosocial with peers (7 items)
Concerned when other children are distressed
Recognises feelings of others; is empathetic
Offers help or comfort when other children are upset
Kind towards peers
Shows concern for moral issues
REFERENCES
Avon Reception Entry Assessment (1996) Avon Education Department and the
Institute of Education
Bennett, N. (1996) Class size in primary schools: perceptions of head teachers, chairs of
governors, teachers and parents. British Educational Research Journal, 22, 1, 33-55.
Bennett, N., Desforges, C., Cockburn, A. & Wilkinson, B. (1984) The Quality of Pupil
Learning Experiences. London: Erlbaum.
Blatchford, P. (submitted) A systematic observational study of teachers' and pupils'
behaviour in large and small classes.
Blatchford, P., Baines, E., Kutnick, P., & Martin, C. (2001) Classroom contexts:
connections between class size and within class grouping. British Journal of Educational
Psychology, 71, 2, 283-302
Blatchford, P., Baines, E. & Pellegrini, A. (submitted) Peer relations on the
playground: differences between, and predictors of, playground involvement
Blatchford, P., Battle, S., & Mays, J. (1982) The First Transition: Home to Pre-school.
NFER-Nelson: Windsor
Blatchford, P., Burke, J., Farquhar, C., Plewis, I. & Tizard, B. (1987) ‘A systematic
observation study of children’s behaviour at infant school’, Research Papers in Education,
2,1,47-62.
Blatchford, P., Goldstein, H., Martin, C. & Browne, W. (in press) A study of class size
Blatchford, P., Goldstein, H., & Mortimore, P. (1998) Research on class size effects: a
critique of methods and a way forward. International Journal of Educational Research, 29,
691-710.
Blatchford, P., & Martin, C. (1998) ‘The Effects of Class Size on Classroom
Processes: “It’s a bit like a treadmill - working hard and getting nowhere fast!”. British
Journal of Educational Studies, Vol. 46, No. 2, 118-137
Blatchford, P., Moriarty, V., Edmonds, S., & Martin, C. (in press) Relationships between
class size and teaching: a multi-method analysis of English infant schools. American
Educational Research Journal
Blatchford, P. & Mortimore, P. (1994) ‘The Issue of Class Size for Young Children in
Schools: what can we learn from research?’ Oxford Review of Education, Vol. 20, No. 4,
411-428
Cleave, S., Jowett, S. & Bate, M. (1982) ...And So to School: A Study of Continuity
from Pre-School to Infant School. Windsor: NFER-Nelson.
Coie, J.D. & Dodge, K.A. (1998) ‘Aggression and antisocial behaviour’. In W. Damon
(ed.), and N. Eisenberg (vol. ed), Handbook of Child Psychology: Vol III: Social emotional and
personality development, (pp.779-863). New York: John Wiley.
Cooper, H.M. (1989) Does reducing student-to-teacher ratios affect achievement?
Educational Psychologist, 24,1, pp.79-98
Creemers, B. (1994) The Effective Classroom. London: Cassell.
Day, C., Tolley, H., Hadfield, M., Parking, E., & Watling, R. (1996) Class research
and the quality of education. Report for National Association of Headteachers, Centre for
teacher Development and School Improvement, School of Education, University of
Nottingham.
Delamont, S. & Hamilton, D. (1986) Revisiting classroom research: a continuing
cautionary tale. In Hammersley, M. (ed.) Controversies in Classroom Research. Milton Keynes:
Open University Press.
Edelbrock, C. & Achenbach, T.M. (1984) The teacher version of the Child Behaviour
Profile: boys aged 6-11, Journal of Consulting and Clinical Psychology, 52, 2, 207-217
Finn, J.D. & Achilles, C.M. (1999) Tennessee’s Class Size Study: findings, implications,
misconceptions. Educational Evaluation and Policy Analysis, Vol. 21, No.2, 97-109.
Galton, M., Simon, B. & Croll, B. (1980) Inside the Primary Classroom. London:
Routledge & Kegan Paul.
Glass, G., Cahen, L., Smith, M.L. & Filby, N. (1982) School Class Size. Beverley Hills:
C.A., Sage.
Goldstein, H. & Blatchford, P. (1998) ‘Class size and educational achievement: a
review of methodology with particular reference to study design’. British Educational
Research Journal, Vol. 24, No. 3, p255-268.
Grissmer, D. (1999) Class size effects: assessing the evidence, its policy implications
and future research agenda. Educational Evaluation and Policy Analysis, 21, 2, 231-248.
Klein, K. (1985) The research on class size, Phi Delta Kappan, 66, pp. 578-80
Kutnick, P., Blatchford, P., & Baines, E. (in press) Pupil groupings in Primary School
Ladd, G. W & Profilet, S.M. (undated) Child Behavor Scale. University of Illinois at
Urbana-Champaign.
McGuire, J. & Richman, N. (1988) Pre-School Behaviour Checklist (PBCL) Handbook.
Windsor, Berks: NFER-Nelson
McIntyre & Macleod, (1986) The characteristics and uses of systematic observation. In
Hammersley, M. (ed.) Controversies in classroom research. Milton Keynes: Open University
Press.
Moriarty, V., Edmonds, S., Blatchford, P. & Martin, C. (2001) Teaching young children:
perceived satisfaction and stress. Educational Research.
Mortimore, P. & Blatchford, P. (1993) ‘The Issue of Class Size’. In National
Commission on Education (1993) Briefings (pp.167-182). London: Heinemann
Nye B., Hedges, L.V. & Konstantopoulos, S. (2000) The effects of small classes on
academic achievement: the results of the Tennessee class size experiment, American
Educational Research Journal, 37, 1, 123-151
O’Donnell, A.M. & King, A. (1999) (Eds.) Cognitive Perspectives on Peer Learning.
Mahwah, NJ: Lawrence Erlbaum Associates
Pate-Bain, H., Achilles, C.M., Boyd-Zaharias, J. & McKenna, B. (1992). Class size
makes a difference. Phi Delta Kappan, 74, 3, 253-6.
Parker, J. G. & Asher, S.R. (1987) Peer relations and later personal adjustment: are
low-accepted children at risk? Psychological Bulletin, 102, 3, 357-89.
Rowe, K. J. (1995) Factors affecting students’ progress in reading: key findings from a
Rubin, K.H., Bukowski, W. & Parker, J. (1998) Peer interactions, relationships, and
groups. In W. Damon (Ed.), & N. Eisenberg (Vol. Ed), Handbook of child psychology : Vol.
III: Social emotional and personality development, (pp.619-700). New York: John Wiley.
Rutter, M. (1967) A children’s behaviour questionnaire for completion by teachers:
preliminary findings, Journal of Child Psychology and Psychiatry, 8, 1-11
St James-Roberts, I., Singh, G., Lynn, R. & Jackson, S. (1994) Assessing emotional and
behavioural problems in reception class school-children: factor structure, convergence and
prevalence using the PBCL, British Journal of Educational Psychology, 64, 105-118
Shapson, S.M., Wright, E.N., Eason, G. & Fitzgerald, J. (1980) An experimental study
of the effects of class size, American Educational Research Journal, 17, pp. 144-52
Slavin, R.E., Hurley, E.A. & Chamberlaine, A. (2000) Co-operative learning and
achievement: research and theory, John Hopkins University.
Smith, A.B., McMillan, B.W., Kennedy, S. & Ratcliffe, B. (1989) The effect of
improving pre-school teacher/child ratios: an ‘experiment in nature’, Early Child Development
and Care, 41, pp. 123-38
Smith, P. K., & Connolly, K. (1980) The ecology of preschool behavior. London:
Cambridge University Press.
Thompson, B. (1975) Adjustment to school, Educational Research, 17,2, 128-136
Tizard, B., Blatchford, P. Burke, J., Farquhar, C. & Plewis, I. (1988) Young Children at
School in the Inner City. Hove: LEA.
Webb, N.M. & Farivar, S. (1999) Developing group interaction in middle school
Table 1
Systematic observations of large and small classes: mean differences in
The Social Modes
1 Teacher-Child Mean (sd)
Small (n=122) Large (n=112) F (df) significance
a) Teacher to Child 212.95
(104.37)
143.93
(56.89) 38.47 (1,232), p<0.001
b) Child to Teacher 215.25
(103.77)
148.01
(58.16) 36.50 (1,232), p<0.001
2 Child-Child 53.96
(41.15)
76.36
(48.38) 14.64 (1,232), p<0.001
3 Not Interacting 130.80
(73.30)
154.10
(65.07) 6.56 (1,232), p<0.05
Table 2
Systematic observations of small and large classes: Mean differences in Child-Child Interactions
Mean (s.d.)
Small (n=122) Large (n=112) F P Percentage of
Sub Set
Task 34.02
(29.28)
45.49
(36.43) 7.10 p<0.01 57.6
Procedure 7.21
(8.41)
6.47 (7.58)
n.s. n.s. 11.1
Social 9.42
(11.57)
15.22
(14.27) 11.76 p=0.001 21.8
Mucking About 2.13
(3.74)
5.39
(7.70) 17.41 p<0.001 5.4
Aggressive 0.10
(0.39)
0.19 (0.99)
n.s. n.s.
Help 0.20
(0.75)
0.80
(2.32) 7.53 p<0.01 0.9
Unclear 0.89
(1.87)
2.79
(5.15) 14.70 p<0.001 3.1
Total 53.96
(41.15)
76.36 (48.38)
Table 3
Systematic observation of small and large classes: mean differences in Child ‘off-task’ Behaviours
Small Large F P
Overall off-task Behaviours Child/Teacher Inappropriate 0.94 (2.66) 1.44
(4.25) n.s. n.s. 4%
Off-Task
10.28 (17.23)
15.01
(20.03) 3.77 p=0.05 41%
Child/Child
Mucking About
2.13 (3.74)
5.39
(7.70) 17.41 p<0.001 12%
Aggressive
0.10 (0.39)
0.19
(0.99) n.s. n.s.
-Not Interacting Off-Task (Active) 2.98 (6.54) 6.42
(9.19) 11.04 p=0.001 15%
Off-Task (Passive)
4.44 (6.71)
13.07
(13.93) 37.41 p<0.001 28%
Total 20.87
(25.00)
41.52
Table 4
Pupil Behaviour Rating Factors and Class Size (Correlation Coefficients) (Child Level)
Reception Year 1 Year 2 Class Size
Registered Class Size Present Class Size Registered Class Size Present Class Size Registered Class Size Present
Aggressive CSig -.028 *.046 -.009.533 -.037*.016 -.024.119 -.127 ***.000 -.117***.000
N 5120 4607 4321 4321 2854 2854
In-Attentiveness
C -.006 .015 .020 .052 * .044 * .070 ***
Sig .655 .300 .183 .001 .017 .000
N 5119 4606 4321 4321 2854 2854
Asocial CSig -.044 **.002 -.066 ***.000 .029.060 -0.039 **.011 -.034.070 -.051 **.006
N 5118 4605 4320 4320 2854 2854
Prosocial CSig -.040 **.004 -.038 **.010 -.015.336 .009.551 .037*.050 .004.845
N 5118 4605 4318 4318 2854 2854
Excluded CSig -.054 ***.000 -.059***.000 -.019.203 -.016.308 -.055 **.003 -.045 *.017
N 5119 4606 4318 4318 2854 2854
Anxious/ Fearful
C -.003 -.016 .006 -.011 -0.074 *** -.114***
Sig .815 .276 .689 .473 .000 .000
Table 5 - Pupil Behaviour Ratings Factors Scores x Registered Class Size
Reception Aggressive Asocial Excluded by Peers
Class Size Mean SD N Mean SD N Mean SD N
20 or less 4.38 6.85 458 1.70 3.03 458 1.71 3.37 458
21 to 25 3.41 5.40 1153 1.15 2.27 1153 1.08 2.42 1153
26 to 30 3.26 5.66 2502 1.23 2.49 2501 1.22 2.76 2502
31+ 2.98 4.98 1052 1.20 2.12 1052 .94 2.08 1052
F(3,5161) 6.99 p<.001 F(3,5160) 6.10 p<.001 F(3,5161) 10.07 p<.001
Year 1 Aggressive Asocial Excluded by Peers
Class Size Mean SD N Mean SD N Mean SD N
20 or less 3.5 6.4 257 1.2 2.5 257 1.3 3.0 256
21 to 25 3.4 5.2 846 .69 1.6 846 1.0 2.1 846
26 to 30 3.0 5.1 2313 .78 1.9 2312 .99 2.2 2311
31+ 3.1 5.2 859 .89 1.9 859 1.2 2.4 859
Not Significant F(3,4270) 5.979 p<.001 F(3,4268)2.8 p<.05
Year 2 Aggressive Asocial Excluded by Peers
Class Size Mean SD N Mean SD N Mean SD N
20 or less 2.19 2.85 31 .26 .44 31 1.00 1.97 31
21 to 25 3.60 5.42 690 .79 1.67 690 1.13 2.31 690
26 to 30 2.69 4.68 1334 .78 1.67 1334 1.07 2.37 1334
31+ 2.04 4.25 799 .56 1.65 799 .83 2.08 799