Measurements of low energy observables, elastic
pp
interac-tions and exclusive production in proton-proton collisions with
the ATLAS Detector
P. J. Bussey1,a
On behalf of the ATLAS Collaboration 1SUPA, School of Physics and Astronomy University of Glasgow
Glasgow G12 8QQ, U.K.
Abstract.A summary is given of recent ATLAS results at the LHC, covering a number of areas that reflect the Collaboration’s work in low energy physical observables in multi-particle events, elastic photon-photon scattering, proton-proton scattering and the tagging of diffractive events.
1 Introduction
A variety of processes can be studied at the LHC that involve relatively soft final states. This talk presents results from a selection of different measurements of this kind, with the aim of illustrating the wide range of physics that can be performed using the ATLAS detector [1].
2 Single-particle distributions at low transverse momentum
ATLAS have repeated earlier studies of single-particle distributions by measurements at the LHC’s highest energy of √s = 13 GeV [2]. The results can be used to compare different tunes of Monte Carlo (MC) generators, in particular P, and a selection of the distributions is shown in Fig. 1 The number of charged particles with pT > 100 MeV per event is well described at the 10–20%
level by several tunes and models, but above 120 GeV the predictions diverge, and only ELHC is satisfactory of those considered here. Averaged over all transverse momentum (pT) values, the mean
number of charged particles per unit of pseudorapidity is described worst by P8 A2, but the agreements are still all good to 7%. None of the models succeeds very well at the lowestpT values,
although ELHC is best. When the meanpTof the particles is plotted as a function of the number of
charged particles in the event, it is apparent that QGS11-04 does not model this variable properly. Of the other models, only ELHC is satisfactory.
Figure 1.Distributions of centrally produced charged particles in ATLAS with transverse momentumpTgreater than 100 MeV/c[2]. Normalised cross sections are shown as a function of the number of tracks, the pseudorapid-ity, and thepTof the tracks, the last of these scaled by 1/pT. In the final plot, the meanpTis shown as s function of the charged particle multiplicity.
Figure 1.Distributions of centrally produced charged particles in ATLAS with transverse momentumpTgreater than 100 MeV/c[2]. Normalised cross sections are shown as a function of the number of tracks, the pseudorapid-ity, and thepTof the tracks, the last of these scaled by 1/pT. In the final plot, the meanpTis shown as s function of the charged particle multiplicity.
ae-mail: peter.bussey@glasgow.ac.uk
Figure 2.Mean density in pseudorapidity of centrally produced tracks in ATLAS, as a function of√s, for tracks with a given minimumpTvalue, compared to several MC models and tunes [2].
Figure 3.Schematic diagram of the azimuthal structure of QCD scattering events at the LHC [3].
3 Measurement of distributions sensitive to the underlying event in hard
scattering processes
relative to this. The “towards” and “away” regions are defined as those that cover azimuths within 60◦
of the leading particle and above 120◦, respectively. The transverse regions, which are those where
the UE features, have azimuths between the towards and away regions. In the two transverse regions, the summedpT of the scattered particles is calculated and the trans-max and trans-min regions are
those with the greater and lesser value of this quantity.
Figure 4 shows that thepTdistribution of the leading charged particle is well described by several
MC tunes and models over values between 1 and 30 GeV. The P8 A14 and H7 models are less good than the others illustrated. The description of the UE can be affected by this quantity, and a poor description may be indicative of problems with the model.
Figure 5 shows a comparison between the present measurements at √s=13 TeV and those taken at lower LHC energies. The total summedpTin the transverse region and the number of charged tracks
in this region are plotted as functions of thepTof the leading charged particle, and it is seen that at all
LHC energies, the plotted quantities form a plateau-like shoulder once the leadingpT reaches a value
of approximately 5 GeV, which does not vary much with √s, showing that the UE has some fairly well-defined properties. However the value of the plotted quantity varies strongly with √s, showing that the available energy is shared with both the hard scatter and the UE.
The mean charged particle pT per unit of pseudorapdity and azimuth at √s =13 TeV is also
plotted in Fig. 6 for the trans-max region. Fig. 6 also shows the charged multiplicty, in both cases compared to several MC tunes and models as before. As a function of thepT of the leading particle,
all the models perform well, but His the most successful. All the models give a good description of the meanpTas a function of transverse charged particle multiplicity. The corresponding plots and
comparisons for the trans-min region are similar.
relative to this. The “towards” and “away” regions are defined as those that cover azimuths within 60◦
of the leading particle and above 120◦, respectively. The transverse regions, which are those where
the UE features, have azimuths between the towards and away regions. In the two transverse regions, the summedpT of the scattered particles is calculated and the trans-max and trans-min regions are
those with the greater and lesser value of this quantity.
Figure 4 shows that thepT distribution of the leading charged particle is well described by several
MC tunes and models over values between 1 and 30 GeV. The P8 A14 and H7 models are less good than the others illustrated. The description of the UE can be affected by this quantity, and a poor description may be indicative of problems with the model.
Figure 5 shows a comparison between the present measurements at √s=13 TeV and those taken at lower LHC energies. The total summedpTin the transverse region and the number of charged tracks
in this region are plotted as functions of thepTof the leading charged particle, and it is seen that at all
LHC energies, the plotted quantities form a plateau-like shoulder once the leadingpT reaches a value
of approximately 5 GeV, which does not vary much with √s, showing that the UE has some fairly well-defined properties. However the value of the plotted quantity varies strongly with √s, showing that the available energy is shared with both the hard scatter and the UE.
The mean charged particle pT per unit of pseudorapdity and azimuth at √s =13 TeV is also
plotted in Fig. 6 for the trans-max region. Fig. 6 also shows the charged multiplicty, in both cases compared to several MC tunes and models as before. As a function of thepT of the leading particle,
all the models perform well, but His the most successful. All the models give a good description of the meanpT as a function of transverse charged particle multiplicity. The corresponding plots and
comparisons for the trans-min region are similar.
Figure 4. Normalised differential cross section of the leading charged particle in hadronic scattering events in ATLAS, compared to a selection of MC models and tunes [3].
Figure 5.Distributions in the summedpT and the number of charged tracks in the transverse azimuthal region, per unit pseudorapdity and azimuth, as functions of thepTof the leading charged track in the event, for different values of LHC collision energy [3].
Figure 6. Distributions of the mean pT of centrally produced charged particles in the trans-max region, as functions of the leading particlepTand the charged multiplicity in the transverse region [3].
4 Study of ordered hadron chains with the ATLAS detector
In MC simulations based on the Lund string model, such as P, the colour string is postulated as a linear object that splits along its length. More complex types of colour connection are in principle possible, and ATLAS have studied a proposal based on a helical string structure. In this proposal [4], new features may in principle be observed, and a new test has been performed by ATLAS using 7 TeV data. Minimum-bias events are selected and triplets of charged tracks are studied by finding the like-sign track pair with the smallest value ofQ2=−(p
i−pj)2and then identifying the third opposite-sign
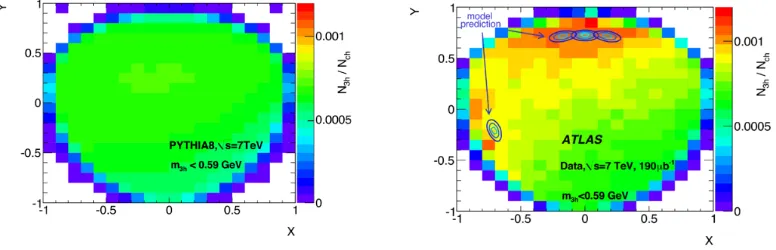
Figure 7 shows on the left the Dalitz plot that is obtained using events generated by P; a broad, featureless plateau is seen. Hgives rise to a structure that is featureless in theXdirection but shows a gradual, smooth enhancement in theYdirection. On the right, while Eshows a broad central enhancement inY. The Dalitz plot inX,Y obtained from the data [5], by contrast, exhibits indications of narrow structures at lowX and high Y, incompatible with the MC models that have been studied. Also shown in the Figure are some indications of the type of structure that the helical string model predicts. These are in qualitative agreement with the data and give support for further investigation of this type of model.
Figure 7.(Left) Dalitz plot of variablesXandY,as defined in the text, obtained using P8 4C. (Right) Dalitz
plot from data, on which are superposed model predictions involvingπ+π−π0π+combinations with unobserved
π0, atX≈ −0.7, and triplets of charged pions with and without a further unobserved particle, atY ≈0.7 [5].
5 Measurement of exclusive two-photon production of muon pairs
At LHC energies, high-energy photons are radiated sufficiently strongly from the incoming protons for photon-photon processes to be measurable. The simplest of the processes to measure is the exclu-sive production of muon pairs, since these are not produced by hadronic mechanisms. ATLAS have performed a measurement of the processγγ→µ+µ−[6] in which the two exchanged photons are
ra-diated from the incoming protons, which emerge scattered through a small angle and are not observed. Accompanying the exclusive mechanism are processes in which one or both of the protons emerge in a dissociated state (single or double dissociative processes); the products of the proton dissociation are usually unobserved, but the dynamics of the process may be affected.
To restrict the measurement to the electromagnetic production of muon pairs, the inclusion of Z → µ+µ− events is avoided by selecting events that contain muon pairs with mass in the range
12–70 GeV. The primary vertex must be isolated, with a requirement that the total pT of the muon
Figure 7 shows on the left the Dalitz plot that is obtained using events generated by P; a broad, featureless plateau is seen. Hgives rise to a structure that is featureless in theXdirection but shows a gradual, smooth enhancement in theYdirection. On the right, while Eshows a broad central enhancement inY. The Dalitz plot inX,Y obtained from the data [5], by contrast, exhibits indications of narrow structures at low Xand high Y, incompatible with the MC models that have been studied. Also shown in the Figure are some indications of the type of structure that the helical string model predicts. These are in qualitative agreement with the data and give support for further investigation of this type of model.
Figure 7.(Left) Dalitz plot of variablesXandY,as defined in the text, obtained using P8 4C. (Right) Dalitz
plot from data, on which are superposed model predictions involvingπ+π−π0π+combinations with unobserved
π0, atX≈ −0.7, and triplets of charged pions with and without a further unobserved particle, atY ≈0.7 [5].
5 Measurement of exclusive two-photon production of muon pairs
At LHC energies, high-energy photons are radiated sufficiently strongly from the incoming protons for photon-photon processes to be measurable. The simplest of the processes to measure is the exclu-sive production of muon pairs, since these are not produced by hadronic mechanisms. ATLAS have performed a measurement of the processγγ→µ+µ−[6] in which the two exchanged photons are
ra-diated from the incoming protons, which emerge scattered through a small angle and are not observed. Accompanying the exclusive mechanism are processes in which one or both of the protons emerge in a dissociated state (single or double dissociative processes); the products of the proton dissociation are usually unobserved, but the dynamics of the process may be affected.
To restrict the measurement to the electromagnetic production of muon pairs, the inclusion of Z → µ+µ− events is avoided by selecting events that contain muon pairs with mass in the range
12–70 GeV. The primary vertex must be isolated, with a requirement that the total pT of the muon
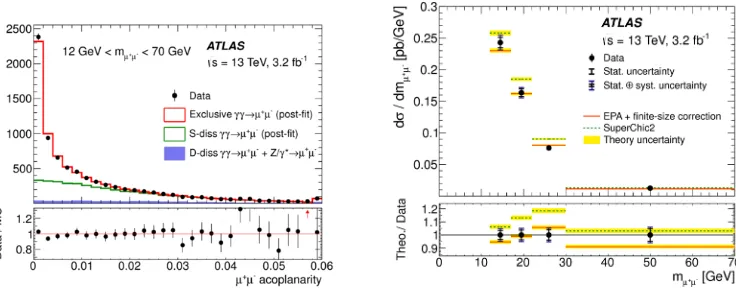
pairs must be less than 1.5 GeV in order to suppress single-dissociative events. The acoplanarity of the muon pairs after these selections is shown in Fig. 8 and shows that the observed process can be well modelled in terms of exclusive and single dissociative events, with a very small admixture of double dissociative events. Other backgrounds are negligible. The figure also shows the measured differential cross section in the dimuon mass. An equivalent-photon-approximation model (EPA) describes the data well, and better than the more elaborate SuperChic2 model.
Figure 8.(Left) Muon pair acoplanarity in events with just an observed muon pair, modelled as the sum of the exclusive process and the single and double proton dissociative processes. (Right) Differential cross section in the muon pair mass for exclusive events, compared to the EPA and SuperChic models [6].
6 Total
pp
scattering cross section
The most basic measurement to be made in particle-particle scattering is the total scattering cross sec-tion. This has been measured by ATLAS at √s=8 TeV [8] by means of the ALFA sub-detector [7], which consists of arrays of scintillating fibre detectors mounted in Roman Pots either side of the two emerging proton beams at distances of 237 and 241 m downstream of the main detector (Fig. 9). Co-incidences between counts in these systems measure elastic proton-proton scattering events. Special beam conditions are required to enable the elastic scattered protons to reach the detectors down to scattering angles that are as possible with negligible pile-up.
Figure 10 shows the measured differential cross sections as a function of−t. A fit to the data at lowtenables the total cross section to be evaluated though the Optical Theorem, by means of
σ2tot=16π(c) 2
1+ρ2 dσel
dt ,
Figure 9. Beam configuration in the region of the ATLAS detector showing the location of the ALFA sub-detectors [7].
Figure 10. (Left) Differential cross section intof the elastic scattering of two protons in ATLAS at √s = 8 TeV [8]. (Right) Measured total and elastic cross sections in comparison with results from other measure-ments. [8, 9]
7 The ATLAS Forward Proton system
The ATLAS Forward Proton sub-detectors (AFP) [10] have now been installed and resemble the ALFA system in that they detect forward scattered protons. They are located 205–217 m downstream of ATLAS in both emerging beamlines, as seen in Fig. 11. The protons measured in AFP have lost energy in a diffractive scatter in the main detector, and the bending magnets in the beamline act as a spectrometer to measure the energy of the forward diffractive proton, so as to be able to
Figure 11. Beam configuration in the region of the ATLAS detector showing the location of the AFP sub-detectors and a schematic representation of their layout [10].
correlate this with the energy measured in the central detector. The AFP system consists of silicon tracking detectors, backed by a time-of-flight system that is intended to help identify the position of the scattering event relative to the nominal interaction point and enable pile-up events to be correctly distinguished.
First results have now been obtained. Figure 12 shows the distribution (red) of the fractional proton energy loss calculated from events recorded by the ATLAS minimum-bias trigger [11]. This is compared (suitably normalised) with a similar distribution (black) obtained with events using the AFP trigger. An upper peak resembles the minimum-bias peak and indicates random coincidences between the forward proton and the centrally detected event. A lower peak is distinct from this, and indicates that a coincidence is indeed measured between the AFP-detected proton and an event in the central detector.
8 Conclusions
Figure 12.Calculated fractional loss of energy of protons that undergo minimum-bias triggered events (red) and AFP-triggered events (black) [11].
References
[1] ATLAS Collaboration, J. Inst.3S08003 (2008) [2] ATLAS Collaboration, Eur. Phys. J.C 502(2016) [3] ATLAS Collaboration, JHEP03157 (2017) [4] S. Todorova, Phys. Rev.D89015002 (2014) [5] ATLAS Collaboration,arXiv:1709.07384 [6] ATLAS Collaboration,arXiv:1708.04053 [7] ATLAS Collaboration, JINST11P11013 (2016) [8] ATLAS Collaboration, Phys. Lett.B 761158 (2016) [9] ATLAS Collaboration, Nucl. Phys.B 889486 (2014) [10] ATLAS Collaboration, ATL-TDR-024
![Figure 1. Distributions of centrally produced charged particles in ATLAS with transverse momentum pT greaterthan 100 MeV/c [2]](https://thumb-us.123doks.com/thumbv2/123dok_us/8041373.1338924/2.482.60.415.88.508/figure-distributions-centrally-produced-particles-transverse-momentum-greaterthan.webp)
![Figure 3. Schematic diagram of the azimuthal structure of QCD scattering events at the LHC [3].](https://thumb-us.123doks.com/thumbv2/123dok_us/8041373.1338924/3.482.160.318.291.487/figure-schematic-diagram-azimuthal-structure-qcd-scattering-events.webp)
![Figure 4. Normalised differential cross section of the leading charged particle in hadronic scattering events inATLAS, compared to a selection of MC models and tunes [3].](https://thumb-us.123doks.com/thumbv2/123dok_us/8041373.1338924/4.482.165.319.379.538/normalised-dierential-particle-hadronic-scattering-inatlas-compared-selection.webp)
![Figure 5. Distributions in the summedper unit pseudorapdity and azimuth, as functions of the pT and the number of charged tracks in the transverse azimuthal region, pT of the leading charged track in the event, for differentvalues of LHC collision energy [3].](https://thumb-us.123doks.com/thumbv2/123dok_us/8041373.1338924/5.482.73.414.286.452/distributions-summedper-pseudorapdity-functions-transverse-azimuthal-dierentvalues-collision.webp)
![Figure 9. Beam configuration in the region of the ATLAS detector showing the location of the ALFA sub-detectors [7].](https://thumb-us.123doks.com/thumbv2/123dok_us/8041373.1338924/8.482.47.432.327.490/figure-conguration-region-atlas-detector-showing-location-detectors.webp)
![Figure 9. Beam configuration in the region of the ATLAS detector showing the location of the ALFA sub-detectors [7].](https://thumb-us.123doks.com/thumbv2/123dok_us/8041373.1338924/9.482.54.425.82.280/figure-conguration-region-atlas-detector-showing-location-detectors.webp)
![Figure 12. Calculated fractional loss of energy of protons that undergo minimum-bias triggered events (red) andAFP-triggered events (black) [11].](https://thumb-us.123doks.com/thumbv2/123dok_us/8041373.1338924/10.482.143.333.80.218/figure-calculated-fractional-protons-undergo-minimum-triggered-triggered.webp)
