Comparitive Study of Uterine Cyst Characterisation
Using Glcm and Wavelet Transform
Brindha D1*,Kandaswamy A2, , Subbashini S 3
1
Assistant professor (Sr.Gr)Department of Biomedical Engineering, PSG College of Technology 2
Dean, Industrial Research and Development, PSG college of Technology 3
Student, Department of Biomedical Engineering, , PSG College of Technology, Coimbatore
Abstract— 50-75% of the women in their late 30-50 years suffer from uterine cysts, 30% of them are of reproductive age. Out of the different kinds of uterine cysts formed, misdiagnosis often happens between the conditions of adenomyosis and uterine fibroids. Though both the diseased conditions are found to have similar symptoms, the treatment offered to them differs thereby making it prominent in proper differentiation. Statistical features resulting in accurate characterization of the diseased conditions were identified. The features were extracted from both GLCM and wavelet transformed domain of the collected dataset of ultrasound images consisting of 25 uterinemyoma and 17 adenomyoma. The efficiency of the suggested statistical features in exact classification of the conditions was compared. The results show an efficacious uterine cyst characterization takes place in wavelet domain to the comparative study performed in spatial domain. Better classification of uterine fibroids and adenomyoma occurs in wavelet domain. With higher order of statistical features considered, still more accurate classification can be obtained in wavelet domain. Characteristic differentiation of the conditions of uterine fibroids and adenomyoma based on the features extracted from the ultrasound images makes it advantageous and simple method of uterine cyst identification compared to the current surgical procedures.
Keywords— Uterine cysts, adenomyosis, uterine fibroids, ultrasound images, GLCM,Wavelet transform.
I. INTRODUCTION
The uterus is a pear-sized, flexible organ capable of expanding to hold a baby consisting of a thick muscular wall and richly supplied blood vessels lining the central cavity. Women is said to shed their uterine lining every month during the time of menstruation which approximately counts 500 times in their lifetime. The menstrual cycle, being an involuntary action is being controlled by the hormones produced by the ovaries namely oestrogen and progesterone. The production of hormones is being controlled by the pituitary gland in the brain. It is often reported that most of the women suffer from menstrual problems leading to various inconveniences. One of the main reasons for menstrual problems is due to the imbalance of hormone productions by the ovaries resulting in common problems like heavy bleeding, menstrual pain, low back pain etc. The improper hormonal changes could also lead to critical conditions like the uterine prolapsed, formation of uterine fibroids, adenomyosis. Out of the different uterine problems, it is prominent to consider adenomyosis are often misdiagnosed as
uterine fibroids resulting in greater complications of the treatments proposed affecting the patients’ quality of life. The symptoms of these two diseases are found to be similar and hence they are often misdiagnosed.
Adenomyosis is a non-cancerous tissue growth of the uterus which resembles many signs of the uterine fibroids. Adenomyosis is defined as ectopic endometrial tissue located deep inside the myometrium marked by the breaking of inner lining cells directly through muscle wall of uterus. At the time of menstruation along with the lining uterine cells these misplace cells in the muscles also bleed causing pain as the bleeding happens directly into the muscle. Blood starts to accumulate creating irritation results in swelling of surrounding muscles forming fibrous tissues. This swollen area within the uterine wall is referred to as adenomyoma. Adenomyosis is located throughout the uterus or localized in one spot. Treatment process normally involves hysterectomy.
Uterine fibroids are masses of tissue grown in uterine wall. According to U.S. National Institutes of Health, 20-25% of women of reproductive age have fibroids. Uterine fibroids are common in the middle-aged women who are in their 40s. A fibroid can of any size varying from the size of a seed to that of a grapefruit. A fibroid can be present in any number and based on the location of occurrence fibroids are of different types. Generally, endometrial ablation is the treatment given to this condition.
One way to diagnose these conditions is to perform surgery and examine the tissue under microscope. But without surgery, imaging technologies helps to examine uterine fibroids and adenomyosis. Uterus is imaged with ultrasound imaging modality due to its advantages of cost effective and most available method. Some reasons to choose ultrasound as the imaging:
It is non invasive
It can be an outpatient procedure There is less risk of infections
II. MATERIALS AND METHODS
One of the steps in medical image processing involves texture classification and characterizing the tissue. Teresca Osicka in his work has used wavelet transform and extracted statistical features to classify malignant and benign tissue in lung nodules detection. Georgiou and Goldberg BB in their paper proposed a wavelet based decomposition algorithm to characterize normal and cancerous tissue in breast. Texture analysis helps to characterize the tissue. Arivazhagan and Ganesan proposed wavelet statistical features and co-occurrence features for texture classification of an image in their paper [1]. Texture analysis can be done by various methods. One of the methods is using the extracted statistical features. Usually lower order statistics, particularly first order and second order statistical features are exploited in texture analysis. First order statistics like mean, standard deviation and higher order moments of histograms deals with individual pixels of image. Second order statistics deals with co-occurrence of two pixels [2]. Grey level differences, auto correlation function and local binary pattern operator are second order statistical features. Higher order statistical features are investigated but with increase in order of statistics there is a corresponding increase in computational complexity. This paper considers first order and second order statistical features to classify and characterize the tissue.
The statistical features are extracted using GLCM and wavelet transformed domain from the set of 42 ultrasound images. Statistical features are extracted in frequency domain by using wavelet transform. Classification is performed using the features extracted, the results are compared and the best method is used for tissue characterization.
Wavelet analysis plays a vital role in image processing especially in pattern recognition. Wavelet transform is an improved version of Fourier transform. The wavelet transform involves analysis of non-stationary components in signal. In case of an image, wavelets are used to analyze the image both in spatial and frequency domain. Wavelets are used to extract information from many kinds of data such as audio and images. At the beginning of 20th century Haar, a German mathematician introduced the first wavelet transform which was named after him. Following which, there were many developments in wavelet transform that had many applications in signal and image processing. Wavelet transform provides better representation of images for feature extraction. In image processing, wavelets find more applications like image segmentation, image compression, image decomposition, image de-noising, and edge detection [3]
III.PROPOSED METHOD
The proposed method involves extraction of features from the spatial domain by performing direct pixel operations on images. Wavelet decomposition of an image involves transformation of images into frequency domain and extracting the statistical features from the frequency domain. From the features extracted, the characteristics of the images are described which helps in the classification
of uterine myoma and adenomyoma. The proposed method involves the following steps:
Fig.1 Flowchart of the proposed methodology
3.1 Preprocessing
The ultrasound images obtained from the database are preprocessed before performing any operations on images. The preprocessing of image includes conversion of image from RGB to grayscale followed by noise removal from the image. Ultrasound images are often prone to speckle noises which would affect the proper classification of diseased conditions. It is important to perform filtering of ultrasound images thereby removing the noises and reducing the error rate in the classification of the textures. 3.2 Region of interest
The region of interest (ROI) is a selected subset of the samples within a dataset considered for particular information. The regions where uterus is affected by adenomyosis or uterine fibroids alone are important in extracting the features. The affected region is selected and cropped using a fixed size rectangular function which is then moved over the entire cysts regions and cropped without leaving any portion of the cysts without
Start
Load the image
Preprocessing the image
Extracting region of interest
Feature extraction using GLCM
Classification
Adenomyoma Uterine fibroids
Transformed image
Feature extraction (WAVELET DOMAIN)
Classification
consideration. A dataset of 101uterine myoma and 73 adenomyoma are created from the 42 ultrasound images. The ultrasound images below shows the location of the cysts present in the uterus.
Fig.2 Ultrasound image of adenomyosis
Fig.3 Ultrasound image of uterine fibroids
3.3 Feature Extraction 3.3.1 Spatial domain
Statistical features were extracted from the selected ROI of the image in the spatial domain. Spatial domain images display a matrix in 2-D spatial plane which consists of gray-level intensities as its coefficients. Haralick et.al in his work has discussed about the features that could be extracted from an image in spatial domain from the GLCM matrix (Gray-Level Co-occurences Matrices) [4]. GLCM represents the distribution of occurrence of a pair of gray values separated by a linear length. Second order statistical features were extracted from the GLCM matrix after it is being normalized. Features like sum average, standard deviation, entropy, angular second moment, and variance were extracted from the dataset. Out of the 22 features extracted from the spatial domain, few features like mean, standard deviation and energy which gave best characteristic description of the images were considered and were used for the process of classification. The list of features extracted along with their definition has been given in the table below
TABLE 1
Selected features for classification in spatial domain
3.3.2 Wavelet Transform domain
Discrete wavelet transform (DWT) is one of the most widely used wavelet transforms for image processing. The region of interest from the image is chosen and wavelet transform is applied to decompose the image. DWT decomposes image into different sub-band images. From this decomposed image statistical features are extracted for classification [5]. These four sub bands are named as LH1, HL1, HH1 and LL1. The LH1, HL1, HH1 represents detailed coefficients and LL1 is approximation coefficient of the image. This results in first level of decomposition. The detailed image consists of diagonal, horizontal, vertical coefficients in it. The second level of decomposition is performed by further decomposing the approximation coefficient LL1 and labeled as LL2 [6]. Similarly, third level of decomposition is performed by decomposing LL2 approximation image and so on. For texture analysis, the detail and approximation coefficients of an image are helpful because they uniquely characterize the nature of the texture.
Fig.4 Levels of wavelet decomposition of an image
The statistical features are extracted from these detailed and approximation images. The first order statistical features such as mean, standard deviation are calculated for all detailed images in each level of decomposition. To improve the classification efficiency, second order statistical features like energy are extracted. The energy of approximation image is calculated for all three levels of decomposition. The detailed image and approximation image consists of transformed coefficients matrix in it. These matrices are used for calculating mean, standard deviation and energy. The list of features extracted along with their definition has been given in the table below
S.NO FEATURES
SELECTED DEFINITION
1. Sum Average
(mean)
(
)
2
2
i
ip
g
N
i
y x
2. Standard deviation
3. Angular second
moment (energy)
2
) , (
i j
j i p
LOCATION OF
ADENOMYOMA
LOCATION OF
UTERINE FIBROID
3rd level decompoLOCATIO
2nd level decomposition
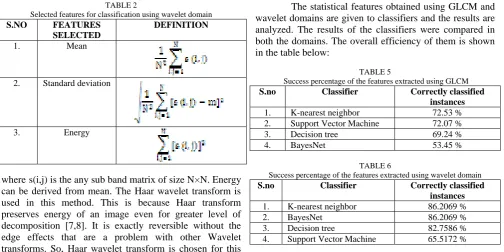
TABLE 2
Selected features for classification using wavelet domain S.NO FEATURES
SELECTED
DEFINITION
1. Mean
2. Standard deviation
3. Energy
wheres(i,j) is the any sub band matrix of size N×N. Energy can be derived from mean. The Haar wavelet transform is used in this method. This is because Haar transform preserves energy of an image even for greater level of decomposition [7,8]. It is exactly reversible without the edge effects that are a problem with other Wavelet transforms. So, Haar wavelet transform is chosen for this methodology [9,10].
IV.CLASSIFIER
The obtained statistical features are given to two or more classifiers and the efficiency of the features considered are analyzed. Classifiers like support vector machine, k-nearest neighbor classifier (kNN), decision tree classifiers are considered for the analysis[10]. These classifiers classify the adenomyosis and uterine fibroids found in an ultrasound image [10]. From the dataset consisting of 174 data 75% (131 data) of them are used for training the classifier 131and the remaining data are used to test the performance. Based on the results the best four of the various classifiers which gave good results have being tabulated.
TABLE 3
Performance of classifiers for the features extracted using GLCM
Table 4
Performance of classifiers for the features extracted using wavelet domain
V. RESULTS AND DISCUSSION
The statistical features obtained using GLCM and wavelet domains are given to classifiers and the results are analyzed. The results of the classifiers were compared in both the domains. The overall efficiency of them is shown in the table below:
TABLE 5
Success percentage of the features extracted using GLCM
S.no Classifier Correctly classified
instances
1. K-nearest neighbor 72.53 %
2. Support Vector Machine 72.07 %
3. Decision tree 69.24 %
4. BayesNet 53.45 %
TABLE 6
Success percentage of the features extracted using wavelet domain
S.no Classifier Correctly classified
instances
1. K-nearest neighbor 86.2069 %
2. BayesNet 86.2069 %
3. Decision tree 82.7586 %
4. Support Vector Machine 65.5172 %
From the results, texture classification performed in wavelet domain is found to be efficient compared to the classification using GLCM. Classification is usually done by extracting features from images. The higher the order of features extracted more accurate the classification. In this paper, few statistical features which perform an efficacious classification were selected and the performance of the features was compared in spatial and wavelet domain. Among the classifiers used k-nearest neighbor classifier gives success rate of 75.53% using GLCM and success rate of 86.209% in wavelet domain with a minimal false positive rate of 0.155 and with a highest accuracy of 0.862.
VI.CONCLUSION
The observed result shows that features extracted using wavelet domain gives better classification compared to GLCM. With higher order statistical features extracted from an image even more accurate results could be obtained in tissue characterization of uterine cysts.
REFERENCES
[1] S. Arivazhagan and L. Ganesan , 2003“Texture classification using wavelet transform”, Pattern Recognition letters,24, 9-10,1513–1521 .
[2] Namita Aggarwal and R. K. Agrawal, 2012 “First and Second Order Statistics Features for Classification of Magnetic Resonance Brain Images”, Journal of Signal and Information Processing, 3, 2,146-153.
[3] Bouden Toufikd and Nibouche Mokhtar, “Advances in wavelet theory and their applications in Engineering, Physics and technology, InTech.
[4] R. Haralick, K. Shanmugam, and I. Dinstein,1973 “Textural Features for Image Classification”, IEEE Trans. on Systems, Man and Cybernetics,3,6,610–621.
[5] Gagandeep Kour and Sharad P. Singh, 2013,” Image
Decomposition Using Wavelet Transform”, International Journal Of Engineering And Computer Science, 2, 12 ,3477-3480. [6] M. Sifuzzaman, M.R. Islam and M.Z. Ali, 2009, “Application of
Wavelet Transform and its Advantages Compared to Fourier Transform”, Journal of Physical Sciences, 13, 121-134 .
S.no Classifier TP
Rate FP Rate ROC Area
1. K-nearest
neighbor 0.728 0.385 0.77
2. Support Vector
Machine 0.723 0.396 0.720
3. Decision tree 0.693 0.354 0.66
4. BayesNet 0.525 0.255 0.537
S.no Classifier TP Rate FP Rate ROC Area
1. K-nearest
neighbor 0.862 0.155 0.788
2. BayesNet 0.862 0.155 0.757
3. Decision tree 0.828 0.183 0.827
4.
Support Vector Machine
[7] Mohamed I. Mahmoud, Moawad I. M. Dessouky, Salah Deyab, and Fatma H. Elfouly, 2007 “Comparison between Haar and Daubechies”, International Journal of Applied Engineering Research,1,2,133-137.
[8] Neha Goyal and Monika Aggarwal,2012 “Implementation of Image Compression using fast Wavelet Transform using HAAR and Daubechies Wavelets”, Journal of Engineering 2, 11,18-24.
[9] Sonam Malik and Vikram Verma,2012 “Comparative analysis of DCT, Haar and Daubechies Wavelet for Image Compression”, International Journal of Applied Engineering Research, 7,11.