Special Issue Article
In-Situ Coherent X-Ray Diffraction during
Three-Point Bending of a Au Nanowire: Visualization and
Quantification
Anton Davydok 1,2, Thomas W. Cornelius 1 , Zhe Ren 1, Cedric Leclere1, Gilbert A. Chahine3,4, Tobias Schuelli3, Florian Lauraux1, Gunther Richter5, O. Thomas1
1Aix Marseille Univ, Univ de Toulon, CNRS, IM2NP, Marseille, France; [email protected]; 2Helmholtz-Zentrum Geesthacht, Notkestr. 85,22607 Hamburg, Germany; [email protected] 3ID01/ESRF, 71 Avenue des Martyrs, CS40220, F-38043 Grenoble Cedex 9, France; [email protected] 4Univ. Grenoble Alpes, CNRS, Grenoble INP, SIMAP, 38000 Grenoble, France;
5Max Planck Institute for Intelligent Systems, Heisenbergstrasse 3, 70569 Stuttgart, Germany
* Correspondence: [email protected]; Tel.: +49 40 8998 6905
Abstract:
The three-point bending behavior of a single Au nanowire deformed with an atomic force microscope was monitored by coherent X-ray diffraction using a sub-micrometer sizedhard X-ray beam. While three-dimensional reciprocal-space maps were recorded before and after deformation by standard rocking curves, they were measured by scanning the energy of the incident
X-ray beam during deformation at different loading stages. The mechanical behavior of the nanowire is visualized in reciprocal space and a complex deformation mechanism is described. In addition to
the expected bending of the nanowire, torsion is detected. Bending and torsion angles are quantified from the high resolution diffraction data.
Keywords: synchrotron X-ray diffraction; nano-structures; nano mechanics
1. Introduction
In recent years, low-dimensional materials were intensively investigated revealing superior properties for nanostructures compared to their bulk counterparts. In particular quasi
one-dimensional objects such as nanowires and nanotubes are regarded as potential candidates for future sensors, optoelectronics, or nano-electromechanical systems [1-5]. For the development of reliable
future devices based on nanomaterials, knowledge and understanding of mechanical properties at the nanoscale are of paramount interest. Pioneered by Uchic et al. [6], mechanical tests on micro- and
nanostructures demonstrated increasing yield strengths with decreasing structure size reaching the ultimate limit of the material for defect scarce nanowires. This trend became known in literature as
“smaller is stronger”. More recently, in-situ experimental techniques were developed that are compatible with scanning and transmission electron microscopy or synchrotron X-ray diffraction techniques providing access to the evolution of the deformation during mechanical loading [7, 8, 9,
10, 11]. Such in-situ experiments demonstrated, for instance, pseudo-elastic behavior by reversible twinning/de-twinning of Au nanowires [12] and the activation of unexpected slips systems [13, 14].
Transmission electron microscopy allows for following the evolution of strain and defects inside the
specimen [15]. However, electron transparent samples are needed and the limited available space strongly restricts the sample environment for in-situ experiments.
These limitations do not necessarily apply for synchrotron-based X-ray diffraction techniques
thanks both to the comparatively large space at synchrotron beamlines and to the penetration of hard X-rays in matter. At 3rd generation synchrotron sources, Bragg coherent X-ray diffraction imaging
(BCDI) was developed which is a lens-less imaging technique giving access to the displacement field in a sample with an unprecedented accuracy of 1 pm [16, 17]. Besides BCDI, white beam Laue
microdiffraction was proven to provide invaluable information on the crystal orientation and rotation rendering possible the evaluation of the elastic and plastic deformation of a specimen without the
need for rocking the sample [18]. However, while the spatial resolution of Laue microdiffraction is essentially given by the beam size, BCDI provides spatial resolutions of the order of 10 nm.
Considering its distinct advantage it may seem surprising that very few in-situ experiments have been reported combining mechanical testing and coherent X-ray diffraction [19, 20]. This might be
partly due to the fact that BCDI requires the rocking of the sample in the order of one degree, which may induce vibrations that are detrimental during nano-mechanical tests. Cornelius et al. demonstrated 3D reciprocal space mapping of micrometric SiGe islands by scanning the energy of
the incident X-ray beam, thus avoiding any sample movements and possible vibrations during the data acquisition [21]. While BCDI data recorded by standard rocking scans are almost routinely
inverted into real space images, Cha et al. were the first demonstrating the inversion of Bragg coherent X-ray diffraction images recorded by the energy scanning technique [22].
In the present work, suspended Au nanowires were bent in a three-point bending configuration
using the custom-built scanning force microscope “SFINX” [23]. The deformation was monitored by
Bragg coherent X-ray diffraction employing the energy scanning approach [21]. The sub-micrometer sized beam illuminated the volume under the SFINX-tip as well as regions next to it, which are strongly affected by the applied force. The use of a two-dimensional photon-counting detector and
the energy scanning method allowed for measuring the three-dimensional intensity distribution in reciprocal space in the vicinity of the Au 111 Bragg peak. The mechanical behavior of the nanosized
gold crystal was inferred from lattice strain measurements demonstrating the plastic character of the deformation. The obtained results are in good agreement both with previous works on similar
nanowires and finite element calculations for quasi one-dimensional objects of the same size [24]. Moreover, the presented approach allows for following in detail the structural changes in the gold
nanocrystal during bending. This study does not attempt to invert the coherent diffraction data but rather emphasizes the experimental procedures and 3D visualization of the Au nanowire lattice
behavior under external mechanical load. It contributes to the understanding of the deformation mechanisms of nanoscale objects and lattice distortions at low forces.
2. Materials and Methods
Gold nanowires were grown by vapor phase deposition on carbon coated tungsten substrates under ultrahigh vacuum conditions [25]. For bending experiments, the as-grown nanowires were
transferred on a Si wafer that was patterned with micro-trenches. Some of the randomly distributed nanowires cross a micro-trench resulting in the formation of nano-bridges enabling mechanical tests in a three-point bending configuration. According to previous characterizations, the nanowires lie
suspended nanowires were glued at their contact points with the Si substrate by carbon deposition from the residual gas in a SEM chamber. The mechanical tests were performed using the custom built in-situ AFM “SFINX” which was installed at the upgraded ID01 beamline at the European
Synchrotron (ESRF) in Grenoble (France) where the incident 9 keV X-ray beam was focused down to 350 nm (V) x 700 nm (H) using a tungsten Fresnel zone plate. The coherent part of the incident beam
was selected by closing slits in front of the focusing optics to 300 µm (V) x 80 µm (H) matching the lateral coherence lengths at the upgraded beamline. The diffracted signal was recorded by a
two-dimensional MAXIPIX detector with a pixel size of 55 x 55 µm2, which was mounted 1260 mm
downstream from the sample position.
Prior to in-situ three-point bending tests, the SFINX-tip and the nanofocused X-ray beam were aligned with respect to a pre-selected Au nanowire by optical microscopy rendering a precision of
few micrometers followed by AFM imaging and scanning X-ray diffraction mapping using the K-mapping approach available at the ID01 beamline where the sample is continuously scanned through
the beam and the diffraction yield at a selected Bragg peak is monitored [10]. Ordinary three-dimensional reciprocal space maps (3D-RSMs) were recorded along the suspended part of the
nanowire in steps of 500 nm by rocking the sample by +/- 0.6°, thus covering 1.8 nm-1 along Qz.
For in-situ three-point bending tests the SFINX-tip was first positioned few micrometers above the center of the suspended Au nanowire and then lowered with a speed of 5 nm/s. Simultaneously,
2D coherent X-ray diffraction patterns were recorded with an exposure time of 1 s. Considering the time needed for the read-out of all detectors and motor positions and saving the data, a coherent 2D
X-ray diffraction pattern was stored every 4 s (corresponding to a movement of 20 nm of the SFINX-tip). At pre-defined loading steps, 3D reciprocal space maps of the deformed nanowire were recorded
by scanning the energy of the incident X-ray beam by +/- 100 eV. The covered Q-range is limited to 0.6 and 0.25 nm-1 in vertical and horizontal direction in reciprocal space, respectively, by the
chromaticity of the Fresnel zone plate and its focal depth [26].
3. Results
A scanning electron micrograph of a suspended Au nanowire is presented in Figure 1(a)
illustrating the experimental geometry with the contact point of the SFINX-tip marked by a cross and the direction of the incident X-ray beam indicated by an arrow. The corresponding scanning X-ray diffraction map recorded at the Au 111 Bragg peak is displayed in Figure 1(b). The positions along
the nanowire with lower diffraction intensity correlate with the positions where the nanowire crosses the Si ridges. The lack of diffraction intensity originates from a deformation of the Au nanowire at
Figure 1. (a) Scanning electron microscopy image of selected Au nanowire. (b) Scanning X-ray diffraction map of the sample recorded at the Au 111 Bragg peak. Three-dimensional iso-surface of the intensity distribution around the Au 111 Bragg peak of the gold nanowire recorded by rocking scan (c) before and (d) after the three-point bending test (sample detector distance has been changed).
A typical 3D-RSM of the Au 111 Bragg peak measured by ordinary rocking scans far from the
clamping points is shown in Figure 1(c). The Bragg reflection is located at Qz = 26.7 nm-1 containing
a large number of characteristic size oscillations from which the width and the thickness of the nanowire was inferred to be 155 and 57 nm, respectively. The good agreement of the experimental Qz value with the theoretical Au 111 Bragg position as well as the good visibility of the size
oscillations demonstrates the strain-free state of the suspended part of the nanowire. The fact that the 3D-RSM is very narrow in the third direction (along Qy) is caused by the length of the nanowire
which is much larger than the area illuminated by the X-ray beam.
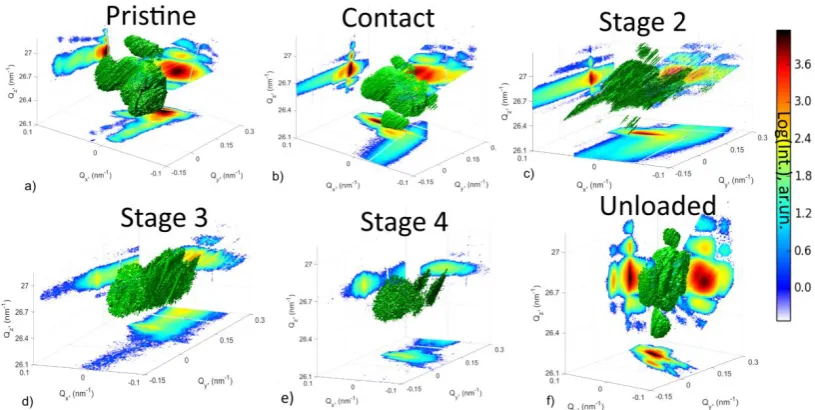
Three-dimensional iso-intensity surface representations at 73% of the maximum intensity of
3.7*104 cps together with two-dimensional cuts in the three different Q-directions of the same
nanowire at different states of deformation are displayed in Fig. 2. The results for the pristine
nanowire are shown in Figure 2(a). Due to the smaller Q-range covered by the energy scan compared to ordinary rocking scans, only the central peak together with the first size oscillations are observed. (see Figure 1.c/2.a and 1d/2.f respectively for the pristine nanowire and unloaded nanowire). The
slight differences observed when comparing reciprocal space maps calculated from rocking or energy scans may be attributed to an unavoidable slight offset in the measurement position along the
nanowire. Despite both this difference and the smaller Q-range covered by the E-scan, structural changes induced by mechanical deformations using the SFINX-tip are observable as will be
demonstrated in the following. When loading the nanowire with the SFINX-tip, the shape of the Bragg peak changes immediately after creating contact. The diffraction signal at smaller Qx values,
corresponding to about 20% of the total diffraction intensity, becomes elongated (Fig. 2(b)) and the volume fraction as well as the width increases further both in Qx and in Qy direction and it moves
along Qx with increasing load (Figure 2(c)). The Bragg peak eventually splits into an ellipsoidal and a broad diffuse peak where the latter moves along Qy with further load (Figure 2(d, e)). The broad peak probably originates from the fact that the X-ray beam probes a segment of few hundred
nanometers of the nanowire which exhibits both a continuum of bending angles and a comparatively large strain distribution at the loading point reaching from compressive to tensile strain. The sharper
and less intense Bragg peak is related to nanowire parts which are relatively far from the loading point and which are illuminated by the tails of the X-ray beam. These nanowire parts are not affected
Figure 2. Three-dimensional iso-surfaces of diffraction intensity at different loading stages during the in situ three-point bending test recorded using Energy scans.
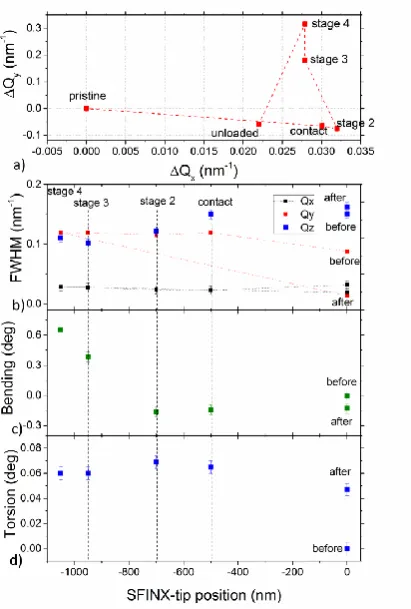
The peak center positions and the full width at half maximum (FWHM) of the Bragg peak were
evaluated by fitting the 2D cuts of the coherent 3D diffraction patterns shown in Figure 2 using a Gaussian. Since the Bragg peak moves exclusively in the Qx-Qy plane, the peak displacement is
evaluated at the same Qz for all deformation stages. The relative movements of the diffraction signals in reciprocal space are summarized in Fig. 3(a). When the SFINX-tip touches the nanowire, the Bragg
peak shifts by +0.032 and -0.06 nm-1 along Qx and Qy, respectively. With increasing load, it then
reverses its course along both Q-directions moving essentially along Qy. At highest load, the Bragg
peak is shifted by +0.028 nm-1 along Qx and +0.32 nm-1 along Qy with respect to its initial position.
After complete unloading, the diffuse Bragg peak does not return to its initial position and the shape
of the Bragg peak is different from the shape prior to the nano-mechanical test (see Figure 2(f)). It consists of more pronounced size oscillations which are also confirmed by a rocking scan performed after unloading (Figure 1(d)), thus demonstrating good agreement of the two techniques.
The FWHM of the diffraction peak, which is presented in Figure 3(b), was obtained by fitting the intensity distribution in reciprocal space by Gaussians in all three Q directions. The most
significant changes of the peak width are along Qy as well as along Qz while the variations along Qx are negligible as already observed in the three-dimensional representation of the Bragg peak in Figure
2 (a-f).
In the following, the changes observed in the in-situ 3D coherent X-ray diffraction patterns are
discussed with respect to the actual deformation of the nanowire including torsion and bending. While displacements of the Bragg peak along Qy originate mainly from an in-plane bending, movements along Qx are caused by nanowire torsion. The results are summarized in Figures 3(c) and
(d). Here, bending is the dominating deformation process reaching values of up to 0.7° at highest load. After unloading a residual upward bending of -0.15° remains which might originate from a
sticking of the SFINX-tip to the nanowire during retraction thus pulling the nanowire upwards. The aforementioned FWHM of the Bragg peak along Qy actually translates in a distribution of bending
angles in the illuminated nanowire part that increases to range of 0.25° at highest load and then diminishes to 0.14° after unloading. This bending gradient originates from the fact that the focused
the SFINX-tip and nanowire parts next to the contact point (according to beamsize). In addition to the bending, the nanowire is also twisted during the nano-mechanical test probably because of a slight misalignment of the SFINX-tip with respect to the center of the nanowire width, thus inducing
a torque [18]. The torsion is induced as soon as the SFINX-tip touches the nanowire and then stays rather constant during the loading process. However, the torsion is about one order of magnitude
smaller than the bending at highest load. After unloading the nanowire stays twisted by about 0.05°. The residual bending and torsion indicate that the nanowire was plastically deformed during the
three-point bending test. The comparatively small residual bending and torsion angles after unloading suggest that the nanowire was deformed just beyond its elastic limit. However, in the
volume probed by the focused coherent X-ray beam no indications of defects are apparent. Thus, the plasticity probably sets in at a different location along the nanowire, presumably close to the camping
positions, where the highest stresses are expected. The increase of the peak width along Qz by about
0.04 nm-1 compared to the pristine state suggests a strain gradient within the bent nanowire.
Considering that the pristine nanowire was free of strain gradients and taking into account the beam divergence of 0.018° the strain gradient at highest load is estimated to 0.18 % across the nanowire thickness of 57 nm.
Figure 3.(a) Displacement and (b) full width of half maximum of the Au 111 Bragg peak in reciprocal space during the in situ three-point bending test. (c) Bending and (d) torsion of the nanowire during the nano-mechanical test inferred from the displacement of the Au 111 Bragg peak shown in part (a).
4. Discussion
In previous works, we reported about in-situ three-point bending tests on Au nanowires
monitored by Laue microdiffraction which also revealed bending and torsion [24]. However, the
for coherent diffraction than for standard Laue diffraction where the sample-detector distance is one to two orders of magnitude smaller. This higher resolution in reciprocal space facilitates the detection of bending and torsion angles as small as 0.01° while for Laue microdiffraction the limit is typically
of the order of 0.1°. The additional use of energy scans instead of ordinary rocking scans avoid
possible vibrations induced by moving diffractometer motors that typically hamper in-situ
nano-mechanical tests in combination with coherent diffraction. Despite the limited energy scan range, due to the chromaticity of the used focusing optics, the main signal of the Bragg peak as well as the first
order of the size fringes are accessible, thus visualizing the three-dimensional deformation of the illuminated nanowire volume during the three-point bending test. This limited range in reciprocal
space, however, hindered the reconstruction of the real space image and strain field within the nanowire by phase retrieval algorithms. This clearly underlines the importance of achromatic
focusing optics, like KB mirrors, or an integration of energy dependent positioning for their chromatic counterparts as used in our study. With the development of these mandatory accessories, the rapidly
growing field of coherent diffraction imaging could integrate energy scanning Bragg coherent X-ray diffraction imaging (E-BCDI) as a routine tool for in situ mechanical testing.
5. Conclusions
In conclusion, in-situ three-point-bending tests on gold nanowires were monitored by coherent X-ray diffraction using sub-micrometer focused hard X-ray beams. The diffraction patterns provided
detailed structural information on a selected gold nanowire. Energy scanning has been employed to record three-dimensional reciprocal space maps at different stages of deformation. For reconstruction
of the whole picture of NW’s lattice behavior during bending 3D-reciprocal space maps are very helpful, considering the complexity of the mechanical test with lattice strain, torsion and bending.
Our approach is made possible thanks to the implementation of energy scanning. The present work constitutes a proof of feasibility. With a few technical improvements on the beamline side we expect it to become a routine technique for the study of the elastic and plastic behavior of individual
nanostructures.
Supplementary Materials: Figure S1: a) SEM image of the selected Au nanowire before the in-situ three-point bending test. b) Au 111 Bragg peak position recorded along the nanowire in steps of 1 µm. Reciprocal space maps recorded c) at the left-hand side Si support, d) at the center of the suspended Au nanowire, and e) at the right-hand side Si support.
Figure S2: SEM image of gold nanowire lying across Si trenches overlaid with the Au 311 Laue spot measured along the nanowire.
Author Contributions: investigation, Thomas Cornelius, Ren Zhe, Anton Davydok, , Cedric Leclere; formal analysis, Anton Davydok, Thomas Cornelius; writing—original draft preparation, Anton Davydok.; writing—
review and editing, Thomas W. Cornelius.; validation, Ren Zhe; methodology, Gilbert A. Chahine, Tobias Schülli; visualization, Florian Lauraux; resources, Gunther Richter; supervision, Olivier Thomas.
Acknowledgments: The authors are grateful to ESRF for allocating beamtime at the ID01 beamline. This work has been funded by the French National Research Agency through the project ANR-11-BS10-01401 MecaniX.
1. Gall Z., Zhong X., Schulman D., Kang M., Razavieh A., Mayer T., Titanium dioxide nanowire sensor array integration on CMOS platform using deterministic assembly Nanotechnology 2017 28 265501 DOI 10.1088/1361-6528/aa7456
2. Yao S., Myers A., Malhotra A., Lin F., Bozkurt A., Muth J., Zhu Y., A Wearable Hydration ensor with Conformal Nanowire Electrodes Adv. Healthcare Mater.2017 6 1601159 DOI 10.1002/adhm.201601159 3. Yan W., Qu Y., Das Gupta T., Darga A., Nguyên D., Page A., Rossi M., Ceriotti M., Sorin F., Semiconducting
Nanowire-Based Optoelectronic Fibers, Adv. Mater.201729, 1700681 DOI 10.1002/adma.201700681 4. Shainline J., Buckley S., Mirin R., Nam S., Phys Rev. App. 2017 7 034013 DOI
10.1103/PhysRevApplied.7.034013
5. Mercier de Lépinay L., Pigeau B., Besga B., Vincent P., Poncharal P., Arcizet O., A universal and ultrasensitive vectorial nanomechanical sensor for imaging 2D force field Nature Nanotechnology201712 156 DOI 10.1038/NANO.2016.193
6. Ulrich O., Biquard X., Bleuet P., Geaymond O., Gergaud P., Micha J. S., Robach O., Rieutord F., A new whitebeam X-ray microdiffraction setup on the BM32 beamline at the European Synchrotron Radiation Facility Rev. Sci. Instrum. 201182 033908 DOI 10.1063/1.3555068
7. Clark J., Ihli J., Schenk A., Kim Y., Kulak A., Campbell J., Nisbet G., Meldrum F., Robinson I., Three-dimensional imaging of dislocation propagation during crystal growth and dissolution, Nature Materials
201514 780 DOI 10.1038/nmat4320
8. Hintsala E., Kiener D., Jackson J., Gerberich W., In-situ measurements of free-standing, ultra-thin film crackingin bending Experimental Mechanics201555 1681 DOI 10.1007/s11340-015-0069-2
9. Zou Y., Wheeler J., Ma H., Okle P., Spolenak R., Nanocrystaline high-entropy alloys: a new paradigm in high-temperature strength and stability, Nano Lett. 201717 (3) 1569 DOI 10.1021/acs.nanolett6b04716 10. Chahine G.A., Zoellner M.H., Richard M.I., Guha S., Reich C., Zaumseil P., Capellini G., Schroeder T.,
Schülli T.U., Strain and lattice oreintation distribution in SiN/Ge complementary metal-oxide-semiconductor compatible light emitting microstructures by quick x-ray nano-diffraction microscopy Appl. Phys. Lett. 2015106 071902 DOI 10.1063/1.4909529
11. Cornelius T.W., Thomas O., Progress of in-situ synchrotron X-ray diffraction studies on the mechanical behavior of materials at small scale, Progress in Materials Science 2018 94 384 DOI 10.1016/j.pmatsci.2018.01.004
12. Lee S., Im J., Yoo Y., Bitzek E., Kiener D., Richter G., Kim B., Oh S.H., Reversible cyclic deformation mechanism of gold nanowires by twinning-detwinning transition evidenced from in-situ TEM, Nature Comm. 20145 3033 DOI 10.1038/ncomms4033
13. Maaß R., Van Petegem S., Ma D., Zimmermann J., Grolimund D., Roters F., Van Swygenhoven H., Raabe D., Smaller is stronger: the effect of strain hardening, Acta Materialia 2009 57 20 5996 DOI 10.1016/j.actamat.2009.08.024
14. Ren Z., Cornelius T. W., Leclere C., Davydok A., Micha J-Se, Robach O., Richter G., Thomas O. Three-point bending behavior of a Au nanowire studied bu in-situ Laue micro-diffraction Acta Materialia2018submitted 15. Bouscaud D., Morawiec A., Pesci R., Berveiller S., Patoor E. Strain resolution of scanning electron
microscopy based Kossel microdiffraction J. Appl. Cryst. 201447 1699 DOI 10.1107/S1600576714019402 16. Oku T. Direct analysis of advanced nanomaterials by high-resolution electron microscopy Nanotechnology
Reviews2012 1, 5, 389 DOI 10.1515/ntrev-2012-0018
17. Biermanns A., Breuer S., Trampert A., Davydok A., Geelhaar L., Pietsch U., Strain accomodation in Ga-assisted GaAs nanowires grown on silicon (111) Nanotechnology 23 2012 305703 DOI 10.1088/0957-4484/23/30/305703
18. Labat S., Richard M.-I., Dupraz M., Gailhanou M., Beutier G., Verdier M., Mastropietro F., Cornelius T.W., Schülli T.U., Eymery J., Thomas O. Inversion domain boundaries in GaN wires revealed by coherent bragg imaging, ACS Nano20159 9210 DOI 10.1021/acsnano.5b03857
19. Dupraz M., Beutier G., Cornelius T.W., Parry G., Ren Z., Labat S., Richard M.-I., Chahine G.A., Kovalenko O., M. De Boissieu, E. Rabkin, M. Verdier, Thomas O. , 3D imaging of a dislocation loop at the onset of plasticity in an indented nanocrystal Nano Lett. 201717 (11), 6696 DOI 10.1021/acs.nanolett.7b02680 20. Shin J., Cornelius T. W., Labat S., Lauraux F., Richard M.-I., Richter G., Blanchard N., Gianola D.C.,
21. Cornelius T.W., Davydok A., Jacques V.L.R., Grifone R., Schülli T., Richard M.-I., Beutier G., Verdier M., Metzger T.H., Pietsch U., Thomas O. I-situ three-dimensional reciprocal-space mapping during mechanical deformation J. Synchrotron Radiat.201219 688 DOI 10.1107/S0909049512023758
22. Cha W., Ulvestad A., Allain M., Chamard V., Harder R., Leake S.J., Maser J., Fuoss P.H., Hruszekewycz S.O. Three dimensional variable-wavelength X-ray bragg coherent diffraction imaging Phys. Rev. Lett.2016
117 225501 DOI 10.1103/PhysRevLett.117.225501
23. Ren Z., Mastropietro F., Langlais S., Davydok A., Richard M.-I., Thomas O., Dupraz M., Verdier M., Beutier G., Boesecke P., Cornelius T.W., J. Synchrotron Radiat. 21, 1128 (2014)
24. Leclere C., Cornelius T.W., Ren Z., Davydok A., Micha J.-S., Robach O., Richter G., Belliard L., Thomas O. In-situ bending of an Au nanowire monitored by micro Laue diffraction J. Appl. Cryst. 201548 291 DOI 10.1107/S1600576715001107
25. Richter G., Hillerich K., Gianola D. S., Mönig R., Kraft O., Volkert C. A. Ultrahigh strength single crystalline nanowhiskers grown by physical vapor deposition Nano Lett. 20099 3048 DOI 10.1021/nl9015107 26. Mastropietro F., Carbone D., Diaz A., Eymery J., Sentenac A., Metzger T. H., Chamard V., Favre-Nicolin
V. Coheren X-ray wavefront reconstruction of a partially illuminated Fresnel zone plate Opt. Express2011