ISSN: 2574 -1241
A Universal ECG Signal Classification System
Using the Wavelet Transform
DOI: 10.26717/BJSTR.2020.26.004426
Khaled Daqrouq*
1, Abdulhameed Alkhateeb
1, Waleed Ahmad
2, Emad Khalaf
1, Ali Rushdi
1,
Mohamed Awad
1and Elmar Noeth
31Electrical and Computer Engineering Department, King Abdulaziz University, Saudi Arabia 2University of the Poonch Rawalakot, Rawalakot, Poonch, Azad Jjammu & Kashmir, Pakistan 3Lehrstuhl fuer Informatik 5 (Mustererkennung), Germany
*Corresponding author: Khaled Daqrouq, Electrical and Computer Engineering Department, King Abdulaziz University, Jeddah 21589, Saudi Arabia
Introduction
Electrocardiography (ECG or EKG) is a commonly used noninvasive cardiological methodology for testing the existence of disorders in the human heart work, which is revealed by electrodes placed on the skin of the patient. The idea behind the ECG that is to record the electrical signal that originates from the heart’s muscle. The outcome of this methodology is called the electrocardiogram, which is an illustration of the electrical activity of the heart, graphing the voltage signal magnitudes over time [1]. Electrocardiography plays a fundamental role in analyzing various heart diseases
including Myocardial Infarction, Ischemia, Heart Attack, as well as related blockages in arteries and veins. The reason behind that is that any heart arrhythmia presents a particular deformation in the muscle of the heart that causes the sequence of its electrical impulses to experience certain deviations from the standard or normal, which in turn are manifested and illustrated on the ECG [2].
The diagnosis of a specific type of heart disease is a somewhat challenging task and differs from person to person. A particular source of difficulty is that a normal or healthy ECG is different for Received: March 16, 2020
Published: April 06, 2020
Citation: Khaled Daqrouq, Abdulhameed Alkhateeb, Waleed Ahmad, Emad Khalaf, Ali Rushdi, et al. A Universal ECG Signal Classification System Using the Wavelet Transform. Biomed J Sci & Tech Res 26(5)-2020. BJSTR. MS.ID.004426.
Abbreviations: ECG: Electrocardiograph, DWT: Discrete Wavelet Transforms, WPT: Wavelet Packet Transform, FFT: Fast Fourier Transform, PNN: Probabilistic Neural Network, NSR: Normal Sinus Rhythm, TC: Tachycardia, SDB: Second Degree Block, VB: Ventricular Bigeminy, APC: Atrial Premature Complex, PAC: Premature Atrial Contraction, AV: Atrial-Ventricular
ARTICLE INFO Abstract
The Electrocardiograph (ECG) is one of the most successful medical diagnostic tools. The ECG can show, roughly speaking, all types of heart disorders that appear as ECG signal arrhythmias. In this paper, a universal ECG signal arrhythmias classification system is proposed. The proposed system is based on using the wavelet transform in two of its known forms, namely, the Discrete Wavelet Transforms (DWT) and the Wavelet Packet Transform (WPT), or a combination thereof. The purpose of the research reported herein is to find out a universal classification system; in the sense of providing a capability for simultaneous classification of all types of known heart arrhythmias. Three algorithms based on the wavelet transform are tested for different wavelet levels, wavelet functions, training and testing ratios, and elapsed times. We rank these algorithms according to the elapsed times needed for their processing over the whole loop of the eight different arrhythmia classes. This ranking nominates the WPT-based algorithm to be the most superior method among the competing methods. A different ranking according to successful recognition rates assigns priority to the combined WPT and DWT method instead.
different persons. As a result, diagnosing a specific disease may vary for every individual. Furthermore, in a non-normal ECG, two distinct diseases may have almost the same manifestations [2]. To overcome these obstacles, researchers must think deep and hard of a universal pattern recognition technique. This technique should work regardless of the similarity that occurs in some places in the ECG waves with different electrical heart disorders [2-5]. Many ECG arrhythmias may appear as a special pattern called the QRS complex. Therefore, many research ideas start from analyzing the QRS complex [6]. One of the techniques that attracted many researchers depends on using various variationss of the wavelet transform, and utilizing several kinds of wavelets, including the Haar wavelet [7,8], the Mexican hat wavelet [9,10], and a combination of different wavelet functions [11]. The authors in [12] presented a wavelet QRS complex detection algorithm based on an ECG signal contaminated with noise, which is comparable to the algorithms given in [13,14]. Another work in [13] introduced the use of the Haar discrete wavelet transform for arrhythmia detection. A Classification of seven heartbeat cases (normal beat, bundle branch ectopic beat, supraventricular ectopic beat, normal, and ventricular ectopic beat) was investigated by the Morlet Wavelet function and the Probabilistic Neural Network (PNN) [14].
The classification rate was up to 100% for a single arrhythmia but decreased for multiple arrhythmias. The QRS complex was classified by the Haar wavelet and the Self Organizing Map method, which produced improved results in comparison to the Fast Fourier Transform (FFT) and cross-correlation methods [15]. In [16], the authors proposed a wavelet transform and energy based method for atrial fibrillation detection. In this paper, we introduce and investigate a new universal pattern recognition technique. For this purpose, we develop three different methods of varying levels of sophistication. We employ the probabilistic neural network (PNN) as a classifier. The paper is structured as follows. The first section is the present introduction, followed by Section 2 on the employed methodology and Section 3 on the testing datasets. Section 4 presents the results obtained accompanied by some discussion. Section 5 concludes the paper.
Method
In the last 20 years, researchers investigated many methods for ECG arrhythmia classification. However, the published works reported only certain specific arrhythmia types. A universal classification method that is suitable for detecting all kinds of arrhythmia is immensely needed. With this purpose in mind, we present three methods, each employing the concept of the wavelet percentage energy, earlier introduced in [16], for modeling almost all types of the known ECG signal clinical features. To calculate the percentage of energy E for the qth WT sub-signal uq(t), the following equation is reproduced from [16]
( )
100
Nn1(
q( )
)
2/
E S
=
∗
∑
=u t
N
(1)
N=SUM(C2) (2)
where S is the signal and C is the wavelet decomposition vector [16]. For the sake of investigation, the following three methods are studied:0020
Percentage energy of the wavelet packet (PEWP): In this method, we extract the features by calculating the percentage of energy for the qth sub-signal u
q(t), of the WP tree, where the length of the feature vector is dependent on the WP tree depth. Therefore, the decomposition wavelet packet level has an immense effect on the classification system performance. The resulting values are used as a feature vector for classification.
Percentage energy of the discrete wavelet transform (PEDW): In this method, we calculate the DWT sub-signals for a certain wavelet function for a given depth. The percentage of energy is calculated for several equal frames for each DWT sub-signals, after calculating the average value for each sub-signals. The resulting values are used as a feature vector for classification.
Percentage energy of WP of the second level of the DWT (2SPED): In this method, we calculate the second approximation sub-signal of the DWT. For the calculated DWT sub signal, we determine the percentage energy of the WP decomposed from the DWT sub-signal. The length of the feature vector is dependent on the chosen level of the WP tree. The resulting values are used as a feature vector for classification.
Despite the fact that we might currently find several improved versions of the probabilistic neural network (PNN) that can be either more reasonable or have noticeably better performance than the original version, we adopt the original PNN as a classifier for simplicity of exposition. The construction of the used algorithm is as follows:
Net
=
[
T SP I
, ,
]
(3)where T is the target, SP is the spread, and I is the input feature matrix that contains the training features vectors as its columns as follows:
11 12 1
21 22 2
1 2 . . . . . . . . . Tr Tr NTr I = … … …
N N
where Tr is the training vectors’ number and T is the target class vector:
P=[1,2,…,Tr] (5)
Testing Dataset
To test the proposed methods, a dataset of an ECG signal of specific disorders was prepared. Nine ECG arrhythmias were extracted from the MIT-BIH Arrhythmia Database, which is a set of Holter’s long-term recordings conducted between 1975 and 1979 [17,18]. The MIT-BIH Arrhythmia Database consists of a randomly-chosen sample of 23 ECG records (labeled by non-consecutive numbers from 100 to 124), supplemented by 25 ECG records (labeled by non-consecutive numbers from 200 to 234) selected to include less common but clinically significant arrhythmias that
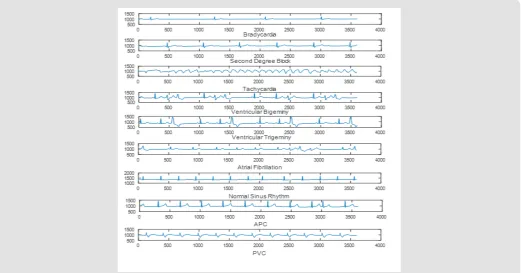
would not be well-represented in a small random sample. The records are slightly over 30 minutes long and are digitized at a 360-Hz sampling frequency. The subjects were 25 men and 22 women with the men aged 32 to 89 years, and the women aged 23 to 89 years. The testing extracted signals were 10 seconds long, taken from nine ECG arrhythmias. The nine arrhythmia types are shown in Figure 1. Each type of signal was extracted from several records as seen in Table 1. The first arrhythmia is Bradycardia (Br), which is the case of an ECG signal that contains long R-R intervals. In other words, the Br signal is a slow ECG signal with the Heart Rate (HR) less than 60 Beats/min. The Br signal occurs during sleep or because of heart weakness. The second type is the Second Degree Block (SDB), which occurs when the cardiac conduction system of atrial impulse through the Atrial-Ventricular (AV) node and the bundle of His is blocked or delayed.
Figure 1:The nine ECG arrhythmia patterns contained in the testing database taken from the MIT-BIH Database.gn
Table 1: The list of the nine classes contained in the testing database and the selected records of the MIT-BIH Database.
Type Record
sinus bradycardia 232
20 heart block 231
Ventricular tachycardia 106,200,203,205,210,213.214,215,217,221,223,233
Ventricular trigemini 106,119,124,201,208,214,221,233
Ventricular bigeminy 106,119,200,207,213,217,223,228
Atrial fibrillation 201,202,203,210,217,219,221,222
Normal Sinus Rhythm 100, 103
APC 100,101,108,113,118,124,200,201,202,223,220,213
Patients with the SDB disease may be asymptomatic, lightheadedness and syncope. The third arrhythmia illustrated in Figure 1 is Tachycardia (Tc), which is the ECG arrhythmia of a very fast heart rate that reaches more than 100 beats/min. Mainly, Tc may occur in some typical cases like in fear and during exercise. But in some clinical cases, Tc could be very life threating, mostly if left without treatment. The fourth one is Ventricular Bigeminy (VB), which occurs when every normal beat is followed by a ventricular premature beat. The fifth one is Ventricular Trigemini (VT), which happens when two normal beats are followed by one ventricular premature beat. The sixth heart arrhythmia is the Atrial Fibrillation (AF) that occurs when the heart’s electrical signal produces a quick contraction of the upper chambers. In this case, the P wave may not appear. The AF arrhythmia may lead to stroke, and in some cases, may cause heart failure. The seventh one is the Normal Sinus Rhythm (NSR). The eighth and ninth cases are Atrial Premature Complex (APC) and Premature Atrial Contraction (PAC) that occur when one region in the atria makes a premature beat before the sinoatrial node. On the ECG signal with a PAC arrhythmia, the T waves and the QRS complexes are seen as very different from normal readings.
Results and Discussion
In this section, we investigate the performance of the three proposed methods over the ECG signal dataset by testing a big number of arrhythmias. Before starting our analysis, one question arises: What is the motivation behind tackling this massive number of arrhythmia classes, not only one as often happens in research. In fact, the answer to this question points out to the essence of our contribution and motivation behind such sophisticated classification set-up. One of the most critical objectives here is to find out a general and a universal algorithm for almost all ECG arrhythmia classification. The investigation system will consist of several experiments for investigation of the proposed algorithms over the testing dataset. The study will analyze the recognition rate as evidence about the wavelet function, WT level, training/testing ratio, and the method consuming time. We investigate the proposed methods by comparing their performance as measured by each of these parameters. For testing the proposed methods by the testing dataset, we run the three methods eight times, such that at each time; a different number of arrhythmias is involved. In fact, the performance of the methods is determined for 2, 3, 4, 5, 6 ,7 ,8, and 9 classes of arrhythmia types separately, as is seen in (Table 2).
Table 2: Recognition rates [%] for PEWP versus different wavelet functions.
Wav. Fun. Db1 Db2 Db3 Db4 Db5 Db6 Db7 Db10
No. Classes
2 100 100 100 100 100 100 100 100
3 93.33 93.33 90 96.66 100 96.66 96.66 93.33
4 87.5 87.5 85 90 92.5 90 87.5 85
5 80 80 74 76 80 78 72 74
6 63.33 63.33 56.66 65 66.66 68.33 56.66 70
7 68.57 68.57 62.85 70 71.42 71.42 60 74.28
8 62.5 62.5 55 62.5 63.75 61.25 53.75 63.75
9 58.88 58.88 56.66 63.33 63.33 58.88 53.33 62.22
Average 76.7638 76.7638 72.5212 77.9363 79.7075 78.0675 72.4875 77.8225
At the beginning of our analysis, we used the PEWP method (WP at level 8) as a reference to determine an appropriate wavelet function and wavelet level. In Table 2, we present the results of the PEWP performance for different Daubechies wavelet functions. By studying the results tabulated in the table, we can notice that Daubechies function type Db5 has the best results compared with other functions, with an average recognition rate that reaches 79.70%. One observation is very critical here, namely, that the recognition rate of seven arrhythmias is 71.42%, which is a high number indeed attesting to the success of our current investigation. For evaluating the PEWP performance versus different WP levels, we run the system eight times according to a different number of
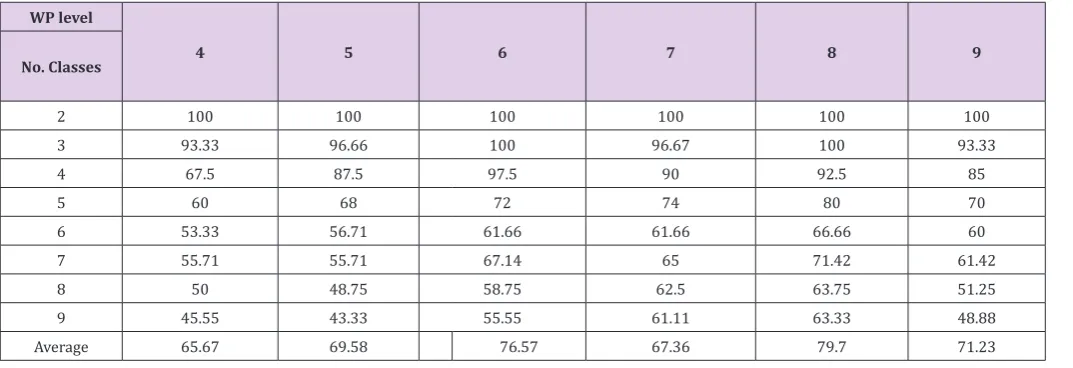
Table 3: Recognition rates for PEWP versus different wavelet levels.
WP level
4 5 6 7 8 9
No. Classes
2 100 100 100 100 100 100
3 93.33 96.66 100 96.67 100 93.33
4 67.5 87.5 97.5 90 92.5 85
5 60 68 72 74 80 70
6 53.33 56.71 61.66 61.66 66.66 60
7 55.71 55.71 67.14 65 71.42 61.42
8 50 48.75 58.75 62.5 63.75 51.25
9 45.55 43.33 55.55 61.11 63.33 48.88
Average 65.67 69.58 76.57 67.36 79.7 71.23
The average for the 25/5 Training/Testing ratio is 90.39%, and the recognition rate for nine arrhythmias is 72.5%. In fact, these results are auspicious and favorable. However, the 2SPED method is immensely competing with PEWD, where the average for the 25/5 Training/Testing ratio is 88.94%, and the recognition rate for nine arrhythmias is 72.5%. By contrast, the PEWP method has corresponding values of only 79.16% and 50%, respectively. The
elapsed time calculated for the processing of the PEWP, PEWD, and 2SPED method over the whole loop of the eight different arrhythmia classes shown in Table 4 is investigated in Table 5. We can see that the PEWP method has the best result, while PEWD comes second, and 2SPED ranks third. The reason behind this order is the difference in the level of sophistication for the three methods.
Table 4: Recognition rates for PEWP, PEWD, and 2SPED versus different Training/Testing ratios.
Training/Testin
5/25 15/15 20/10 25/5
No. Classes
PEWP PEDW 2SPED PEWP PEDW 2SPED PEWP PEDW 2SPED PEWP PEDW 2SPED
2 96 51.72 93.1 100 80 96.66 100 100 100 100 100 100
3 84 41.37 65.51 97.77 86.66 93.33 96.66 100 100 100 100 100
4 76 39.65 60.34 86.66 80 88.33 87.5 90 97.5 85 95 100
5 64.8 38.62 46.89 70.66 57.33 69.33 68 70 65 80 92 84
7 53.71 39.4 40.39 56.19 59.04 65.71 55.71 70 70 60 82.85 77.14
9 45 32.75 34.48 50.83 51.66 62.5 48.75 62.5 65 50 72.5 72.5
Average 69.91 40.58 56.78 76.1 69.11 79.31 75.04 82.08 82.91 79.16 90.39 88.94
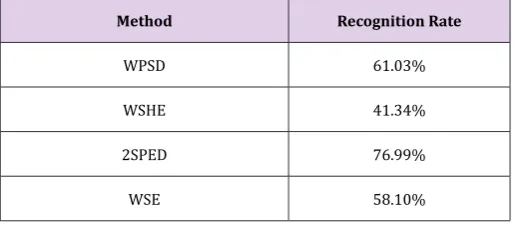
The average for the PEWP method over the three Training/ Testing ratios shown in Table 4 is 75.05%, for the PEWD method is 70.48%, and for the 2SPED method is 76.99%. Table 5 shows the elapsed time in seconds calculated for the processing of PEWP, PEWD, and 2SPED over the whole loop of the eight different arrhythmia classes shown in Table 3. The results in the table nominate the PEWP method to be the superior method among the three used methods in terms of the consuming time. In fact, the 2SPED method has better results in term of recognition rate with an average that reached 76.99%. In Table 6, we compare our proposed method 2SPED to other published methods based on the wavelet transforms , such as the method of the average power spectrum density of DWT (WPSD) [19], the method of Shannon entropy with
a wavelet packet (WSHE) [20], the method of log energy entropy with a wavelet packet (WLEE) [21] and the method of sure entropy with a wavelet packet (WSE) [22-28]. An average recognition rate of 76.99% is achieved by our 2SPED method, whereas the best of its copeting methods in Table 6 (WPSD) reached only an average recognition rate of 61.03%.
Table 5: Elapsed time calculated for the processing of PEWP, PEWD, and 2SPED over the whole loop of the eight different arrhythmia classes number shown in Table 3.
Method PEWP PEDW 2SPED
Table 6: Results of recognition rates for comparison
Method Recognition Rate
WPSD 61.03%
WSHE 41.34%
2SPED 76.99%
WSE 58.10%
Conclusion
In this study, a universal recognition system has been proposed for ECG signal arrhythmia recognition. The challenging task of the present system is to test the possibility to distinguish between a big number of different types of arrhythmias at the same time, which is increased herein to reach the ultimate number of nine. Unlike traditionally known methods that can be used for the classification of one or two types of arrhythmias ony, the proposed study inves-tigates the classification of nine different types of heart disorders with relatively good results. Three wavelets transform based meth-ods have been investigated by conducting different experimenting concepts such as, the wavelet functions, the wavelet level, the Train-ing/Testing systems, and the elapsed time. The results showed that these three methods can distinguish between the nine arrhythmias in a good recognition rate on the average. The average for the PEWP method over the three Training/Testing systems was 75.05%, for the PEWD method is 70.48%, and for the 2SPED is 76.99%. The elapsed time in seconds calculated for the processing of PEWP, PEWD, and 2SPED over the whole loop of the eight different ar-rhythmia classes nominates the PEWP method to be the superior method among the three methods in terms of time-consuming. On the other hand, the 2SPED method has better results in terms of the recognition rate.
C
onflict of Interest
The authors declare that there is no conflict of interest regarding the publication of this paper.
Acknowledgment
The paper is funded by the Deanship of Scientific Research (DSR) of King Abdulaziz University (KAU). For this, the authors are greatly indebted and sincerely grateful.
References
1. (2016) The MIT-BIH Atrial Fibrillation Database.
2. Moody GB, Mark RG (1983) A new method for detecting atrial fibrillation
using R-R intervals. Computers in Cardiology 10: 227-230. 3. (2016) Wikipedia, The Free Encyclopedia.
4. (1999) The MIT-BIH Normal Sinus Rhythm Database. 5. (1990) The MIT-BIH Supraventricular Arrhythmia Database.
6. Köhler BU, Hennig C, Orglmeister R (2002) The principles of software QRS detection. IEEE Eng Med Biol 21: 42-57.
7. Gutiérrez A, Lara M, Hernandez PR (2005) QRS detector based on Haar wavelet, evaluation with MIT-BIH arrhythmia and European ST-T Databases. Comp Syst (4): 293-302.
8. Kaneko M, Gotho T, Iseri F, Takeshida NK (2011) QRS complex analysis using wavelet transform and two layered self-organizing maps. Comput Cardiol 38: 813-816.
9. Addison PS (2005) Wavelet transforms and the ECG: a review. Physiol Meas 26: R155-R199.
10. Burke MJ, Nasor M (2002) The time relationships of the constituent components of the human electrocardiogram. J Med Eng Technol 26: 1-6. 11. Hamilton PS, Tompkin WJ (1986) Quantitative investigation of QRS
detection rules using the MIT/BIH arrhythmia database, IEEE Trans. Bio-Med Eng BME 33: 1157-1165.
12. Kadambe S, Murray R, Boudreaux-Bartels GF (1999) Wavelet transform-based QRS complex detector. IEEE Trans Biomed Eng 46(7): 838-848. 13. Jaswal G, Parmar R, Kaul A (2012) QRS detection using wavelet
transform. Int J Eng Adv Tech 1: 5.
14. CH Lin, YC Du, Chen T (2008) Adaptive wavelet network for multiple cardiac arrhythmias recognition. Expert Syst Appl 34(4): 2601-2611. 15. Takeshida H, Ohki N, Sueda (2011) QRS complex analysis using wavelet
transform and two layered self-organizing map. Comput. Cardiol 38: 813-816.
16. Daqrouq K, Alkhateeb A, Ajour MN, Morfeq A (2014) Neural network
and wavelet average framing percentage energy for atrial fibrillation classification. Elsevier Computer Methods and Programs in Biomedicine
113(3): 919-926.
17. Goldberger AL, Amaral LAN, Glass L, Hausdorff JM, Ivanov PCh, et al. (2000) Components of a New Research Resource for Complex Physiologic Signals. PhysioBank, PhysioToolkit, and PhysioNet 101(23): 215-220.
18. Khorammi H, Moavanian M (2010) A comparative study of DWT, CWT
and DCT transformation in ECG arrhythmias classification. Expert
Systems with Applications 37(8): 5751-5757.
19. Kara S, Okandan M (2007) Atrial fibrillation classification with artificial
neural networks. Pattern Recognition 40(11): 2967-2973.
20. Daqrouq K (2007) Wavelet entropy and neural network for
text-independent speaker identification. Engineering Applications of Artificial Intelligence 24(5): 796-802.
21. Qiao S, Zhou P (2007) Wavelet and wavelet packet transform analysis in the ECG signals of Atrial Fibrillation Complex Medical Engineering. 22. Avci D (2009) An expert system for speaker identification using adaptive
wavelet sure entropy. Expert Systems with Applications 36: 6295-6300. 23. Erol H (1989) Electrocardiography. Ankara University Press pp. 89. 24. (1999) The MIT-BIH Normal Sinus Rhythm Database.
25. (1990) The MIT-BIH Supraventricular Arrhythmia Database.
26. Schuck A, Wisbeck JO (2003) QRS detector pre-processing using the complex wavelet transform. in: Proceedings of the 25th Annual
International Conference of the IEEE Engineering in Medicine and Biology Society 13: 2590–2593.
27. CI Ieong, PI Mak, Lam C, Dong A (2012) 0.83-W QRS detection processor using quadratic spline wavelet transform for wireless ECG Acquisition in 0.35-m CMOS. IEEE Trans. Biomed. Circuits Syst 6: 586-595.
Submission Link: https://biomedres.us/submit-manuscript.php
Assets of Publishing with us
• Global archiving of articles
• Immediate, unrestricted online access • Rigorous Peer Review Process • Authors Retain Copyrights • Unique DOI for all articles
https://biomedres.us/ This work is licensed under Creative
Commons Attribution 4.0 License
ISSN: 2574-1241
DOI:10.26717/BJSTR.2020.26.004426
![Table 2: Recognition rates [%] for PEWP versus different wavelet functions.](https://thumb-us.123doks.com/thumbv2/123dok_us/7855922.1302931/4.595.35.566.391.578/table-recognition-rates-pewp-versus-different-wavelet-functions.webp)