_____________________________________________________________________________________________________
*Corresponding author: E-mail: [email protected];
www.sciencedomain.org
Effect of Age and Gender Variation in Normal
Pituitary Gland Height Using Magnetic Resonance
Imaging
Abubaker E. Mohieldin
1, Duha A. Mohamed
1, Mustafa Z. Mahmoud
2*,
Maram A. Fagiri
2and Ahmed Abukonna
11
Department of Diagnostic Radiologic Technology, College of Medical Radiological Sciences, Sudan University of Science and Technology, Khartoum, Sudan.
2Department of Radiology and Medical Imaging, College of Applied Medical Sciences,
Prince Sattam bin Abdulaziz University, Al-Kharj, Saudi Arabia.
Authors’ contributions
This work was carried out in collaboration between all authors. Authors AEM and DAM designed the study. Author MZM wrote the protocol, performed the analysis and wrote the first draft of the manuscript. Authors AEM, MAF and AA made subsequent revisions. Authors MZM and MAF managed the online and google scholar literature searches. All authors read and approved the final manuscript.
Article Information
DOI: 10.9734/BJMMR/2016/29162 Editor(s): (1) Franciszek Burdan, Experimental Teratology Unit, Human Anatomy Department, Medical University of Lublin, Poland and Radiology Department, St. John’s Cancer Center, Poland. (2)Claudia Borza, “Victor Babes” University of Medicine and Pharmacy, Department of Pathophysiology, Romania. (3)Francesco Angelico, Professor, Department of Public Health and Infectious Diseases, Sapienza University Medical School, Rome, Italy. Reviewers: (1) Arturo Solís Herrera, Human Photosynthesis Study Center, Mexico. (2)Teodoro Cordova-Fraga, Universidad de Guanajuato, Mexico. Complete Peer review History:http://www.sciencedomain.org/review-history/16658
Received 26th August 2016 Accepted 19th October 2016 Published 25th October 2016
ABSTRACT
Aims: The aim of this study was to analyze the age and sex related changes in pituitary gland
height in a selected population from Sudan, and also to compare findings with those of other authors.
Study Design: This prospective study included 50 participants (25 males and 25 females; ages range between 2-65 years) underwent brain magnetic resonance imaging (MRI) examination. Place and Duration of Study: This study was conducted in different MRI centers in Khartoum, Sudan between March 2016 and August 2016.
Methodology: In order to measure pituitary gland height, MRI T1 weighted sagittal images were obtained using General Electric (GE) Signa HDe 1.5 T MRI system. The unpaired t-test was used for the statistical significance, P-value ≤ 0.0001 considered significant. Statistical analysis was performed using the standard Statistical Package for the Social Sciences (SPSS Inc., Chicago, IL, USA) version 20 for windows.
Results: The mean value of pituitary gland height in the sample was (5.4±1 mm). Mean pituitary gland height of females (5.65±1.21 mm) was greater than that of males (5.13±0.69 mm). A significant correlation was noted between pituitary gland height in both sexes during age ranges 11-21 years, 22-32 years, 33-43 years, and 44-54 years respectively. A gradual decrease in the height was noted to start in the mid of the fifth decade of life in both sexes.
Conclusion: A reference value of normal pituitary gland height was obtained in Sudanese population. The height of the gland was greater in females. There was a gradual increase in height of the gland with age.
Keywords: Pituitary gland; prospective study; height; magnetic resonance imaging.
1. INTRODUCTION
With the recent advancement, magnetic resonance imaging (MRI) has become the modality of choice for visualizing the intracranial structures like sellar and the parasellar region [1]. MRI presently supersedes computed tomography (CT) and plain radiographs in the investigation of the sella, parasellar, and suprasellar regions [2]. It provides high resolution images, unlike CT scan and conventional radiographs, it does not use any harmful ionizing radiations. Hence, MRI is considered safe for human study because there is no known adverse effect of the strong magnetic field and the radio waves [3]. They are also extremely useful because of the wealth of information contained in the signal regarding both structural properties of the tissue and its bio-chemistry [4].
The pituitary gland controls other glands and secretes important hormones. Evaluation of pituitary size and its shape are the most important factors in the diagnosis of its pathology. However, dynamic changes have been reported on the size, shape and signal intensity of the pituitary on MRI in different age groups, which reflects the changes in the complex hormonal environment of this gland. These changes were more significant in females [5]. The maximum height of the pituitary gland was reported during the second and third decade of life, this can be explained by rapid hormonal changes at puberty [6-8]. The MRI coronal image of the pituitary gland considers the best single view for imaging the pituitary gland, while the sagittal image best assesses the relationship of the midline structures [9]. In addition, the midsagittal height of the pituitary gland reflects the variations in the pituitary morphology more
accurately [10,11]. Reliable height of the pituitary gland varies, wherein children it was 6 mm,
puberty about 10 mm, young adult male was 8 mm and in female was 9 mm respectively,
while in pregnancy it was found to be 12 mm [12].
As a fact, the normative value of pituitary gland height is not available for the population of Sudan. This study was designed to analyze the age and sex related changes in pituitary gland height in a selected population from Sudan, and also to compare such findings with those of other authors.
2. MATERIALS AND METHODS
2.1 Study Population
2.2 MRI Examination Protocol
All participants were examined on General Electric (GE) Signa HDe 1.5 T MRI system using appropriate head coil. MR Console was loaded with GE Centricity Dicom viewer version 2.2 software. Midsagittal T1 weighted spin-echo sequences with 40-95 ms echo time, 550-3850 ms repetition time, 24 cm field of view, 5 mm slice thickness, and 5 mm slice gap, were constructed on a 512×256 matrix. T1 sagittal images that visualize the cerebral aqueduct and pituitary gland were taken for the measuring of pituitary gland height [7,13]. Pituitary height was measured as the greatest distance between the base and the top of the gland by using electronic calipers provided with GE Centricity Dicom viewer software. Obtained values were measured in millimeters (mm).
2.3 Statistical Analysis
Data were initially summarized as a mean±standard deviation (SD) in a form of comparison tables and graphs. The unpaired t -test was used for the statistical significance, where the P-value ≤ 0.0001 was considered significant. Statistical analysis was performed using the standard Statistical Package for the Social Sciences (SPSS Inc., Chicago, IL, USA) version 20 for windows.
3. RESULTS
In this prospective study a total of 50 (25 males and 25 females) consecutive and healthy participants were recruited. The mean age±SD was 31±18.5 years (age ranges from 2 up to 65 years). Mean age of male participants was 31±17.3 years while for females the mean age was 31±19.9 years. The data stratified into six groups on the basis of age and gender of participants. Also, no statistically significant differences were observed among participants mean ages (Table 1).
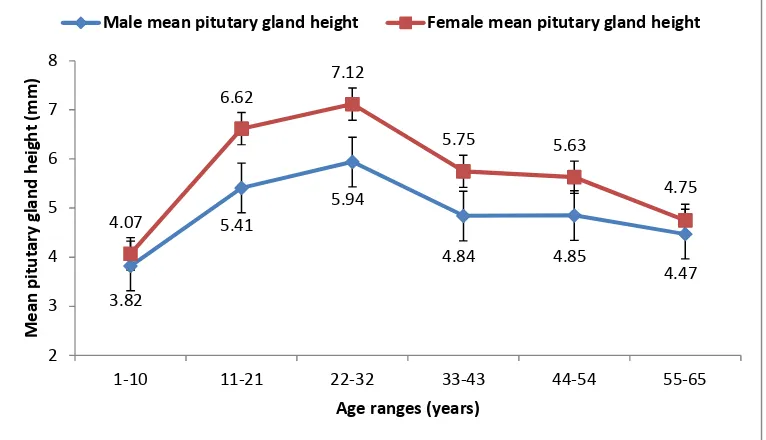
The mean pituitary height was respectively (5.13±0.69 mm) and (5.65±1.21 mm) in males and females participants (Table 2). In males, age groups 1-10 years, 11-21 years, 22-32 years, 33-43 years, 44-54 years, and 55-65 years, the mean pituitary height was (3.82±0.13 mm, 5.41±0.61 mm, 5.94±0.07 mm, 4.84±0.03 mm, 4.85±0.01 mm, and 4.47±0.00 mm) for each. While pituitary height in females was (4.07±0.54 mm, 6.62±0.16 mm, 7.12±0.63 mm, 5.75±0.56 mm, 5.63±0.63 mm, 4.75±0.17 mm) for the same age groups (Table 2 and Fig. 1). Standard error (SE) of 0.31 and 0.51 was detected for both male and female pituitary gland height respectively (Fig. 1).
Table 1. Distribution of participants age and sex in the sample
Age ranges (years)
Incidence of males age
Males mean age
(years)±SD
Incidence of females age
Females mean age (years)±SD
P-value t
1-10 2 3±1.4 5 5±2.7 0.3820* 0.9582
11-21 6 15±3.1 4 17±1.3 0.2636* 1.2024
22-32 6 25±1.1 5 27±3.2 0.1823* 1.4452
33-43 4 38±2.1 3 37±2.0 0.5531* 0.6354
44-54 5 48±2.1 4 48±3.4 1.0000* 0.0000
55-65 2 63±2.1 4 62±2.7 0.6757* 0.4505
Total 25 31±17.3 25 31±19.9 1.0000* 0.0000
* Not statistically significant
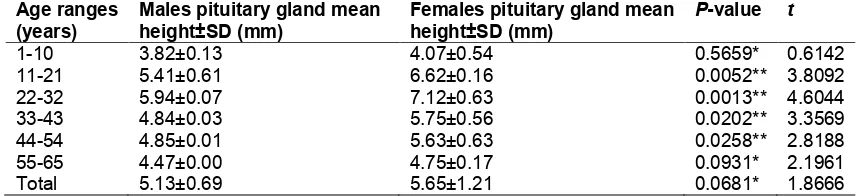
Table 2. Distribution of pituitary gland mean height±SD (mm) by age and sex among participants
Age ranges (years)
Males pituitary gland mean height±SD (mm)
Females pituitary gland mean height±SD (mm)
P-value t
1-10 3.82±0.13 4.07±0.54 0.5659* 0.6142
11-21 5.41±0.61 6.62±0.16 0.0052** 3.8092
22-32 5.94±0.07 7.12±0.63 0.0013** 4.6044
33-43 4.84±0.03 5.75±0.56 0.0202** 3.3569
44-54 4.85±0.01 5.63±0.63 0.0258** 2.8188
55-65 4.47±0.00 4.75±0.17 0.0931* 2.1961
Total 5.13±0.69 5.65±1.21 0.0681* 1.8666
The pituitary height in female subjects (5.65±1.21 mm) was greater than that in male subjects (5.13±0.69 mm), but there is no significant difference found between these two measurements (P = 0.0681, and t = 1.8666) as presented in (Table 2). A significant correlation was noted between male (5.41±0.61 mm, 5.94±0.07 mm, 4.84±0.03 mm, and 4.85±0.01 mm) and female (6.62±0.16 mm, 7.12±0.63 mm, 5.75±0.56 mm, and 5.63±0.63 mm) pituitary gland height in the age ranges of 11-21 years, 22-32 years, 33-43 years, and 44-54 years respectively. Where P-values and t were (0.0052; 3.8092, 0.0013; 4.6044, 0.0202; 3.3569, and 0.0258; 2.8188) for each (Table 2).
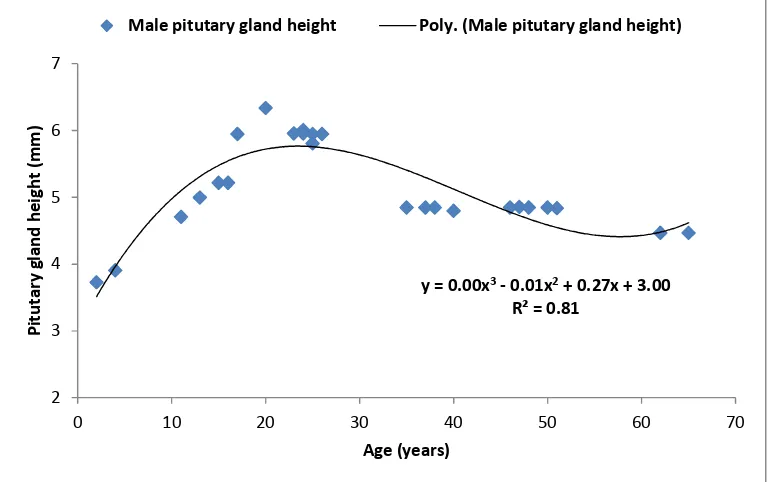
A regression equation between pituitary gland height and age was found in male participants and could be expressed as: [y = 0.00x3 - 0.01x2 + 0.27x + 3.00], where [y] refers to the pituitary gland height (mm) and [x] refers to males age (years) as depicted in Fig. 2. From this polynomial trendline an R-squared value of [R2 = 0.81] was detected.
In contrast, another polynomial trendline shows a regression equation between pituitary gland height and age of female participants, and could be expressed as: [y= 0.00x3 - 0.01x2 + 0.39x + 2.62], where [y] refers to the pituitary gland height (mm) and [x] refers to females age (years) as presented in Fig. 3. Also an R-squared value of [R2 = 0.84] was detected.
4. DISCUSSION
There is a recognized need for more normative data on pituitary gland height in the general population. Midsagittal height of the pituitary gland reflects the variations in the pituitary morphology more accurately [1,11]. In this study, the authors reported MRI data on measured pituitary height in healthy Sudanese participants. It was found that the mean pituitary height was (5.4±1 mm) which was comparable to other studies [13,14]. Measurements in these studies rely on linear parameters, and since the pituitary gland develops dynamically in puberty a more accurate method of measurement may be required to differentiate the normal from the abnormal pituitary gland. Table 3 below presents our current findings in comparing to historical data obtained from previous studies.
Kiortsis et al. 2004 [15] and Hayakawa et al. 1989 [16] had described the normal appearance of the pituitary gland in the first two years of life. Where the height of the pituitary gland decreases in the first two months of life and then gradually increases till adolescence. A rapid decrease in the secretion of growth hormone (GH) and prolactin (PRL) is thought to be responsible for this phenomenon. In the present study, the mean pituitary height in the age group 1-10 year was found (4±0.5 mm for the whole sample, 3.82±0.13 mm in males, and 4.07±0.54 mm in females) as presented in Table 2. This was in
Fig. 1. Distribution of pituitary height according to participant age and gender in the sample
3.82
5.41
5.94
4.84 4.85
4.47 4.07
6.62
7.12
5.75 5.63
4.75
2 3 4 5 6 7 8
1-10 11-21 22-32 33-43 44-54 55-65
M
ea
n
p
it
u
ta
ry
g
la
n
d
h
e
ig
h
t
(m
m
)
Age ranges (years)
agreement with the values provided by Suzuki et al. 1990 [17] and Elster et al. 1991 [18]. After the first decade of life, Suzuki et al. 1990 [17] and Elster et al. 1991 [18] had reported a
significantly higher gland size in females, which was in agreement with the findings of this study (Table 2 and Fig. 1).
Fig. 2. Correlation of pituitary height (mm) and age (years) in male participants
Fig. 3. Correlation of pituitary height (mm) and age (years) in female participants
y = 0.00x3- 0.01x2+ 0.27x + 3.00
R² = 0.81
2 3 4 5 6 7
0 10 20 30 40 50 60 70
P
it
u
ta
ry
g
la
n
d
h
ei
gh
t
(m
m
)
Age (years)
Male pitutary gland height Poly. (Male pitutary gland height)
y = 0.00x3- 0.01x2+ 0.39x + 2.62
R² = 0.84
2 3 4 5 6 7 8
0 10 20 30 40 50 60 70
P
it
u
ta
ry
g
la
n
d
h
e
ig
h
t
(m
m
)
Age (years)
Table 3. Current study males and females, mean pituitary gland height±SD (mm) in comparison to previous studies findings
Males mean pituitary gland mean
height±SD (mm); current study
Males mean pituitary gland mean height±SD (mm); Tsunoda et al. 1997 [19]
Males mean
pituitary gland mean height±SD (mm); Denk et al. 1999 [7]
Males mean pituitary gland mean
height±SD (mm); Ibinaiye et al. 2015 [14]
5.13±0.69 4.93±1.0 5.6±0.2 6.45±1.7
Females mean pituitary gland mean height±SD (mm); current study
Females mean pituitary gland mean height±SD (mm); Tsunoda et al. 1997 [19]
Females mean pituitary gland mean height±SD (mm); Denk et al. 1999 [7]
Females mean pituitary gland mean height±SD (mm); Ibinaiye et al. 2015 [14]
5.65±1.21 5.35±1.2 5.7±0.2 6.46±1.57
Pituitary gland reflects changes in the intricate hormonal milieu of the gland at different phases of life. Denk et al. 1999 [13] and Ikram et al. 2008 [7] confirmed that these changes are significantly different between sexes, with larger glands found in females. The results of the current study
support that females have larger glands rather than males (Table 2, Figs. 1 and 3). Also
the results were statistically significant in the age
group 11-21 years; P = 0.0052, 22-32 years;
P = 0.0013, 33-43 years; P = 0.0202, and 44-54 years; P = 0.0258 (Table 2). Thus, pituitary gland height could be measured depending upon two correlation equations, which were obtained regarding the participant age and gender as distributed in the study, where [y = 0.00x3 - 0.01x2 + 0.27x + 3.00] and [y= 0.00x3 - 0.01x2 + 0.39x + 2.62] for male and females respectively (Figs. 2 and 3). Both males and females in the current research, attained the
peak pituitary height in the second decade of life (22-32 years) as presented in Table 2 and
Fig. 1. Such finding was confirmed by Ikrm et al. 2008 [7], where they explained that peak height
is a determinant factor for the development of puberty and this was achieved in females 5 years earlier than in their male counterparts. They believed that this fact could
be responsible for early achievement of maximal height in females. Study results revealed also another peak in pituitary height in individuals in
the middle fifth decade (55 years) and the middle of the six decade (65 years) of life, which was also greater for females (Table 2,
Fig. 1). This finding could be explained on the basis of increased activity triggered as a negative feedback mechanism by the waning hormonal levels in the target organs [17,19].
Despite the lower number of participants recruited in this study (n = 50), but the findings of this study were similar to other studies conducted about the effects of age and sex in pituitary gland height using MRI in different populations. In addition, the basic cranial diameters and their effects upon pituitary height wasn’t assessed, and the uniquely delineates different age groups might be considered as limitations.
5. CONCLUSION
In conclusion, data provided reference values for the pituitary gland height in different age groups, which is an important parameter for the evaluation of pituitary gland disorders. A reference value for the normal pituitary gland height was obtained in a Sudanese population, but it should be considered that the height of the gland is larger in females rather than males. In addition, pituitary height showed a significant correlation in both sexes among ages that extended from the second to fifth decade of life.
CONSENT
All authors declare that written informed consent was obtained from the patient (or other approved parties) for publication of this paper and accompanying images.
ETHICAL APPROVAL
COMPETING INTERESTS
Authors have declared that no competing interests exist.
REFERENCES
1. Growth Hormone Research Society. Consensus guidelines for the diagnosis and treatment of Growth Hormone (GH) deficiency in childhood and adolescence: Summary statement of the GH Research Society. GH Research Society. J Clin Endocrinol Metab. 2000;85(11):3990-3993. Available:http://dx.doi.org/10.1210/jcem.85 .11.6984
2. Bozzola M, Adamsbaum C, Biscaldi I, Zecca M, Cisternino M, Genovese E, et al. Role of magnetic resonance imaging in the diagnosis and prognosis of growth hormone deficiency. Clin Endocrinol (Oxf). 1996;45(1):21-26.
Available:http://dx.doi.org/10.1046/j.1365-2265.1996.7570773.x
3. Zrazhevskiy P, Sena M, Gao X. Designing multifunctional quantum dots for bioimaging, detection, and drug delivery. Chemical Soc Rev. 2010;39(11):4326-4354.
Available:http://dx.doi.org/10.1039/b91513 9g
4. Gunderman RB. Essential Radiology: Clinical Presentation, Pathophysiology, Imaging, 2nd ed. New York: Thieme; 2006. 5. Lehn JM. Toward self-organization and
complex matter. Science. 2002;295(5564): 2400-2403.
Available:http://dx.doi.org/10.1126/science. 1071063
6. Kato K, Saeki N, Yamaura A. Morphological changes on MR imaging of the normal pituitary gland related to age and sex: Main emphasis on pubescent females. J Clin Neurosci. 2002;9(1):53-56. Available:http://dx.doi.org/10.1054/jocn.20 01.0973
7. Denk CC, Onderoğlu S, Ilgi S, Gürcan F. Height of normal pituitary gland on MRI: Differences between age groups and sexes. Okajimas Folia Anat Jpn. 1999; 76(2-3):81-87.
Available:http://dx.doi.org/10.2535/ofaj193 6.76.2-3_81
8. Argyropoulou MI, Kiortsis DN, Metafratzi Z, Efremidis SC. Magnetisation transfer imaging of the normal adenohypophysis: The effect of sex and age. Neuroradiology. 2001;43(4):305-308.
Available:http://dx.doi.org/10.1007/s00234 0000417
9. Forbes K, Karis J, White WL. Imaging of the pituitary gland. Barrow Quarterly. 2002;18(3):9-19.
10. Lurie SN, Doraiswamy PM, Husain MM,
Boyko OB, Ellinwood EH Jr, Figiel GS, et al. In vivo assessment of pituitary gland
volume with magnetic resonance imaging: The effect of age. J Clin Endocrinol Metab. 1990;71(2):505-508.
Available:http://dx.doi.org/10.1210/jcem-71-2-505
11. Doraiswamy PM, Potts JM, Axelson DA, Husain MM, Lurie SN, Na C, et al. MR assessment of pituitary gland morphology in healthy volunteers: Age- and gender-related differences. AJNR Am J Neurodiol. 1992;13(5):1295-1299.
12. Janssen YJ, Doornbos J, Roelfsema F. Changes in muscle volume, strength, and bioenergetics during recombinant human growth hormone (GH) therapy in adults with GH deficiency 1. J Clin Endocrino Metab. 1999;84(1):279-284.
Available:http://dx.doi.org/10.1210/jc.84.1. 279
13. Ikram MF, Sajjad Z, Shokh I, Omair A. Pituitary height on magnetic resonance imaging observation of age and sex related changes. J Pak Med Assoc. 2008;58(5): 261-265.
14. Ibinaiye PO, Olarinoye-Akorede S, Kajogbola O, Bakari AG. Magnetic resonance imaging determination of normal pituitary gland dimensions in Zaria, Northwest Nigerian population. J Clin Imaging Sci. 2015;5:29.
Available:http://dx.doi.org/10.4103/2156-7514.157853
15. Kiortsis D, Xydis V, Drougia AG, Argyropoulou PI, Andronikou S, Efremidis SC, et al. The height of the pituitary in preterm infants during the first 2 years of life: An MRI study. Neuroradiology. 2004; 46(3):224-226.
Available:http://dx.doi.org/10.1007/s00234-003-1126-6
16. Hayakawa K, Konishi Y, Matsuda T, Kuriyama M, Konishi K, Yamashita K, et al. Development and aging of brain midline structures: Assessment with MR imaging. Radiology. 1989;172(1):171-177.
Available:http://dx.doi.org/10.1148/radiolog y.172.1.2740500
during pregnancy and post partum: Measurement with MR imaging. Radiology. 1991;181(2):531-535.
Available:http://dx.doi.org/10.1148/radiolog y.181.2.1924800
18. Suzuki M, Takashima T, Kadoya M,
Konishi H, Kameyama T, Yoshikawa J, et al. Height of normal pituitary gland on MR imaging: Age and sex differentiation. J
Comput Assist Tomogr. 1990;14(1):36-39. Available:http://dx.doi.org/10.1097/000047 28-199001000-00006
19. Tsunoda A, Okuda O, Sato K. MR height of the pituitary gland as a function of age and sex: Especially physiological hypertrophy in adolescence and in climacterium. AJNR Am J Neuroradiol. 1997;18(3):551-554.
_________________________________________________________________________________ © 2016 Mohieldin et al.; This is an Open Access article distributed under the terms of the Creative Commons Attribution License (http://creativecommons.org/licenses/by/4.0), which permits unrestricted use, distribution, and reproduction in any medium, provided the original work is properly cited.
Peer-review history: