Objective: The present paper describes a simple, accurate, and precise reversed-phase high-performance liquid chromatography (HPLC) method for rapid and simultaneous quantification of netupitant (NTP) and palonosetron (PLS) in bulk and pharmaceutical dosage form.
Methods: The chromatographic separation was achieved on Luna C18 (250 mm × 4.6 mm, 5 µ). Mobile phase contained a mixture of 0.1% orthophosphoric acid and acetonitrile in the ratio of 60:40 v/v, flow rate 1.0 ml/min, and ultraviolet detection at 222 nm.
Results: The proposed method shows a good linearity in the concentration range of 60–900 µg/ml for NTP and 0.1–1.5 µg/ml for PLS under optimized conditions. All the precision and recovery results are in between 98 and 102%. In the entire robustness conditions, percentage of relative standard deviation is <2.0%. Degradation has minimum effect in stress condition and solutions are stable up to 24 h. This method is validated different parameters such as precision, linearity, accuracy, limit of detection, limit of quantification, ruggedness, robustness, and forced degradation study were determined according to the International Conference of Harmonization (ICH) Q2B guidelines.
Conclusion: All the parameters of validation were found to be within the acceptance range of ICH guidelines. Since there is no HPLC method reported in the literature for the estimation of NTP and PLS in pharmaceutical dosage forms, there is a need to develop quantitative methods under different conditions to achieve improvement in sensitivity, selectivity, etc. Hence, the author has attempted to develop a validation and forced degradation for simultaneous quantification of NTP and PLS.
Keywords: Reversed-phase-high-performance liquid chromatography, Netupitant, Palonosetron.
INTRODUCTION
Netupitant (NTP) is a novel antiemetic [1,2] drug in the combination of NTP/palonosetron (PLS). It is used to the prevention of acute and delayed chemotherapy-induced nausea and vomiting [3], including highly emetogenic [4] chemotherapy [5] such as with cisplatin [6]. 5-hydroxytryptamine (5-HT3) receptors [7] are located on the nerve terminals [8] of the vagus [9] in the periphery and centrally in the chemoreceptor [10] trigger zone of the area postrema [11]. It is thought that chemotherapeutic agents produce nausea and vomiting by releasing serotonin [12] then activate 5-HT3 receptors located on vagal afferents [13] to initiate the vomiting reflex.
The review of literature revealed that several analytical methods have been reported for NTP and PLS in spectrophotometry, high-performance liquid chromatography (HPLC), high-high-performance thin-layer chromatography [14-22] individually, and in the combination. To date, there are no reports for stability-indicating simultaneous estimation and forced degradation study of NTP and PLS.
METHODS Instrumentation
The analysis was performed on Water Alliance e-2695 chromatographic system equipped with a quaternary pump and photodiode array detector (PDA)-2996. Chromatographic software empower-2.0 was used for data collection.
Chemicals and reagents
Acetonitrile (HPLC grade), orthophosphoric acid (OPA) (HPLC grade), and Water (HPLC grade) were purchased from Merck (India) Ltd., Worli, Mumbai, India. Active pharmaceutical ingredients (APIs) of NTP and PLS reference standards were produced from Supriya Lifescience, Mumbai, India.
Chromatographic conditions
Chromatographic analysis was done using isocratic elution, mobile phase in the ratio of acetonitrile:buffer (0.1% OPA) (40:60 v/v) was filtered through 0.45 µ membrane filter paper. The flow rate of the mobile phase was monitored at 1.0 ml/min and eluents were detected at 222 nm. By injecting the volume 10 µl with a run time 10 min.
Selection of wavelength
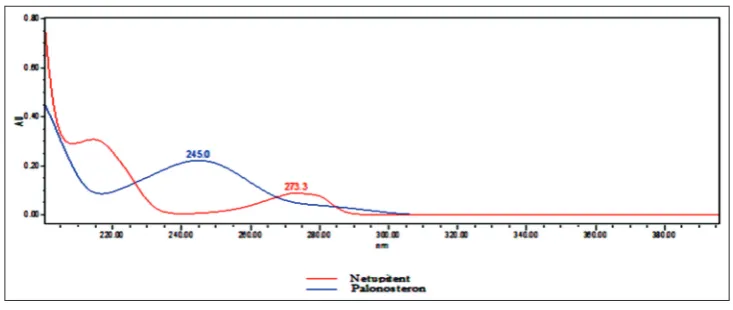
Using PDA detector, the absorption spectra of the solution of two drugs are scanned in the ultraviolet region of 200–400 nm spectra shown in Fig. 1,
the spectra of the NTP and PLS shown at different λmax,namely 245.0 and
273.3 nm, respectively. By overlay of the two spectra combined at 222 nm was selected as detection wavelength for HPLC chromatographic method.
Preparation of standard solution
600 mg of NTP working standard taken into a 100 ml volumetric flask. Add 70 ml of mobile phase sonicated for 20 min to dissolve makeup to the mark with mobile phase.
mark with mobile phase. Further, dilute 1 ml of above solution to 50 ml with mobile phase.
Further, diluted each 5 ml of above two solutions to 50 ml with mobile phase.
Preparation of sample solution
Weigh 20 tablets and take the one tablet equivalent weight. Crush the 20 tablets into powder form, take 640 mg of sample into a 100 ml volumetric flask, and add 70 ml mobile phase sonicated for 30 min after that make up to the mark with mobile phase.
Validation
System suitability
As per the test method, the standard solutions were prepared and injected into HPLC system from which the evaluated system suitability parameters are found to be within the limits.
Linearity
The ability of the method to produce results those are directly or indirectly proportional to the concentration of the analyst in samples within the limits.
Precision
The degree of the closeness of agreement among individual test results when a method is applied to multiple samplings of a homogeneous sample. It is a measure of either the degree of reproducibility (agreement under different conditions) or repeatability (agreement under the same conditions) of the method.
Accuracy
The closeness of results was obtained by a method to the true value. It is a measure of the exactness of the method.
Limit of detection (LOD) and limit of quantification (LOQ)
The LOD and LOQ for each analyte were determined based on a signal-to-noise concept, as the lowest concentration at which signal-signal-to-noise ratio between 3 or 2:1 and 10:1, respectively, with defined precision and accuracy under the given experimental conditions.
Stability
Standard and the sample solutions were subjected to 24 h stability studies at room temperature and 2–8°C. The stability of these solutions was studied and observed for changes in the area and retention time of the peaks which were then compared with the pattern of the chromatogram of the freshly prepared solution.
Robustness
Robustness of the method was studied by slightly changes in experimental conditions such as flow rate and organic composition. Robustness on performed same instrument different chromatographic conditions.
Ruggedness
Ruggedness of the method was studied using different source of analyst, instruments, and columns with same experimental conditions.
RESULTS AND DISCUSSION Method validation
In this method, system suitability, linearity, precision, accuracy, robustness, LOD, LOQ, forced degradation, and stability are validated for the selected NTP and PLS drugs.
System suitability
600 µg/ml of NTP and 1.0 µg/ml of PLS was prepared and injected into system. The retention times of NTP and PLS were found to be 3.025 and 7.163 min, respectively. Resolution of the PLS was 11.28 from the NTP. The number of theoretical plate counts for NTP and PLS was 11,580 and 6878, respectively. Tailing factor for NTP and PLS was 0.68 and 0.84, respectively. All the parameters found to be within the limit (Fig. 2).
Linearity
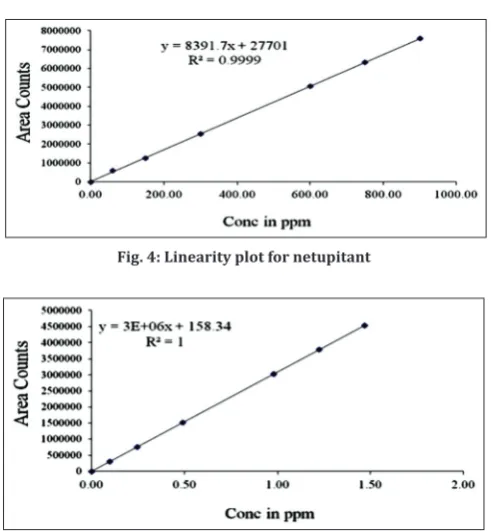
Linearity of the method was evaluated by preparing a standard solution containing 600 µg/ml of NTP and 1.0 µg/ml of PLS (100% targeted level of the assay concentration). Sequential dilutions were performed to give solutions at 10, 25, 50, 100, 125, and 150% of the target concentrations. These were injected and peak areas used to plot calibration curves against the concentration. The correlation coefficient values of these three analyte were 0.999. The results are shown in Table 1 and Figs 3 and 4.
LOD and LOQ
LOD and LOQ minimum concentration level at which the analyte can be
reliably detected, quantified using the standard formulas (3.3 times σ/s and 10 times σ/s for LOD and LOQ, respectively). LOD values for NTP
and PLS were 1.5005 and 0.0026 µg/ml and s/n values are 3 and 5, respectively. LOQ values for NTP and PLS were 3.001 and 0.0052 µg/ml and s/n values are 23 and 27, respectively.
Precision
Method precision was investigated by the analysis of six separately prepared samples of the same batch. From this, six separate sample solutions were injected and the peak areas obtained used to calculate mean and percentage of relative standard deviation (%RSD) values. The present method was found to be precise as %RSD of the <2%, and also, the percentage assay values were closed to be 100%. The results are given in Table 2 and Fig. 3.
for NTP and PLS drugs. The results are shown in Table 5.
Forced degradation
Forced degradation conditions such as acidic, basic, oxidative, reduction, thermal, hydrolysis, and photolytic stresses were attempted as per the International Conference of Harmonization (ICH) guidelines Q2B. There is an effect of assay results. The results are shown in Table 6.
CONCLUSION
This method described the quantification of NTP and PLS in bulk and pharmaceutical formulation as per the ICH guidelines. The developed method was found to be accurate, precise, linear, and reliable. These two drugs are novel and strong discussion on developed method their validation. The advantage lies in the simplicity of sample preparation and economically fewer reagents were used. In addition, two compounds are eluted within 10 min. The proposed HPLC method was suitable resolution to precise quantification of the compounds. Statistical analysis of the experimental result indicates that the precision and reproducibility data are satisfactory. The developed chromatographic method can be effectively applied for routine analysis in drug research.
AUTHORS’ CONTRIBUTION
M. Manoranjani has design the work, literature collection, performed the experiment in the laboratory, and manuscript preparation. Instrumentation supports Shree Icon Pharmaceutical Laboratories, Vijayawada.
Table 1: Linearity study results Analyte Linearity
range Equation of calibration curve Correlation coefficient
NTP 60–900 µg/ml Y=8392x+27701 0.999 PLS 0.1–1.5 µg/ml Y=30888899x+158 0.999
NTP: Netupitant, PLS: Palonosetron
Table 2: Method precision results
Analyte Amount
present % assay as is (mean) %RSD of assay
NTP 600 µg/ml 100.26 1.05 PLS 1.0 µg/ml 100.05 0.56
NTP: Netupitant, %RSD: Percentage of relative standard deviation, PLS: Palonosetron
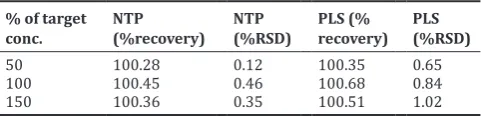
Table 3: Accuracy (recovery) study results % of target
conc. NTP (%recovery) NTP (%RSD) PLS (% recovery) PLS (%RSD)
50 100.28 0.12 100.35 0.65 100 100.45 0.46 100.68 0.84 150 100.36 0.35 100.51 1.02
NTP: Netupitant, %RSD: Percentage of relative standard deviation, PLS: Palonosetron
Table 4: Robustness results Drug
name Flow plus (1.2 ml/min) (%RSD) Flow minus (0.8 ml/min) (%RSD) Organic plus (45:55) (%RSD) Organic minus (35:65) (%RSD)
NTP 0.28 0.14 0.35 1.02
PLS 0.36 0.57 0.87 0.63
NTP: Netupitant, %RSD: Percentage of relative standard deviation, PLS: Palonosetron
CONFLICTS OF INTEREST
The author declares that there are no conflicts of interest regarding the publication of this article.
REFERENCES
1. Quinla JD, Hill DA. Nausea and vomiting of pregnancy. Am Fam Physician 2003;68:121-8.
2. Christof S, Peters P, Miller RK. Antiemetics and hyperemesis gravidarum. Drugs During Pregnancy and Lactation: Handbook of Prescription Drugs and Comparative Risk Assessment. New York: Elsevier; 2001.
3. Paula G, Axel G, Loprinzi CL. Nausea and Vomiting in the Cancer Patient. New York: Springer; 2006. p. 1482-96.
4. Judith ET. Emergency Medicine: A Comprehensive Study Guide. New York: McGraw-Hill Companies; 2010. p. 830.
5. Corrie PG, Pippa G. Cytotoxic chemotherapy clinical aspects. Medicines 2008;36:24-8.
6. Levi JA, Aroney RS, Dalley DN. Haemolytic anaemia after cisplatin treatment. Br Med J (Clin Res Ed) 1981;282:2003-4.
7. Barnes NM, Hales TG, Lummis SC, Peters JA. The 5-HT3 receptor-the relationship between structure and function. Neuropharmacology 2009;56:273-84.
8. Purves D, Augustine GJ, Fitzpatrick D. Neuroscience. 4th ed. Sunderland
(MA): Sinauer Associates; 2008. p. 11-20.
9. Berthoud HR, Neuhuber WL. Functional and chemical anatomy of the afferent vagal system. Auton Neurosci 2000;85:1-7.
10. Saunders CJ, Christensen M, Finger TE, Tizzano M. Cholinergic neurotransmission links solitary chemosensory cells to nasal inflammation. Proc Natl Acad Sci U S A 2014;111:6075-80.
11. Lutz DS. Dictonary of Minor Planet Names-Posterma. Berlin Heidelberg: Springer; 2007. p. 118.
12. Pietra S. Indolic derivatives II. A new way to synthesize serotonin. Farmaco Sci 1958;13:75-9.
13. de Lartigue G, Ronveaux CC, Raybould HE. Deletion of leptin signaling in vagal afferent neurons results in hyperphagia and obesity. Mol Metab 2014;3:595-607.
14. Pathi PJ, Raju NA. The estimation of palonosetron hydrochloride in parenterals by RP-HPLC. Asian J Pharm Tech 2012;2:77-9.
15. Inturi S, Inturi RK, Venkatesh G. A validated novel RP-HPLC method development for the estimation of Palonosetron hydrochloride in bulk and softule dosage forms. Pharm Sin 2011;2:223-34.
16. Murthy MV, Krishnaiah C, Kodithyala J, Katkam S, Mukkanti K, Ramesh K, et al. Enantio separation of palanosetron hydrochloride and its related enantiomeric impurities by computer simulation and validation. Am J Anal Chem 2011;2:437-46.
17. Jain PS, Chavan RS, Bari PR, Patil SS, Surana SJ. Stability indicating HPTLC method for estimation of palonosetron hydrochloride in tablet dosage form. J Adv Drug Deliv 2015;2:578-86.
18. Patel H, Lava B. Stability indicating HPLC method for estimation of Palonosetron hydrochloride in tablet dosage form. Int J Pharm Res Sch 2015;4:258-63.
19. Jayesh B, Sharad K, Yoges Y. Development of chromatographic method for the estimation of palonosetron hydrochloride injection. Indian J Pharm Sci 2011;2:24-32.
20. Harole M, Patil RN, Gaware D, Suryawansh G, Pise K. A validated stability indicating RP-HPLC method for simultaneous determination
Fig. 3: Sample chromatogram
Fig. 4: Linearity plot for netupitant
Fig. 5: Linearity plot for palonosetron
Table 5: Stability results Stability NTP %
assay % difference PLS % assay % difference
Initial 100.65 0.00 100.48 0.00 12 h 100.54 0.11 100.32 0.16 18 h 100.38 0.27 100.26 0.22 24 h 100.12 0.53 100.05 0.43
NTP: Netupitant, PLS: Palonosetron
Table 6: Forced degradation results Degradation NTP
(% assay) % of degradation PLS (% assay) % of degradation
Control 100.58 0.00 100.36 0.00 Acid 92.36 8.22 91.25 9.11 Alkali 88.92 11.66 84.38 15.98 Peroxide 86.37 14.21 82.91 17.45 Reduction 95.31 5.27 94.24 6.12 Thermal 75.36 25.22 76.38 23.98 Photolytic 89.54 11.03 88.14 12.22 Hydrolysis 84.14 16.44 85.38 14.98