Rupture process of the 2007 Chuetsu-oki, Niigata, Japan, earthquake
—Waveform inversion using empirical Green’s functions—
Atsushi Nozu
Independent Administrative Institution, Port and Airport Research Institute, 3-1-1 Nagase, Yokosuka 239-0826, Japan
(Received December 3, 2007; Revised June 14, 2008; Accepted June 15, 2008; Online published December 10, 2008)
A waveform inversion was conducted to reveal the rupture process of the 2007 Chuetsu-oki, Niigata, Japan, earthquake using near-source strong ground motion records. Based on recent results on the re-location of the aftershocks, a southeast-dipping fault plane was assumed. Aftershock records were used as empirical Green’s functions to avoid uncertainty in subsurface structure in and around the source region for the calculation of Green’s functions. To ensure that the path and the site effects are shared between ground motions from the mainshock and those from the aftershocks, the mainshock fault plane was divided into three domains, each of which was allocated to one of the aftershocks used. Based on the results of the inversion, a major distinctive asperity was identified approximately 20 km southwest of the hypocenter, near Kashiwazaki City. A minor, rather obscure asperity was recognizable between the hypocenter and the major asperity. The rupture continued approximately 10 s. Agreement between the observed and synthetic ground motions is quite satisfactory, not only for the portions used for the inversion but also for the later phases. The rupture of the main asperity, which is close to Kashiwazaki City, may be a primary reason for the large amplitude ground motion and damage in Kashiwazaki City.
Key words: Chuetsu-oki earthquake, waveform inversion, rupture process, empirical Green’s functions, after-shock, mainshock.
1.
Introduction
A large shallow crustal earthquake occurred on July 16, 2007, off the coast of Niigata Prefecture, Japan. Ac-cording to the Japan Meteorological Agency (JMA), the hypocentral parameters are: origin time=10:13:22.5 JST; epicenter = 37.557N, 138.608E; depth = 17 km; mag-nitude (MJ) = 6.8. The earthquake caused serious
dam-age to Niigata Prefecture and to Kashiwazaki City in par-ticular. This earthquake is hereafter referred to as “the Chuetsu-oki earthquake” in this article. Estimation of the rupture process of the earthquake is important both for es-timating mainshock ground motions at sites where main-shock records were not obtained and for constructing real-istic source models of future large crustal earthquakes for the prediction of strong ground motions. Thus, a waveform inversion was conducted in this study to reveal the rupture process of the Chuetsu-oki earthquake.
As shown in the following section, some of the main-shock records obtained at several K-NET (Kinoshita, 1998) and KiK-net (Aoi et al., 2000) near-source strong mo-tion stamo-tions are characterized by the predominance of later phases, indicating the existence of complicated two-dimensional (2D) or 3D effects of surface geology in and around the source region. Aftershock records were used as empirical Green’s functions (EGF) in the inversion to avoid uncertainty in the surface geology. To ensure that the path
Copyright cThe Society of Geomagnetism and Earth, Planetary and Space Sci-ences (SGEPSS); The Seismological Society of Japan; The Volcanological Society of Japan; The Geodetic Society of Japan; The Japanese Society for Planetary Sci-ences; TERRAPUB.
and the site effects are shared between the mainshock and the aftershocks, the mainshock fault plane was divided into three domains, and three aftershocks were selected and al-located to the domains.
2.
Data and Method
In the EGF method, it is important to use small events which share the same path and site effects with the target event. Because some of the stations are located relatively close to the fault plane (Fig. 1), it may not be appropriate to represent contributions from the entire fault plane with records of only one aftershock. Thus, the mainshock fault plane was divided into three domains, as shown in Fig. 1. The three aftershocks listed in Table 1 were selected to be used in the analysis, and each was allocated to one of the domains. These aftershocks were selected paying attention to the resemblance of the Fourier phase of the mainshock and aftershock ground motions (Nozu, 2005, 2007; Nozu and Irikura, 2008). Figure 1 shows the epicenters of the aftershocks determined by the JMA. Given that the dis-tance from the fault plane to the near-source stations being very small, the Green’s function may still vary significantly within a domain. Thus, the variability of Green’s functions within a domain was evaluated using a 1D structure. This point will be described in more detail in Discussion.
There are 14 K-NET (Kinoshita, 1998) and KiK-net (Aoi
et al., 2000) stations which recorded all three aftershocks and the mainshock. On the basis of the signal-to-noise ratio of the aftershock records, nine of these 14 stations were se-lected. In order to improve the coverage in the near source
1170 A. NOZU: RUPTURE PROCESS OF 2007 CHUETSU-OKI, JAPAN, EARTHQUAKE
Table 1. Source parameters for the mainshock and the aftershocks.
Origin time∗ Latitude∗ Longitude∗ Depth∗ MJ∗ Moment∗∗ Strike∗∗ Dip∗∗ Rake∗∗
(◦) (◦) (km) (N m) (◦) (◦) (◦)
Mainshock 2007/07/16 10:13:22.5 37.557 138.608 17.0 6.8 9.30E+18 49 42 101
Aftershock 1 2007/07/16 21:08:2.2 37.508 138.628 20.0 4.4 5.21E+15 39 41 115
Aftershock 2 2007/07/18 16:53:5.2 37.442 138.615 23.0 4.3 4.08E+15 39 62 95
Aftershock 3 2007/07/18 20:02:55.9 37.472 138.493 21.0 3.7 3.97E+14 44 53 77
∗JMA,∗∗F-net (www.fnet.bosai.go.jp).
Fig. 1. The fault plane of the mainshock assumed for the inversion (large rectangle), the K-NET, KiK-net, and F-net stations used for the inver-sion (solid triangles), the mainshock epicenter reported by JMA (small open square), the epicenters of the aftershocks used in the analysis (small solid squares), and the epicenters of the aftershocks within 24 h of the mainshock (dots). The fault plane was divided into three do-mains. Three aftershocks were selected, each of which is close to one of the three domains.
region, an F-net (Fukuyamaet al., 1996) station, KZK, was included in the analysis. Therefore, a total of ten stations were used for the inversion, as shown in Fig. 1 (solid tri-angles). Both the borehole and surface records were avail-able at the KiK-net stations, and the former were used to minimize the influence of soil nonlinearity on the results. Although it is anticipated that strong soil nonlinearity was included in the site response at the K-NET station NIG018, as discussed later, this site was included in the analysis be-cause it is the nearest station to the source in our analy-sis and the records at the station provide important con-straints in our analysis. Two horizontal components were used at the K-NET and KiK-net stations, but only the east-west component was used at KZK because the north-south component was not in good condition. Thus, 19 horizontal components were used in the inversion.
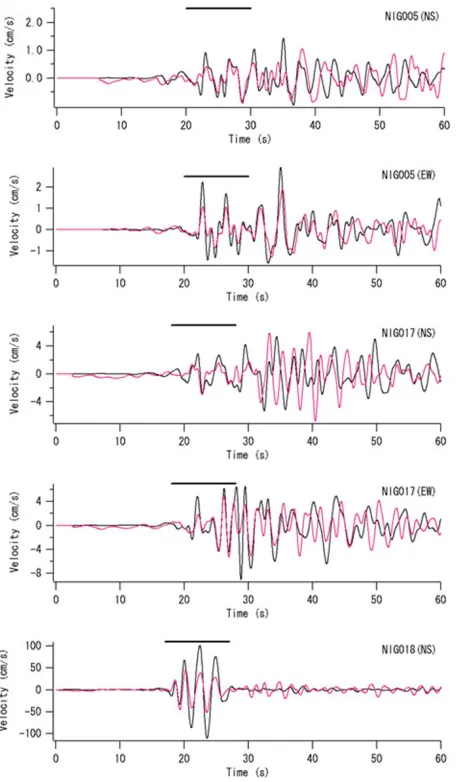
Figure 2 shows the mainshock velocity waveforms (0.2– 1 Hz) for the 19 components. The waveforms at K-NET and KiK-net stations were prepared by band-pass filtering and
Fig. 2. Comparison of the observed (black traces) and synthetic (red traces) mainshock velocities (0.2–1.0 Hz) as a result of the waveform inversion in CASE 2. The thick horizontal bars indicate the portions of data used for the inversion.
hori-Fig. 2. (continued).
zontal bars in Fig. 2. The width of the time window was determined based on the approximate duration of the rup-ture, estimated from the fault dimension. The later phases were excluded from the time window because they can be sensitive to soil nonlinearity (Nozu and Morikawa, 2003).
The least-squares linear waveform inversion (Nozu, 2005, 2007; Nozu and Irikura, 2008) was adopted. The inversion follows the multi-time-window approach, which was proposed by Hartzell and Heaton (1983), although EGF are used in the analysis reported here.
Based on recent results on the re-location of the af-tershocks (Kato et al., 2008; Shinohara et al., 2008), a southeast-dipping fault plane with the length of 30 km and the width of 24 km was assumed (Fig. 1), whose strike and dip angles were set to be 40◦ and 36◦, respectively. Two cases of inversions were carried out. In CASE 1, a fault plane, including the JMA hypocenter (depth=17 km), was assumed in which the depth of the aftershocks reported by the JMA (Table 1) was also used. In CASE 2, both the mainshock fault plane and the aftershocks were assumed to be 5 km shallower than in CASE 1 in order to be more consistent with the recent results on the re-location of the aftershocks (Katoet al., 2008; Shinoharaet al., 2008). This
author assumes that CASE 2 is more realistic.
In both cases, the fault was divided into 20×16 fault el-ements. The first-time-window triggering front is assumed to start from the JMA hypocenter (or, for CASE 2, the point 5 km below it) and to propagate radially at a constant veloc-ity of 2.9 km/s. The effect of the choice of the velocveloc-ity will be discussed later. At each fault element, the moment rate function after passage of the rupture front is expressed as a convolution of an impulse train with the moment rate func-tion of the aftershock allocated to that particular element (Nozu, 2007). The impulse train spans 3.0 s and consists of 12 impulses at equal time intervals of 0.25 s. Thus, the height of each impulse corresponds to the ratio of the mo-ment release during each 0.25 s with respect to the momo-ment of the aftershock. The ratio is determined through the in-version.
1172 A. NOZU: RUPTURE PROCESS OF 2007 CHUETSU-OKI, JAPAN, EARTHQUAKE
Fig. 2. (continued).
be 3.55 km/s, which corresponds to the second layer of the subsurface structure employed by Fukuyamaet al.(1998). Absolute time information for both the mainshock and the aftershock recordings was used (Nozu, 2007).
It should be noted that, in this analysis, it is assumed that the aftershock records represent the response of the media to a point source. As such, it is necessary to avoid using frequencies higher than the corner frequencies of the shocks, for which the effect of fault finiteness of the after-shock is not negligible. Figure 3 shows the Fourier spectral ratio between the mainshock and the aftershock records at nine K-NET and KiK-net stations and their average. Also plotted in Fig. 3 are the theoretical spectral ratios obtained from the ω−2 spectral model. To determine the spectral
model, seismic moments in Table 1 are adopted, and the corner frequencies are determined so that the theoretical spectral ratios are consistent with the observed ones. The corner frequencies for the aftershocks are higher than 1 Hz. Thus, it is justified to use waveforms with frequencies lower than 1 Hz.
Non-negative least-square solutions were obtained using the algorithm of Lawson and Hanson (1974). In the analy-sis, constraints were imposed to minimize the second order derivative of the slip on the rupture area (Nozu, 2007). The absolute moment from each element is assumed to be con-tinuous at boundaries of regions allotted to different after-shocks. The moments of the aftershocks were determined by the F-net (Fukuyamaet al., 1996), as listed in Table 1.
Fig. 4. Final slip distribution for the 2007 Cuetsu-oki earthquake obtained as a result of the waveform inversion in CASE 1. The star indicates the hypocenter, i.e., the rupture starting point assumed for the waveform inversion. The absolute value of the slip was obtained assuming the aftershock moments listed in Table 1.
Fig. 5. Final slip distribution for the 2007 Cuetsu-oki earthquake obtained as a result of the waveform inversion in CASE 2. A major asperity marked as ‘b’ is found approximately 20 km southwest of the rupture starting point. A minor asperity (a) is recognized between the hypocen-ter and the major asperity.
3.
Results and Discussion
The synthetic mainshock velocities (0.2–1 Hz) resulting from the inversion are compared with the observed ones in Fig. 2. Although the synthetic velocities from the CASE 2 inversion are shown in Fig. 2, those from the CASE 1
inver-Fig. 6. Slip velocity time functions at asperities (‘a’ and ‘b’ in inver-Fig. 5) as a result of the waveform inversion in CASE 2. The abscissa indicates the time after passage of the first-time-window triggering front. The time functions correspond to the fault elements with largest final slip in the asperities ‘a’ and ‘b’.
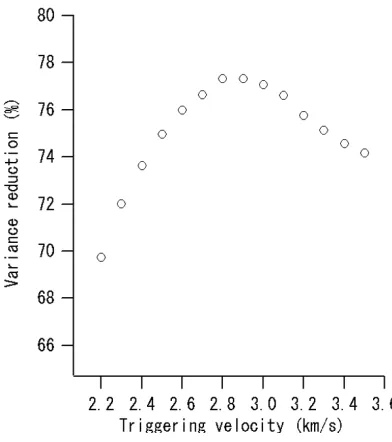
Fig. 7. Relation between the first-time-window triggering velocity and VR defined in Eq. (1) and averaged for the all components for the inversion in CASE 2. VR is maximized with the triggering velocity of 2.9 km/s.
sion are very similar to those from CASE 2. Agreement be-tween the observed and synthetic waves is satisfactory. Not only the portions used for the inversion (indicated by the thick horizontal bars) but also the later phases are accurately reproduced, especially at NIG005, NIG019, and NIG020. This success of the reproduction of the later phases comes from the use of the EGF.
af-1174 A. NOZU: RUPTURE PROCESS OF 2007 CHUETSU-OKI, JAPAN, EARTHQUAKE
Fig. 8. A map showing the location of point sources for which theoret-ical Green’s functions are calculated for the site NIG018 using a 1D structure. The numbers 1–5 indicate the point sources.
tershock moments listed in Table 1 and using a shear wave velocity of 3.55 km/s and a density of 2.4 g/cm3. (These
values correspond to the second layer of the subsurface structure employed by Fukuyama et al.(1998)). The re-sults from CASE 1 and CASE 2 do not exhibit significant contradictions, although in CASE 1 a larger slip is required to explain the large amplitude ground motions at NIG018 because in CASE 1 the fault is assumed to be deeper. This author assumes that CASE 2 is more realistic and, therefore, directs all further attention to the analysis of the results of CASE 2.
In CASE 2, a major asperity (b) is found approximately 20 km southwest of the rupture starting point, and a mi-nor asperity (a) is also recognizable between the hypocen-ter and the major asperity. The estimated total moment is 3.0E+19 N m. It should be noted that, because only fre-quencies higher than 0.2 Hz are used in this analysis, the seismic moment thus obtained is less reliable than those ob-tained from lower frequency data and/or geodetic data.
Figure 6 shows the slip velocity time functions at the asperities (‘a’ and ‘b’ in Fig. 5) based on the inversion in CASE 2 (the time functions at the fault elements with largest final slip in asperities ‘a’ and ‘b’). These time func-tions are more or less in agreement with those obtained from dynamic fault models (e.g., Nakamura and Miyatake, 2000), in a sense that the slip velocity is large at the be-ginning and then gradually slows down. Because the time functions indicate that the slip occurred just after passage of the rupture front at both asperities ‘a’ and ‘b’, the actual rupture velocity is estimated to be very close to the first-time-window triggering velocity (2.9 km/s). It should be noted that the source time functions obtained here are only valid for frequencies lower than 1 Hz. Thus, the time func-tions cannot be interpreted as evidence for the existence of
Fig. 9. Theoretical Green’s functions (black traces) for the five point sources (Fig. 8) and for the site NIG018 for the north-south (NS) components (top), the east-west (EW) components (middle) and the fault-normal components (bottom). The 1D structure by Fukuyamaet al.(1998) was assumed. The seismic moment is 1.0E+15 N m, and the source time function is a boxcar function with a duration of 0.5 s. The strike, dip, and rake angles are 40◦, 36◦, and 90◦, respectively. The numbers attached to the traces indicate the location of the point sources (Fig. 8). The red traces indicate the Green’s functions, originally eval-uated for the central point source (5) and corrected for the geometrical spreading and time shifts (Irikura, 1983) so as to be suitable for other point sources.
Fig. 10. Final slip distribution for the 2007 Cuetsu-oki earthquake ob-tained as a result of the waveform inversion using only fault-normal (N130E) components.
by introducing variance reduction (VR), defined by
VR(%)=
1−
(s(t)−o(t))2 |o(t)|2
×100, (1)
wheres(t)denotes the synthetic wave, ando(t)denotes the observed wave. The integration is taken over the same time interval as that used for the inversion (Fig. 2). As can be seen in Fig. 7, VR is maximized with the triggering velocity of 2.9 km/s, which was employed in this analysis.
In this analysis, although the fault plane is divided into three domains, Green’s functions may still vary signifi-cantly within the domains, given the small distance from the fault plane to near-source stations; this is especially true from the southwest domain to NIG018. I therefore investi-gated the variability of Green’s functions within the domain using a 1D structure proposed by Fukuyamaet al.(1998). As shown in Fig. 8, five point sources are distributed within the domain, and Green’s functions are calculated for the site NIG018 using the discrete wavenumber method (Bouchon, 1981). The author’s intention is not to calculate realistic Green’s functions, including site effects, but to focus on the variability of the Green’s functions due to the location of the source. The results are shown in Fig. 9 where it is clear that the variability of the Green’s functions within the domain is not necessarily negligible for the north-south and east-west components, depending on the location of the point source. The variability is less significant, however, for the fault-normal (N130E) components. In fact, if corrections are applied for the geometrical spreading and time shifts (Irikura, 1983) to a fault-normal Green’s function from one point, as we do in the EGF analysis, the result becomes a good approximation of the Green’s functions from other points (Fig. 9). Knowing this, another case of inversion was conducted, in which only the fault-normal (N130E)
compo-Fig. 11. Site amplification factor at NIG018 estimated using the spectral inversion technique (Nozu et al., 2007) (upper) and the mainshock Fourier spectrum at NIG018. The Fourier spectrum is the vector sum of two horizontal components and filtered through a Parzen window with a band width of 0.05 Hz.
nents were used. In this analysis, site KZK was excluded because the north-south component is not available. The fi-nal slip distribution for this case (Fig. 10) is not significantly different from the inversion results using the north-south and east-west components (Fig. 5), although slip around asperty ‘a’ is larger in this case than in the original case (Fig. 5). This result indicates that the variability of Green’s functions within the domain does not have significant ef-fects on the estimates of final slip distribution.
Finally, discussion is directed to the possible effects of soil nonlinearity at NIG018 on the inversion results. In Fig. 11, the site amplification factor at NIG018 estimated using the spectral inversion technique from small earth-quake records prior to the 2007 Chuetsu-oki events (Nozu
1176 A. NOZU: RUPTURE PROCESS OF 2007 CHUETSU-OKI, JAPAN, EARTHQUAKE
Fig. 12. Final slip distribution for the 2007 Cuetsu-oki earthquake ob-tained as a result of the waveform inversion without using the records at NIG018.
Fourier spectrum has a peak around 0.4–0.5 Hz. This clear shift may indicate the effects of soil nonlinearity on the mainshock records, even at frequencies lower than 1 Hz. It is anticipated, therefore, that the inversion result is more or less influenced by soil nonlinearity at NIG018. To in-vestigate the amount of the influence, another case of inver-sion was conducted, in which the records at NIG018 were excluded from the data. The final slip distribution for this case (Fig. 12) is not significantly different from the inver-sion results including the records at NIG018 (Fig. 5). This result indicates that the nonlinear soil behavior at NIG018 does not have significant effects on our estimates of final slip distribution.
4.
Conclusion
A waveform inversion was conducted to reveal the rup-ture process of the 2007 Chuetsu-oki, Niigata, Japan, earth-quake using strong ground motion records. Based on recent results of the re-location of the aftershocks, a southeast-dipping fault plane was assumed. To avoid uncertainty in subsurface structure in and around the source region, af-tershock records were used as EGF. The mainshock fault plane was divided into three domains to assure that the path and the site effects are shared between the mainshock and aftershocks; each of these domains was allocated to one of the aftershocks used. According to the results of the inver-sion, a major distinctive asperity was found approximately 20 km southwest of the hypocenter, near Kashiwazaki City, and a minor, rather obscure asperity is recognizable be-tween the hypocenter and the major asperity. The rupture continued for approximately 10 s. Agreement between the observed and synthetic ground motions is quite satisfactory, not only for the portions used for the inversion but also for
the later phases. The rupture of the main asperity, which is close to Kashiwazaki City, may be a primary reason for the large-amplitude ground motion and damage to Kashiwazaki City.
Acknowledgments. The author would like to thank Professor Ko-jiro Irikura for his continuous encouragement. The author is also grateful to the National Research Institute for Earth Science and Disaster Prevention, Japan, for providing strong motion data of the K-NET, KiK-net, and F-net and CMT solutions by the F-net. The manuscript was significantly improved due to the comments from Dr. Yoshiaki Shiba and an anonymous reviewer.
References
Aoi, S., K. Obara, S. Hori, K. Kasahara, and Y. Okada, New strong-motion observation network: KiK-net,Eos Trans. AGU,81, 329, 2000. Bouchon, M., A simple method to calculate Green’s functions for elastic
layered media,Bull. Seismol. Soc. Am.,71, 957–971, 1981.
Fukuyama, E., M. Ishida, S. Hori, S. Sekiguchi, and S. Watada, Broadband seismic observation conducted under the FREESIA Project,Rep. Natl. Res. Inst. Earth Sci., Disaster Prev.,57, 23–31, 1996.
Fukuyama, E., M. Ishida, D. S. Dreger, and H. Kawai, Automated seismic moment tensor determination by using on-line broadband seismic wave-forms,Zisin,51, 149–156, 1998 (in Japanese with English abstract). Hartzell, S. H. and T. H. Heaton, Inversion of strong ground motion and
teleseismic waveform data for the fault rupture history of the 1979 Imperial Valley, California, earthquake,Bull. Seismol. Soc. Am.,73, 1553–1583, 1983.
Irikura, K., Semi-empirical estimation of strong ground motions during large earthquakes,Bull. Disaster Prev. Res. Inst., Kyoto Univ.,32, 63– 104, 1983.
Kato, A., S. Sakai, E. Kurashimo, T. Igarashi, T. Iidaka, N. Hirata, T. Iwasaki, T. Kanazawa, and Group for the aftershock observations of the 2007 Niigataken Chuetsu-oki Earthquake: Imaging heterogeneous velocity structures and complex aftershock distributions in the source region of the 2007 Niigataken Chuetsu-oki Earthquake by a dense seis-mic observation,Earth Planets Space,60, 1111–1116, 2008. Kinoshita, S., Kyoshin Net (K-net),Seismol. Res. Lett.,69, 309–332, 1998. Lawson, C. L. and R. J. Hanson,Solving Least Squares Problems,
Prentice-Hall, Inc., Englewood Cliffs, New Jersey, 1974.
Nakamura, H. and T. Miyatake, An approximate expression of slip velocity time function for simulation of near-field strong ground motion,Zisin, 53, 1–9, 2000 (in Japanese with English abstract).
Nozu, A., Variable-slip rupture model for the 2004 Mid Niigata Prefecture (Niigata-ken Chuetsu) earthquake—waveform inversion with empirical Green’s functions—,Zisin,58, 329–343, 2005 (in Japanese with En-glish abstract).
Nozu, A., Variable-slip rupture model for the 2005 West Off Fukuoka Pre-fecture, Japan, earthquake—waveform inversion with empirical Green’s functions—,Zisin,59, 253–270, 2007 (in Japanese with English ab-stract).
Nozu, A. and H. Morikawa, An empirical Green’s function method consid-ering multiple nonlinear effects,Zisin,55, 361–374, 2003 (in Japanese with English abstract).
Nozu, A. and K. Irikura, Strong-motion generation areas of a great subduction-zone earthquake: waveform inversion with empirical Green’s functions for the 2003 Tokachi-oki earthquake,Bull. Seismol. Soc. Am.,98, 180–197, 2008.
Nozu, A., T. Nagao, and M. Yamada, Site amplification factors for strong-motion sites in Japan based on spectral inversion technique and their use for strong-motion evaluation,Journal of the Japan Association for Earthquake Engineering,7, 215–234, 2007 (in Japanese with English abstract).
Shinohara, M., T. Kanazawa, T. Yamada, K. Nakahigashi, S. Sakai, R. Hino, Y. Murai, A. Yamazaki, K. Obana, Y. Ito, K. Iwakiri, R. Miura, Y. Machida, K. Mochizuki, K. Uehira, M. Tahara, A. Kuwano, S. Amamiya, S. Kodaira, T. Takanami, Y. Kaneda, and T. Iwasaki, Precise aftershock distribution of the 2007 Chuetsu-oki Earthquake obtained by using an ocean bottom seismometer network,Earth Planets Space,60, 1121–1126, 2008.