R E S E A R C H
Open Access
Separation algorithm of vital sign signal in
complex environments based on
time-frequency filtering
Kun Tian, Jin Li
*and Xiaobo Yang
Abstract
Life detection radar that combines radar technology with biomedical engineering detects human physiological signals (respiration, heartbeat, body movement, etc.) from a long distance with non-contact method. In this field, vital sign detection and parameter extraction are hot issues in current researches, and the acquisition of vital sign signal of human target with radar may very helpful. In this paper, a separation method for vital sign signals based on time-frequency filtering (TFF) is proposed, which mainly predicts the instantaneous frequency (IF) by combining the Viterbi algorithm (VA) with strong noise immunity and taking advantage of the high-resolution time-frequency transformation method with good cross-term inhibitory effect in B distribution (BD), so as to extract the weak vital sign signals in the radar echo effectively. According to the simulation result, this algorithm has good resolution precision and anti-noise performance, and it is applicable for the extraction of vital sign signals in low signal-to-noise ratio, which may provide basis for the further launch of parameter extraction of the vital sign signals.
Keywords:Vital sign signal, Time-frequency filtering, B distribution (BD), Viterbi algorithm (VA)
1 Introduction
Life detection radar that combines radar technology with biomedical engineering detects human physiological signals (respiration, heartbeat, body movement, etc.) from a long dis-tance with non-contact method. Real-time non-contact de-tection is an effective approach of monitoring the human physiological features, as well as the significant development direction of future life-monitoring equipment [1–3]. The principle is to conduct the micro-Doppler modulation for the electromagnetic wave with the partial weak periodic mo-tion caused by the heartbeat and breathing and to extract the corresponding micro-Doppler parameters in the echo signal for realizing the extraction of physiological feature parame-ters [4–6]. At present, it has wide applications in through-wall target detection, search-and-rescue missions at disaster sites, biomedical monitoring, and other related fields [7, 8].
Some studies show that radar has the capability of detecting human’s vital signs such as breathing, heartbeat,
and other body movements [9–11]. When the human
target is exposed under the incidence of electromagnetic
wave source [12–14], the reflected signal is
phase-modulated due to the chest movements associated with breathing and heartbeat. The frequency and phase of the incident wave are modulated according to the characteris-tics of the movement amplitude. We can identify and ex-tract the life signal frequency from the change of reflected wave by applying appropriate signal-processing tech-niques. However, in practical application, there contains human body echo, clutter, and noise in the radar echo, of which the energy is far greater than that of the micro-Doppler signal of heartbeat and breathing. The detection accuracy can be significantly influenced by this kind of interference. In order to achieve the heartbeat and breath-ing parameters, micro-Doppler signals, subject echoes, and noises shall be separated or suppressed. Zhang et al. [15] gave a method to suppress the interference by an experimental setup with a dual-frequency continuous-wave radar. The authors used an adaptive filtering method
to suppress the interference caused by the operator’s
respiratory movements and improved detection accuracy. Li et al. [16] used curvelet transform to remove the source-receiver direct coupling wave and background clutters and singular value decomposition to de-noise in * Correspondence:[email protected]
School of Electronic Engineering, University of Electronic Science and Technology of China, Chengdu 611731Sichuan, P. R. China
the life signals. The results are presented based on FFT and Hilbert-Huang transform to separate and to extract human vital sign frequencies, as well as the micro-Doppler shift characteristics.
Li and Pi [17] gave a result that terahertz radar system could be very helpful to observe some slight micro-motion because of its short wavelength, huge bandwidth, and obvious micro-Doppler shift [18]. Combining these characteristics with a high-precision time-frequency filter-ing method, weak human physiological features can be extracted more accurately (the heartbeat and breathing). It can realize the non-contact extraction of human physio-logical feature signals, so as to lay a foundation for further extracting of the physiological feature parameters. Section 2 constructs the model of human of breathing and heartbeat. Section 3 introduces the algorithm of frequency estimation and time-frequency filtering. Section 4 gives some simula-tion results to compare this algorithm with other methods.
2 Modeling of human target echo
Generally, radar echo signal can be expressed as follows [19]:
s tð Þ ¼Aexp j2πfc tþ2R tð Þ
function. If derivation is conducted for the time, the Doppler frequency can be obtained
fDoppler¼
The ECG signal chart can be referred to during the modeling for heartbeat, and it is in a periodic sharp pulse form. The breathing is accomplished by the expan-sion and contraction of the chest, and it can be expressed by the sinusoidal signal model. Suppose that the human body is in a static state relative to radar, the modeling is shown as follows:
R tð Þ ¼R0þr1sin 2ð πω1tÞ þr2δ ωð 2t−τÞ; ð3Þ in which R0 is the distance between the radar and the
human body; the second term is the breathing, while the third is the heartbeat;r1andr2are the range of
breath-ing and heartbeat, respectively, whileω1and ω2are the frequency of breathing and heartbeat, respectively. δ(t) can be expressed as follows:
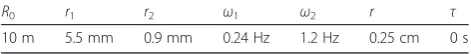
δð Þ ¼t 1 is the radius of the heartbeat. The simulation parameters are shown in Table1and the results are shown in Fig.1.
The echo signal removing the carrier frequency
re-ceived by the receiver consists ofSBODYandSMD
modu-lated by the heartbeat and breathing.
S tð Þ ¼SMDþSBODY
¼e−j2πð2λ−1R tð ÞÞ þe−j2πð2λ−1R0Þ
¼e−j2π½2λ−1ðR0þr1sin 2ðπω1tÞþr2δ ωð 2t−τÞÞ þe−j2πð−2λ−1R0Þ
ð5Þ
The derivation of the SMD phase that may obtain the
Doppler frequency caused by the heartbeat and breath-ing is
The accuracy of Doppler information extraction may impact the effect of the extraction of human target physiological feature parameters. The heartbeat and breathing echo is buried in the subject echo and noise, and it may not be able to measure in the time domain or frequency domain. The time-frequency transformation may spread the noise energy to the entire time domain, while the signal energy may concentrate in limited time and frequency range [20], for realizing the separation of micro-Doppler information from the target and noise.
The algorithm flow of the separation of vital sign signal based on the time-frequency filtering is shown in Fig. 2.
The algorithm may conduct the time-frequency analysis for the echo signal at first, gain the time-frequency domain data of the human echo, and separate the micro-Doppler information of breathing and heartbeat through time-frequency filtering. The human echo may interact with the heartbeat and breath, and high-resolution time-frequency transformation method and high-precision time-frequency filtering separation shall be applied in order to recognize and extract the micro-Doppler information accurately.
3 Time-frequency filtering separation algorithm
In order to separate the micro-Doppler signal caused by the heartbeat and breathing with time-frequency filtering, it may transfer the micro-Doppler signal to the time-frequency with the B distribution (BD) which has good cross-term inhibitory effect and high time-frequency reso-lution [21]. And then the instantaneous frequency of vital sign signal shall be estimated with the Viterbi algorithm [22], which has high estimation precision. Eventually, the coverage function shall be designed according to the instantaneous frequency curve, and the time-frequency point of vital sign signal shall be separated with the
Table 1Simulation parameters of breath and heartbeat
R0 r1 r2 ω1 ω2 r τ
coverage function, so as to gain the micro-Doppler signal of vital sign signals.
3.1 Time-frequency transformation
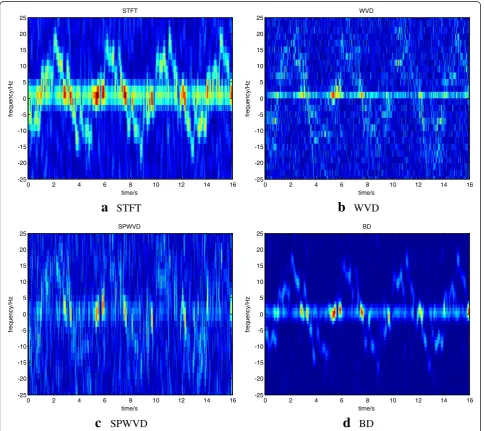
Heartbeat and breathing are typical non-stationary signals, with evident time-varying features, and they shall be analyzed with the time-frequency analysis method. Common time-frequency analysis methods in-clude short-time Fourier transform (STFT), Wigner-Ville distribution (WVD), etc. When multi-component signal is processed, WVD has severe cross-term, and although the improved smoothed pseudo Wigner-Ville distribution (SPWVD) can overcome the impact of the cross-term, it sacrifices the resolution. Although STFT has no cross-terms, it is poor in energy aggregation and low in precision. In this paper, BD algorithm with good cross-term inhibitory effect and high time-frequency resolution is adopted, and it is a kind of Cohen time-frequency distribution [21]. The definition is
BDðt;fÞ ¼
The kernel function is
Φðt;τÞ ¼ j jτ cosh2ð Þt
α
; ð8Þ
in which coshð Þ ¼t etþ2e−t;j jτ=cosh2ð Þt is obtained by expanding the 1/cosh2(t) function to two-dimensional plane (t,τ). When processing the multi-component with the variable α(0 <α≤1), it is a real parameter that
controls the sharpness of cutoff of the two-dimensional filter in the ambiguity domain, and the value α= 0.01 is suggested for most of the signals concerning the cross-term suppression and time-frequency (TF) resolution. It can adjust the passing degree of each component and attenuation degree of the cross-term to get a balance between them.
The human target echo shall be simulated with the time-frequency analysis, and the signal-to-noise ratio is
−3 dB. In there, signal means the energy of echo caused
by breathing and heartbeat in the time range of simula-tion, noise is an additive white Gaussian noise, and the simulation parameter is shown in Table 2.
It can be seen from Fig. 3 that after the time-frequency analysis for the echo signal, micro-Doppler signal may overlap with the human body signal in the time-frequency domain, and the noise may spread in the entire time-frequency domain. It can be seen from Fig. 3a that the STFT method is poor in energy focus, which may result in the mixing of signals and low time-frequency resolution. It can be seen from Fig. 3b, c that WVD and SPWVD may be impacted by noise substan-tially and low in time-frequency resolution, and it may not be able to recognize the micro-Doppler information clearly. In Fig. 3d, it is the processing result of BD trans-formation, although the frequency resolution is different from the above methods, but from the outline, we still could get the conclusion that its resolution and noise-inhibiting ability are relatively ideal.
3.2 Estimation of instantaneous frequency
The concept of time-frequency filtering is proposed by Boashash B, and it mainly realizes the filtering in
time-0 2 4 6 8 10 12 14 16
Breath signal
Heartbeat signal
Range R(t)
a
b
c
Fig. 1Simulated signal of heartbeat.aBreath signal.bHeartbeat signal.cRangeR(t)
Echo T-F analysis
Separate the micro Doppler information of
breath and heartbeat T-F filtering
frequency domain with the time-frequency filter estab-lished [23]. It shall estimate the instantaneous frequency of signals within the time-frequency domain. If it wants to separate the micro-Doppler signal of vital signs in the time-frequency domain, it shall estimate the instantan-eous frequency of vital sign signal at first.
The estimation of instantaneous frequency is quite significant in the analysis of non-stationary signal [24]. The simplest estimation method shall be the peak test method, namely it shall seek for the maximum
time-frequency point at any moment in the time-time-frequency plane
^
w nð Þ ¼ arg max
k
TFðn;kÞ; ð9Þ
in which n is the time sequence, k is the frequency
sequence, and TF(n,k) is the time-frequency distribution. This method is not applicable for estimating the in-stantaneous frequency of multi-component signals in low signal-to-noise ratio (SNR) environment, for the range of noise or other signal components at a certain moment may be greater than the range of a signal com-ponent that shall be estimated, and it may result in the severe deviation of estimation frequency from the real frequency. In this paper, the instantaneous frequency of
Table 2Simulation parameter
Carrier frequency,fc
Time,Tp Sampling
frequency,fs
Frequency point,N
Window,h
220 GHz 16 s 512 Hz 512 Hamming
STFT
signal is estimated with the Viterbi algorithm that is not sensitive to the SNR. In 2004, Igor Djurovic and L. Jubisa Stankovi proposed a method to estimate the instantaneous frequency of multi-component signal by combining the Viterbi algorithm to WVD [22].
The estimation of instantaneous frequency based on the Viterbi algorithm is based on two basic assumptions: (1) the range of time-frequency point corresponding to the instantaneous frequency at any moment is the largest; and (2) the instantaneous frequency curve shall be a relatively smooth curve, namely the frequency changes at any adjacent moment is relatively flat. The algorithm may search a curve in the time-frequency domain to make the cost function of the curve minimum, namely
^ decreasing function about |x-y|, corresponding to hy-pothesis (2).
Along a certain moment n, non-ascending order is
conducted for all time-frequency points at this moment.
BDðn;w1Þ≥BDðn;w2Þ≥⋅⋅⋅BDðn;wjÞ≥⋅⋅⋅BDðn;wMÞ;
ð11Þ
in which j= 1, 2,⋅ ⋅⋅,M is the serial number. The cost function
hðBDðn;wjÞÞ ¼j−1; ð12Þ namely at the largest time-frequency point the function h(x) is 0, and at the second largest time-frequency point is 1; and in this way, the larger the range of time-frequency point is, the smaller the cost will be.
If g(x,y) is a constant, the estimation of instantaneous
frequency will be the maximum estimation, and g(x,y)
will be defined as
g xð ;yÞ ¼ 0;
in whichcis a constant andΔis the maximum frequency change value allowed by the adjacent instantaneous fre-quency. The stronger the instantaneous frequency change of adjacent moment is, the higher the cost will be. In the specific realization process,Δoften relies on the frequency resolution of time-frequency transformation, and higher time-frequency transformation resolution may gain more accurate estimation of instantaneous frequency. In this paper,c =2.5 andΔ= 1.
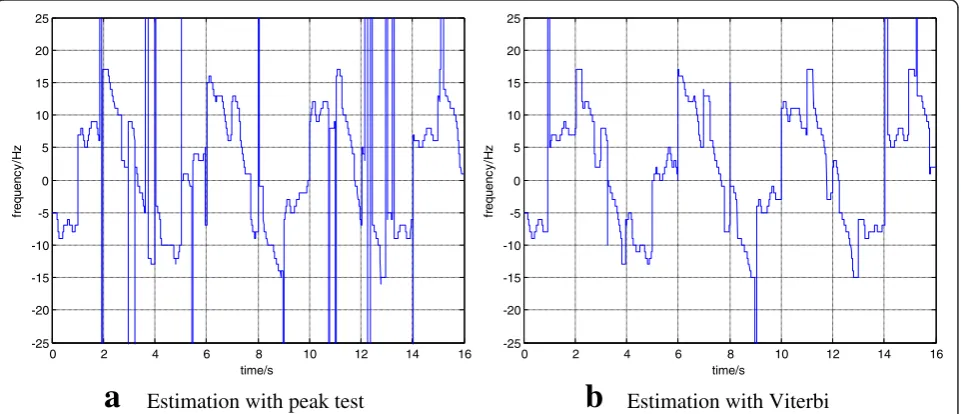
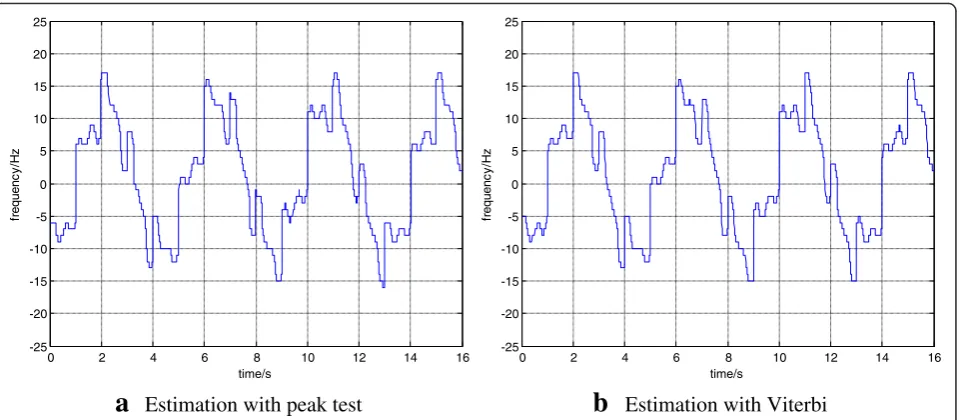
Estimation of instantaneous frequency shall be con-ducted for the time-frequency analysis result gained in BD transformation with the Viterbi algorithm, and the simulation parameters are shown in Table 2. It can be learnt from Figs. 4 and 5 that the instantaneous fre-quency curve gained in the peak test is severely im-pacted by the SNR, and low SNR may result in the curvilinear distortion, while the Viterbi algorithm may gain relatively good estimation result in two types of SNR conditions.
Estimation with peak test
Estimation with Viterbi
a
b
3.3 Time-frequency filtering
After estimating the instantaneous frequency curve of vital sign signals by the method mentioned above, the time-frequency filter can be constructed according to the estimation result to separate the micro-Doppler signal of vital signs. The progress is as follows.
Evaluate IF—Using the algorithm mentioned above
to estimate the instantaneous frequency of multi-component signal, it should be estimated in sequence by the signal power in the time-frequency domain. 1. Evaluate the instantaneous frequency of all
components,ωi^ð Þn;i= 1 corresponding to the
zero region around the instantaneous frequency, forming a new time-frequency representation by B distribution method again.
3. Repeat these two steps to estimate the instantaneous frequency corresponding to all signal components.
Construct TFF—Time-frequency filter can be constructed
based on the instantaneous frequency curve acquired by the steps above to separate the signal components. 1. Choosing the suitable bandwidth based on the
estimated instantaneous frequency to design the
masking functionCi(n,ω) [24],
in whichω^ið Þn is the instantaneous frequency
evaluated andB(n) is the bandwidth of the
masking region which is either time varying or
constant. In this paper, we chooseB(n) = 8.
2. The time-frequency data BDi(n,ω) can be
obtained by multiplying the time-frequency of the
original signal BD(n,w) with the masking function
Ci(n,ω).
3. The m-D signals can be obtained from the
time-frequency data BDi(n,ω) inverse result.
4 Simulation experiment and performance analysis
4.1 The result of separation in simulation
In this paper, the algorithm performance is verified by comparing the impact of different time-frequency transfor-mations and instantaneous frequency estimation methods on the separation algorithm. At first, the vital sign signal separation result based on the combination of BD trans-formation and Viterbi algorithm is proposed. Figure 6a is the separation result when the SNR is−3 dB, while Fig. 6b is the time-frequency spectrum of the actual vital sign micro-Doppler signal. It can be seen from the comparison of the two figures that the algorithm proposed in this paper can restore the micro-Doppler signal caused by the heartbeat and breathing effectively, which may lay the foundation for further extraction of the signal parameters.
4.2 TF transformation methods influence on performance of separation
In order to discuss the algorithm performance quantita-tively, the correlation coefficient of the vital sign signal
X obtained from the separation and its theoretical value
Ycan be defined as
0 2 4 6 8 10 12 14 16
Estimation with peak test
b
a
Estimation with Viterbi
R Xð ;YÞ ¼ ffiffiffiffiffiffiffiffiffiffiffiffiffiffiffiffiffiffiffiffiffiffiffiffiffiffiffiffiffiffiffiffiffiffiffiffiffiffiffiffiffiffiffiffiffiffiffiffiffiE Xðð −XÞðY−YÞÞ E ðX−XÞ2
E ðY−YÞ2
r : ð15Þ
At first, the impact of different time-frequency analysis methods on the separation result shall be discussed. Simulation shall be conducted with the parameters in Table 2, and time-frequency analysis shall be conducted for the echo signals with STFT, WVD, SPWVD, and BD transformation, the instantaneous frequency curve shall be estimated with the Viterbi algorithm for the results,
and the time-frequency filter shall be constructed. In Fig. 7 is the curve of correlation coefficient of the vital sign micro-Doppler signal and its theoretical value changes with SNR, by using different time-frequency transformation methods.
It can be seen from Fig. 7 that the correlation result separated based on the BD transformation is obviously better than the STFT, WVD, and SPWVD methods, and meanwhile, the separation result of the time-frequency filtering based on BD transformation is relatively ideal in all kinds of SNR conditions.
time/s
z
H/
y
c
n
e
u
q
erf
0 2 4 6 8 10 12 14 16
-25 -20 -15 -10 -5 0 5 10 15 20 25
time/s
z
H/
y
c
n
e
u
q
erf
0 2 4 6 8 10 12 14 16
-25 -20 -15 -10 -5 0 5 10 15 20 25
a
Separation result of vital sign micro-Doppler signal
b
Actual vital sign micro-Doppler signal
Fig. 6Vital sign micro-Doppler signal in T-F domain.aSeparation result of vital sign micro-Doppler signal.bActual vital sign micro-Doppler signal
-8 -6 -4 -2 0 2 4
0.45 0.5 0.55 0.6 0.65 0.7 0.75 0.8 0.85 0.9 0.95
SNR/dB
)
y,
x(
R
T F Filter Based on BD T F Filter Based on WVD
T F Filter Based on SPWVD T F Filter Based on STFT
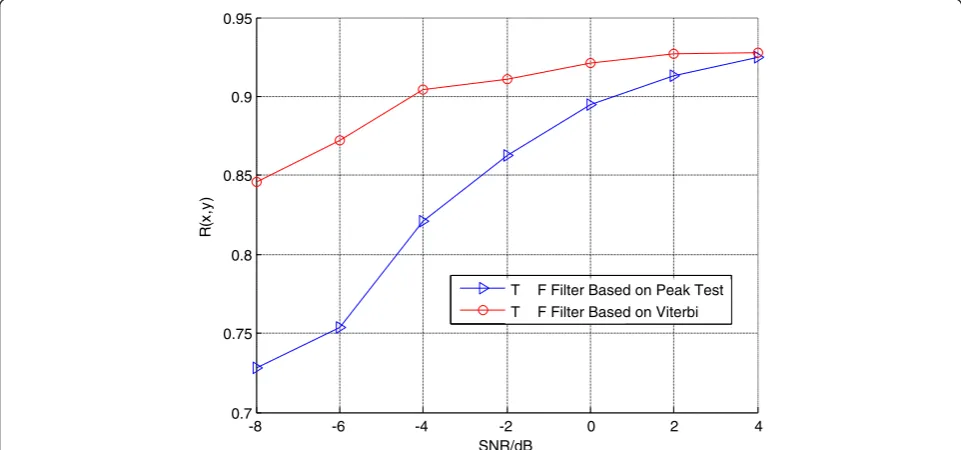
4.3 IF estimation methods influence on performance of separation
Secondly, the impact of different instantaneous fre-quency estimation methods on the separation result is discussed. Simulation is conducted with the parameters in Table 2, and time-frequency analysis is conducted with BD transformation. In Fig. 8 is the varying curve of the correlation coefficient of the result gained from the algorithm and its theoretical value changes with SNR, based on the Viterbi algorithm and peak estimation.
It can be seen from Fig. 8 that in low SNR, the peak estimation is impacted by noise substantially and the correlation coefficient is smaller than that of the Viterbi algorithm. With the increase of SNR, the result of peak estimation may get close or be equal to the result of the Viterbi algorithm. The simulation shows that the time-frequency filtering based on the Viterbi algorithm is slightly impacted by the noise, and it has strong anti-noise capacity, being more applicable for separating the weak human vital sign signals.
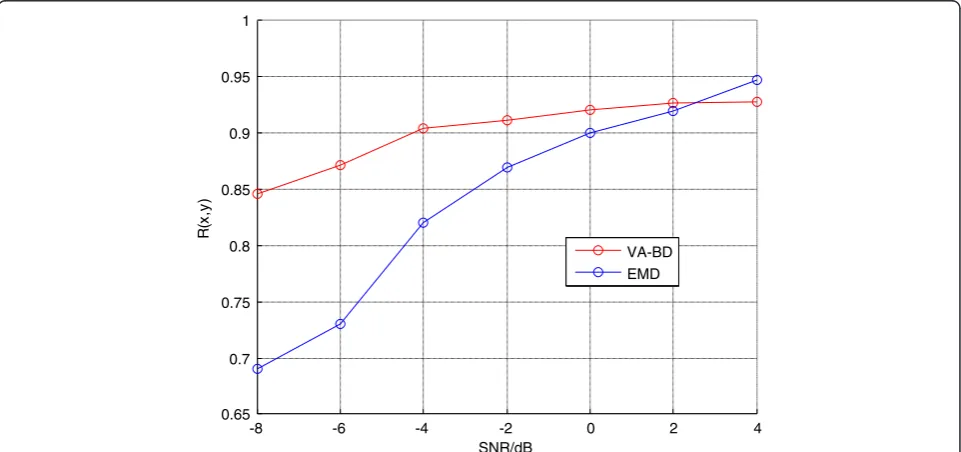
4.4 Compare with empirical mode decomposition
Empirical mode decomposition (EMD) has been pio-neered by N.E. Huang et al. for adaptively decomposing non-stationary signals as sums of zero-mean AM-FM components, called intrinsic mode functions (IMFs) [25]. Using this signal decomposition algorithm, the returns from the target body and the vibrating/rotating structures can be efficiently separated. Better target image will be obtained with the reduction of the interfer-ences from vibrating/rotating parts. On the other hand, micro-Doppler signature can also be revealed much
clearer after the separation [26]. Li et al. [16] show the result of vital sign extract from complex environments by EMD method. Now, we compare the separation results given by EMD and VA-BD combined algorithm.
Figure 9 shows the result of micro-Doppler separation by EMD and VA-BD combined algorithm. From Fig. 9b, we can see that the separation result is influenced by noise when the SNR is not high. Because after separating echo into IMF, we will choose some IMFs to reconstruct the vital signal we need. If the IMF with a higher frequency is chosen, we cannot get rid of the noise, but if the lower frequency is chosen, the real component of vital signal will lose.
From Fig. 10 we can see that, in the situation of low SNR, the result given by EMD has greater influence by noise than the VA-BD algorithm. When the SNR becomes lower, the correlation coefficient by EMD
becomes much lower than the VA-BD’s. Unfortunately,
the SNR of the vital sign signal obtained by the radar sys-tem is always very low because of the echo of the body and the clutters contributed by the ground, walls, and other complex environments. In this case, we can get the conclusion that VA-BD combined algorithm is more suitable than the EMD method in this low SNR condition.
5 Conclusions
In this paper, an algorithm that can separate the micro-Doppler signal of vital sign signals in time-frequency fil-tering is proposed. In this algorithm, the time-frequency of echo signal is analyzed by BD transformation, which is good in cross-term inhibitory effect and high in reso-lution. Secondly, the instantaneous frequency of signal is
-8 -6 -4 -2 0 2 4
0.7 0.75 0.8 0.85 0.9 0.95
SNR/dB
)
y,
x(
R
T F Filter Based on Peak Test
T F Filter Based on Viterbi
estimated by the Viterbi algorithm, which is not sensitive to noise, and may gain good effect in low SNR condition. Eventually, the time-frequency filter is constructed according to the estimated instantaneous frequency, so as to extract the micro-Doppler of vital sign signals.
In this paper, simulation verification is conducted for the performance of time-frequency filtering separation algorithm, and the impact of different time-frequency transformation methods and instantaneous frequency esti-mation methods on the separation effect is analyzed. It is
concluded that the time-frequency filtering algorithm based on the combination of BD transformation and the Viterbi algorithm has good performance, and the extrac-tion result can be further applied in the parameter extraction of vital sign signals. At last, we chose a typical method EMD used by many references for micro-Doppler extraction to compare with this VA-BD combined algo-rithm in this condition. We can obtain the conclusion that VA-BD combined algorithm is suitable for vital sign signal separation because of its low SNR in normal conditions. time/s
z
H/
y
c
n
e
u
q
erf
0 2 4 6 8 10 12 14 16
-25 -20 -15 -10 -5 0 5 10 15 20 25
time/s
z
H/
y
c
n
e
u
q
erf
0 2 4 6 8 10 12 14 16
-25 -20 -15 -10 -5 0 5 10 15 20 25
a
The result of VA-BD algorithmb
The result of EMD methodFig. 9The separation result under SNR =−3 dB.aThe result of VA-BD algorithm.bThe result of EMD method
-8 -6 -4 -2 0 2 4
0.65 0.7 0.75 0.8 0.85 0.9 0.95 1
SNR/dB
)
y,
x(
R
VA-BD
EMD
Competing interests
The authors declare that they have no competing interests.
Acknowledgements
This work was supported in part by the National Natural Science Foundation of China under Grants 61271287, 61371048, and 61301265 and in part by the Fundamental Research Funds for the Central Universities under Grants ZYGX2012Z001 and ZYGX2013J027.
Received: 25 October 2015 Accepted: 13 March 2016
Reference
1. F Michahelles, R Wicki, B Schiele,Less Contact: Heart-Rate Detection Without Even Touching the User. Proceedings of the Eighth International Symposium on Wearable Computers, 2004, pp. 4–7
2. PH Siegel, Terahertz technology in biology and medicine. IEEE Trans. Microwave Theory Tech.52(10), 2438–2447 (2004)
3. EF Greneker, Radar sensing of heartbeat and respiration at a distance, Radar 97, Edinburgh, UK, 1997, pp. 150-154
4. VC Chen, FY Li, Analysis of micro-Doppler signatures. IET Proc. Radar Sonar Navig.150(4), 271–276 (2003)
5. VC Chen, Analysis of radar micro-Doppler signature with time-frequency transforms. Proceedings of the 10th IEEE Workshop on Statistical Signal and Array Processing, Pocono Manor, USA, (2000) pp. 463-466
6. YJ Wu, ZW Xu, J Li. Terahertz Radar Signal for Heart and Breath Rate detection based on time-frequency analysis, Proceedings of the International Conference on Communications, Signal Processing, and Systems, (2012) pp. 523-530
7. WA Chamma, FDTD modeling of a realistic room for through the-wall radar applications in Proc. Workshop Computational Electro-magn.
Time-Domain (2007) pp. 1–4
8. F Ahmad, MG Amin, Autofocusing of through-the-wall radar imagery under unknown wall characteristics. IEEE Trans. Image Process.16(7), 1785–1795 (2007) 9. E Zaikov, J Sachs, M Aftanas, J Rovnakova, Detection of trapped people by UWB radar, in Proc. German Microwave. Conf., Hamburg, Germany, (2008) pp. 1–4
10. LB Liu, Z Liu, B Barrowes, Through-wall bio-radiolocation with UWB impulse radar: observation, simulation and signal extraction. IEEE J. Sel. Topics Appl. Earth Observ.4(4), 791–798 (2011)
11. ZF Zeng, JG Sun, J Li, X Chen, FS Liu, The analysis of TWI data for human being’s periodic motions, inProc. IEEE Int. Geosci. Remote Sensing Symp, 2011, pp. 862–865
12. J Li, ZF Zeng, L Huang, FS Wu, Study of UPML boundary for 3D GPR simulation. Comput Tech. Geophys. Geochem. Exploration
32(1), 6–12 (2010)
13. J Li, ZF Zeng, L Huang, FS Wu, Three dimensional high-order FDTD simulation for GPR. Chinese J. Geophys.53(54), 974–981 (2010) 14. ZF Zeng, JJ Liu, FS Liu, Simulation of GPR in multi-scale heterogeneity
medium by overlapping Yee FDTD method, in Proc. 4rd Int. Conf. Environ. Eng. Geophys., Chengdu, China, 2010, pp. 587–593
15. Y Zhang, T Jiao, H Lv, An interference suppression technique for life detection using 5.75-and 35-GHz dual-frequency continuous-wave radar. IEEE Geosci. Remote Sens. Lett.12(3), 482–486 (2015)
16. J Li, L Liu, Z Zeng, F Liu, Advanced signal processing for vital sign extraction with applications in UWB radar detection of trapped victims in complex environment. IEEE J Sel Top. Appl Earth Observ. Remote Sensing7(3), 783–791 (2014)
17. J Li, Y Pi, Micro-Doppler signature feature analysis in terahertz band. J Infrared Millimeter Terahertz Waves31(3), 319–328 (2010)
18. JC Wiltse, History of millimeter and submillimeter waves. IEEE Trans. Microwave Theory Tech.32(9), 1118–1127 (1984)
19. VC Chen, FY Li, Micro-Doppler effect in radar-phenomenon, model and simulation study. IEEE Trans. Aerosp. Electron. Syst.43(1), 2–21 (2006) 20. VC Chen, H Ling,Time-frequency transforms for radar imaging and signal
analysis. (Artech House, Boston, 2002) pp. 93–104
21. B Barkat, B Boashash, A high-resolution quadratic time-frequency distribution for multicomponent signals analysis. IEEE Trans. Signal Process.
49(10), 2232–2239 (2001)
22. Djurovic, LJ Stankovic, An algorithm for the Wigner distribution based instantaneous frequency estimation in a high noise environment. Signal Process.84(3), 631–643 (2004)
23. B Boashash, LJ Qiu, P O’shea, Automatic time-varying filtering using the Wigner-Ville distribution, Conference on Adaptive and Knowledge Based on Control and Signal Processing, Honolulu, USA (1989)
24. B Boashash, Estimating and interpreting the instantaneous frequency of a signal—part I: fundamentals. Proc. IEEE80(4), 520–538 (1992)
25. NE Huang, Z Shen, SR Long et al., The empirical mode decomposition and Hilbert spectrum for nonlinear and non-stationary time series analysis. Proc. R. Soc. London A454, 903–995 (1998)
26. CJ Cai, WX Liu, JS Fu, et al., Empirical mode decomposition of micro-Doppler signature, 2005 IEEE International Radar Conference, (2005) pp. 895-899
Submit your manuscript to a
journal and benefi t from:
7Convenient online submission
7Rigorous peer review
7Immediate publication on acceptance
7Open access: articles freely available online
7High visibility within the fi eld
7Retaining the copyright to your article