CSEIT1722197 | Received : 25 March 2017 | Accepted : 06 April 2017 | March-April-2017 [(2)2: 661-665]
International Journal of Scientific Research in Computer Science, Engineering and Information Technology © 2017 IJSRCSEIT | Volume 2 | Issue 2 | ISSN : 2456-3307
661
Relevance Feature Discovery for Text Mining Using Feature
Clustering
Mohan I, Ajith Kumar C, Ajith Kumar B, Bhuvanesh S
Department of Information Technology, Prathyusha Engineering College, Anna University, Tiruvallur, Tamil Nadu, India
ABSTRACT
It is difficult to obtain the quality of relevance feature discovery in text mining because of large data patterns. Most existing popular text mining and classification methods have adopted term-based approaches. However, they have all suffered from the problems of polysemy and synonymy. However, pattern-based approaches yields better result than term-based approaches. So, we decided to implement a pattern based approach in our paper. This paper explains about the pattern-based approach in large text patterns. It discovers both positive and negative patterns in text documents as higher level features and deploys them over low-level features (terms). This paper uses Clustering technique to discover the relevant and irrelevant documents. It also classifies terms into categories and updates term weights based on their specificity and their distributions in patterns. Substantial experiments using this model on RCV1, TREC topics and Reuters-21578 show that the proposed model significantly outperforms both the state-of-the-art term-based methods and the pattern based methods.
Keywords : Text Features Classification, Fclustering, Pattern-Based Approach, Term-Based Approach, Feature Discovery.
I.
INTRODUCTION
Data mining is the computational process of discovering patterns in large data sets involving methods at the intersection of artificial intelligence, machine learning, statistics, and database systems. It is an interdisciplinary subfield of computer science. The overall goal of the data mining process is to extract information from a data set and transform it into an understandable structure for further use. Relevance feature discovery (RFD) is to find the useful features available in text documents, including both relevant and irrelevant ones, for describing text mining results. Relevance Feature Discovery is particularly challenging task in modern Information analysis. Examples for Relevance feature Discovery are Business analysis, Medical analysis, and social networking analysis. There are two challenging issues in using pattern mining techniques for finding relevance features in both relevant and irrelevant documents. The first is the low-support problem. Given a topic, long patterns are usually more specific for the
topic, but they usually appear in documents with low support or frequency. If the minimum support is decreased, a lot of noisy patterns can be discovered. The second issue is the misinterpretation problem, which means the measures (e.g., “support” and “confidence”) used in pattern mining turn out to be not suitable in using patterns for solving problems.
In this paper, we have demonstrated pattern-based approaches such as Fclustering and KNN classification model and figured out the accuracy. For In classification, we have implemented KNN model and in Clustering we have used k-means clustering. And we have compared both of the models to find out its accuracy.
II.
METHODS AND MATERIAL
1. DATA
newsgroup documents, partitioned (nearly) evenly across 20 different newsgroups and Reuters-21578, a small one. This Reuter has been distributed into R8 and R57 as different classes. And each class has been categorized into test and train documents. We have used corpus, it is used for analyzing a large set of texts. After collecting the datasets, we need to do preprocessing. It includes removable of step words, whitespace and punctuation.
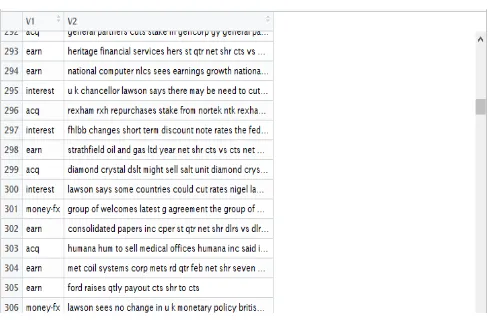
Figure 1. Importing datasets in R
Fig.1 shows importing different datasets in R, which contains so many documents. In some cases, duplicated values may occur, we should remove them.
2. IMPLEMENTATION OF CLUSTERING AND
CLASSIFICATION
Clustering is the main task in Feature Extraction. Clustering is the division of data into groups based on the similarity. There are many clustering techniques such as K-means, Hierarchical algorithms, DBSCAN, Fuzzy clustering, etc. We have used K-means Clustering technique.
A. K-means Clustering
K-means clustering aimsto partition n observations into k clusters in which each observation belongs to the cluster with the nearest mean, serving as a prototype of the cluster. After defining the number of clusters, we need to decide the clustering procedure to group the students. We have used K-means Clustering procedure in this paper. For K-means clustering, we have used R8 datasets. Now we have a data frame where a row represents a document with one column containing the document text (V2) and another column containing the tag for the topic (V1).
## earn acq trade ship grain crude interest money-fx
Figure 2. Tags of R8 datasets.
Fig.2 represents the tags of R8 datasets. Our dataset contains 5,485 documents. This is good - especially for supervised analysis - because we will have plenty of documents on which to base our model. In the interest computational expense, let’s limit to three of the document tags: trade, crude, and money-f. Now it contains 710 documents. Before applying K-means clustering, we need to create a Term document matrix. Term Document matrix refers to the frequency of terms that has occurred in a set of documents. At this point, we could just move on to our clustering with this matrix, but we will instead create a weighted T-Ida version of the matrix. This method - short for term-frequency/inverse-term-frequency - takes into account how often a term is used in the entire corpus as well as in a single document. The logic here is that if a term is used in the entire corpus frequently, it is probably not as important when differentiating documents. Alternatively, if a word appears rarely in the corpus, it may be an important differentiation even if it only occurs a few times in a document. Finally, we will normalize the T-Ida scores by Euclidean distance. Now we can run the k-means algorithm. The only thing that we need to specify is the number of centroids in the model. In our case, we know that there are 3 different groups.
From fig.3, we can see that documents 1 through 5 are all in cluster 3. We have 52 documents in cluster 1, 266 documents in cluster 2, and 392 documents in cluster 3. To know, which documents have been grouped together, we need to put the results of clustering in the table and generate a graph to show which documents have been grouped.
Figure 4. Table of cluster results as predicted, actual and counter
From fig 4, we can 98% of the documents in cluster 1 pertain to money-f, 72% of the documents in cluster 2 pertain to trade, and 64% of the documents in cluster 3 pertain to crude. On average, roughly 78% of the documents in each cluster correspond to the “correct” tag. Again, whether or not this is sufficiently accurate depends on your application. If you want to review only documents pertaining to money-f, you would be well served by looking at cluster 1. If, however we are only interested in looking at documents about crude, you would get a lot of documents in cluster 3 that are about other topics.
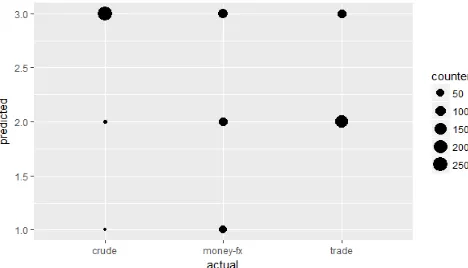
Fig.5 represents the plotting of clustering result. From this, we can distinguish the relevant and irrelevant documents of R8 datasets. This has been applied to both train and test datasets. Implementation of k-means cluster on R52 and newsgroup also yields the same kind of results. K-means basically tries to cluster the individuals in a dataset by comparing them across many variables. In the text mining case, these variables come from word frequencies. Thus it clusters into three groups, number of cluster is decided by the documents we need. It can be changed anytime.
Figure 5. Plotting of clustering result
B. Classification : KNN model
Document classification is used to classify documents into one or more classes or groups by manually or algorithmically. In this paper, we have chosen to classify algorithmically. Document classification comes under Supervised Machine learning Technique, where as clustering refers to Unsupervised Machine Learning methodology. By using a several text documents called Corpus as inputs, we have created a machine learning model and the output will be generated as different classes/categories. The model thus generated will be able to classify into classes when a new text is supplied.
In pattern recognition, the k-nearest neighbors algorithm (k-NN) is a non-parametric method used for classification and regression. In both cases, the input consists of the k closest training examples in the feature space. Initially, we need to import tm and plyr packages to start our document classification. Corpus is a collection of large and structured set of texts. We have chosen three datasets such as “R57, R8, and 20 newsgroups”. Now the created corpus needs to be preprocessed before we use the data for the next step. Preprocessing involves removal of duplicate values, tab space, punctuations, white spaces, Stop words refers to as is, the, for, etc. And if any duplicated values occur, we need to remove them.
Before applying the KNN model, we need to create a term document matrix. This step involves creation of Term Document Matrix, where frequent terms can be collected. We can extract the input feature words by removing the sparse terms. By randomizing and dividing the Features & Labels data into Training (70%) & Test data (30%) , we can create our model.
Figure 6. Accuracy on Test Data
From fig.6&7, we can conclude that the actual and predicted the value of three datasets. Now that the model is created, we have to test the accuracy of the model using the test data. The accuracy obtained for test data and train data are 78 and 71 respectively.
3. COMPARISON OF TWO MODELS
After clustering and classified the documents into relevant and irrelevant documents, we need to compare both of them in terms of its efficiency and accuracy. Since we have used pattern-based approach, this paper focuses on KNN-model and Feature clustering Technique.
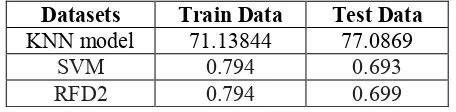
Datasets Train Data Test Data
KNN model 71.13844 77.0869
SVM 0.794 0.693
RFD2 0.794 0.699
Figure 8. Comparison of three models
From fig.8, we can conclude that KNN model is the best model, when it comes to classify the document. As it scores 77% accuracy, KNN model seems to be more suitable model in this paper, when it comes to classification. In clustering, it separates into train and test data before itself but in classification we need to create those two models.
K-means clustering shows that it is the best result when we need to distinguish the documents we need. It compromises the technique of term-based approach. Before classifying the documents, we need to analyze which method or algorithm will be suitable to classify the documents.
III.
RESULTS AND DISCUSSION
Implementation of KNN model and k-means shows that pattern-based approach is more efficient than term-base approach and it avoids the problem of polysemy and synonymy. Algorithm FClustering describes the process of feature clustering, where DPþ is the set of discovered patterns of Dþ and DP_ is the set of discovered patterns of D_. All terms that is not the elements of positive patterns are assigned to category T_. For the remaining m terms, each is viewed as a single cluster in the beginning. And from this, we can see that KNN model is the best model for the dataset we have chosen and Kmeans clustering serves as the best when we want to classify the documents in certain groups. The most frequently occurring words and less frequently occurring words are shown in the clustering process. Algorithm Fclustering is similar to K-means clustering, hence we have moved for K-means clustering technique.
IV. CONCLUSION & FUTURE WORK
The research proposes an alternative approach for relevance feature discovery in text documents. It presents a method to find and classify low-level features based on both their appearances in the higher-level patterns and their specificity. It also introduces a method to select irrelevant documents for weighting features. In this paper, we continued to develop the RFD model. As a future work, we are looking for the best model and more accuracy on long-patterns and to avoid noisy data in the datasets.
We have concluded that pattern-based approach yields a better result and accuracy. It discovers both positive and negative patterns in text documents as higher level features and deploys them over low-level features (terms).It also classifies terms into categories and updates term weights based on their specificity and their distributions in patterns. Hence, both supervised and unsupervised technique shows different analysis, we must wisely choose the method before classifying the documents.
V.
REFERENCES
optimization," in Expert Syst. Appl.,vol. 36, pp. 6843–6853, 2009.
[2]. Algarni and Y. Li, "Mining specific features for acquiring user information needs," in Proc. Pacific Asia Knowledge Discovery Data Mining, 2013, pp. 532–543.
[3]. Algarni, Y. Li, and Y. Xu, "Selected new training documents toupdate user profile," in Proc. Int. Conf. Inf. Knowl. Manage., 2010, pp. 799–808. [4]. N. Azam and J. Yao, "Comparison of term
frequency and documentfrequency based feature selection metrics in text categorization,"Expert Syst. Appl., vol. 39, no. 5, pp. 4760–4768,2012. [5]. R. Bekkerman and M. Gavish, "High-precision
phrase-based document classification on a modern scale," in Proc. 11th ACM SIGKDD Knowl. Discovery Data Mining, 2011, pp. 231– 239.
[6]. Blum and P. Langley, "Selection of relevant features and examples in machine learning," Artif. Intell., vol. 97, nos. 1/2, pp. 245–271, 1997.
[7]. For a business perspective on data mining and analytics, without technical detail, see Competing on Analytics: The New Science of Winning by Thomas H. Davenport and Jeanne G. Harris. [8]. Introduction to Information Retrieval by