Two Phase Flow in Three Dimensional
Multigrid Model
Himanshu Sharma 1, Mukesh Pandey 2
P.G. Student, Department of Chemical Engineering, ITM University, Gwalior, Madhya Pradesh, India1 Professor, Department of Civil Engineering, ITM University, Gwalior, Madhya Pradesh, India2
ABSTRACT: In this paper we will study the two phase flow in a porous medium through stimulating the two dimensional model. The incompressible flow of water through boundary, in the porous medium filled with oil has been studied with modeling and simulation of two phase fluid and three dimensional grid. The parameters affecting the flow of fluid in porous medium like permeability , porosity and other geophysical or petrophysical data are considered partially with the barmer basin. we make model of cartesian structured grid with boundary condition, and stimulate using the MATLAB Reservoir Simulation Toolbox ‘MRST’ an open- source framework. This study contains the formulation of structured three dimensional grid with boundary condition and solution of the two phase pressure equation over fine and coarsen grid. The effect of the coarsening of the grid has been compared with fine grid and the results are visualized in the form of different grid figure, further coarsened grid refined on the basis of the high flow zone and low flow zone. In this model two- phase, two- dimensional pressure equation solved using ‘ two point ‘two-point flux approximation’, TPFA option provided within incompressible module of software.
KEYWORDS: structured grid, incompressible, two phase, three dimensional, TPFA, coarsen
I. INTRODUCTION
In petroleum reservoir the consideration of multiphase flow of reservoir fluids are highly expected,but analytical solutions of these multiphase flow are very complex and tedious, therefore Numerical simulation has become a common means of predicting and understanding complex performance of oil and gas reservoirs in the petroleum industry.
The development of a reservoir by water injection usually includes an oil-water 2-phase flowing in porous media (reservoir rock). The efficiency of development by water injection is closely related to the multi-phase flow-in porous media which is dependent on rock permeability, pore structure, wettability, capillary pressure, interfacial tension, viscosity of fluid and relative permeability of each phase.
A mathematical model of a physical system is a set of partial differential equations, together with an appropriate set of boundary conditions, which we believe adequately, describes the significant physical processes taking place in that system.
Geological model helps us to predicts the generation, distribution, migration and volumes of the reservoir. The prediction of hydrocarbon phase and volume distribution in prospects from basin models, incorporating geological risks in the play. These models are based on an understanding of basin evolution & heat flow, and stratigraphy & facies distributions.
The multigrid technique is becoming popular in the field of the computational fluid dynamics,because of its enhanced convergence. The multigrid method is to carry out the early iteration on the fine grid and then progressively transfer these result to the series of coarser grid, since coarser grid have fewer grid points, fewer calculation are needed, which results is saving of time of computing ultimately saves capital,
II. GEOLOGICAL MODELING
Geocellular models are used to generate a realization of subsurface reservoirs, which represent rock properties such as porosity, permeability and hydrocarbon saturation in the context of the overall structure and architecture of the reservoir.
Grid Formulation :we make model of dimension 100*60*20 meter grid having 50*30*10 cells. This is a regular Cartesian grid with a resolution of 2 meter, means each cell of the grid having dimension of 2*2*2 meter. The boundary condition of 200*barsa are applied to left side of the grid in term of the pressure.
Figure 1 : Cartesian Grid showing dimension
Permeability :Permeability is a measure of the ability of the medium to let fluids pass through it. Permeability may vary over several orders of magnitude within the same reservoir, and even over short distances. This could be the case in an intersection between two faces with different physical properties, or in a fault or fracture. In barmer basin it varies from 1D to 10 D , average viscosity is taken as 5 Darcy.[2]
A medium is said to be isotropic when the permeability can be written as a scalar function. Conversely, a medium where this is not the case is said to be anisotropic. The permeability is in many ways the most important quantity in reservoir modeling because this is the quantity that has the strongest influence on the fluid flow. In this model permeability is lognormal and anisotropic as values has been assigned to different layers but with repeating order and varies in the range of 300 milli-darcy to 500 milli-darcy.
Porosity :The porosity of the reservoir is defined as the void space present in the reservoir. this unitless fraction gives the estimation of the fluid filled in the reservoir. In the barmer basin the Upper formation dominated by sinuous, meandering, fluvial channel sands and the Lower formation consisting of well-connected sheetflood and braided channel sands..The sand properties are excellent, with porosities in the range of 21-28% [2], the average value is taken as 0.25.
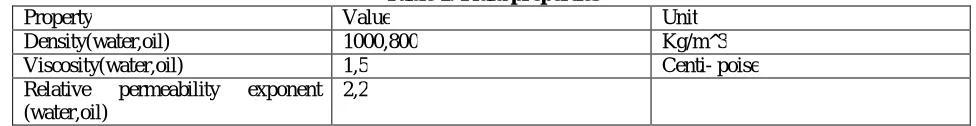
Reservoir Fluid : The properties of the fluid associated with reservoir are defined by calling the function ‘initFluid’. This function gather the fluid data in matrix form and update the geophysical model, so solver could solve the flow equation. The two phase fluid data consist of the viscosity, density and exponent of relative permeability, values are given in table 2.
Table 1: Fluid properties
Property Value Unit Density(water,oil) 1000,800 Kg/m^3 Viscosity(water,oil) 1,5 Centi- poise Relative permeability exponent
(water,oil)
III. GRID COARSENING
The multigrid method is associated with the interchange damping of numerical errors thorugh the flow field. The coarsening of grid is under the scheme of the multigrid partition the grid into smaller block, these blocks are group of the cells of the parent grid.[5]
Coarsening process is to consider a geological feature or to obtain less irregular grid in region where high resolution of flow is not necessary. The coarsened grid is to optimize the accuracy of the transport equation and adapted to the flow pattern predicted by the pressure equation
Upscaling : Upscaling is the process to map the coarse grid on the fine grid. The properties defined on the fine grid should be imposed on the coarse grid or the coarse grid should have indentical properties of the fine grid otherwise the simulation not gives the accurate results. Upscaling update the coarse grid with properties of fine grid. A proper coarse-scale reservoir model should ideally capture the impact of heterogeneous structures at all scales that are not resolved by the coarse grid used for flow simulation.[12]
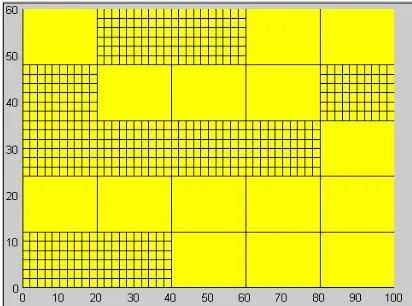
Figure 2: Coarsen Grids showing blocks after partition of fine Grid
Refining : In reservoir simulation , solving saturation equations on the coarse scale may be too inaccurate and solving it on the fine grid could be too costly, so the method which compromise between accuracy and computational speed is the need of the hour . To introduce the grid having properties of fine grid and takes less time than fine grid, the multiscale approach is used.
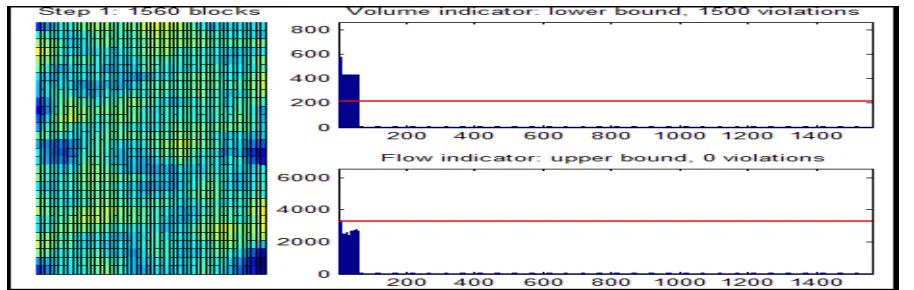
Figure 3 : Grid refining through permeability indicator
0 50 100
0 10 20 30 40 50 60
A fter P art ition (Tot al bloc k s : 75)
0 50 100
0 10 20 30 40 50 60
In multiscale method,to optimize the accuracy of a pressure ortransport equation calculation, the coarsened grid should generally adapt to the flow patterns predicted by the different indicator based on flow solver or permability. In this model we have used the permeability indicator which maps the high and low flow zones in the reservoir. In a permeability based indicator method, the grid is aligned to capture high-flow regions and (clearly) distinguish between regions of high and low flow.[6]
Fig.(3) shows that the permeability indicator finds the 1500 violation, means these are cells are obove the upper bound limit set for the flow, these blocks are identified as a high flow zone and will be subjected to partition into smaller cells. The block under lower limit will remain as coarser block. new grid formed after coarsen geometry can be seen in the fig.4. This process of refining can be repeated until getting satisfied resolution.
Flow Equation : Here,we consider the two point flux approximation scheme, ‘TPFA’ .The two-point scheme approximates the flux across a cell face in terms of the difference in pressure between the centers of the adjacent cells.[3]‘TPFA function assembles and solves a (block) system of linear equation defining interface fluxes and cell pressures at the next time step in a sequential splitting scheme for the reservoir simulation problem defined by Darcy's law and a given set of external influences (wells, sources, and boundary conditions).[3] The pressure equation gives the Darcy velocities v and pressure p for a given water saturation field s:
=− ( ) , . = [12]
The pore scale modeling provides very good agreement between experimental and numerical results for two- and three-phase flow in relatively homogeneous porous media [8,9]. High-resolution and multi-scale pore-network geometries can now be constructed to model flow and transport processes in realistic but challenging geometries [10,11] To overcome this limitation, dynamic pore network models are being developed, and first promising results show that the classical Buckley Leverett profile can be recovered directly from the pore-scale [7].
Figure 4 : Refined Grid showing coarsen blocks and refined blocks
IV. RESULT AND DISCUSSION
Figure 5 : Permeability of different Grids
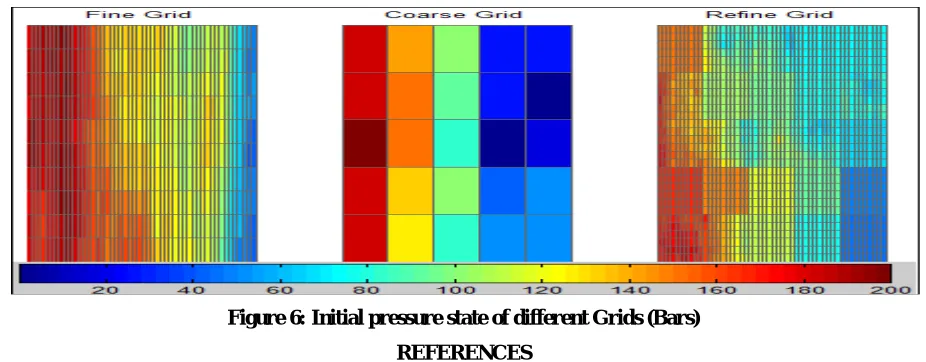
Time taken to solve pressure equation on the fine grid, coarse grid and refine grid is 0.015994, 0.000382, 0.015255 second respectively. The fine grid provides high resolution of upper flow zones and low resolution to lower flow zones, therefore it takes less time for simulation. The coarse grid takes lesser time than fine grid but not provides clear map of flow zone, whereas refine grid which is the advanced form of coarse grid solves our purpose by depicting every zone apparently and also saves computing time by taking 0.000739 second less time than fine grid.
In this paper we have studied the multi-grid approach through Cartesian grid. The result shows that multi-grid approach saved computing time while giving the same resolution as fine grid has. This method will be proved a better tool in the future with the advancement of complex geometry procedures.
Figure 6: Initial pressure state of different Grids (Bars)
REFERENCES
[1]‘Optimized Field Development Through Integrated Reservoir Characterization’, Technical-Brochure-Reservoir-Development, Cairn India Ltd. [2] ‘Exploration Excellence from Frontiers to Mature Basins’, Technical-Brochure-Exploration Excellence, Cairn India Ltd.
[3]Knut-Andreas Lie,An Introduction to Reservoir Simulation Using MATLAB ,User Guide for the Matlab Reservoir Simulation Toolbox (MRST),May 27, 2014, http://www.sintef.no/Projectweb/MRST
[4] Halvor M. Nilsen, K.–A. Lie, SPE, and Jostein R. Natvig, Accurate ‘Modeling of Faults by Multipoint, Mimetic, and Mixed Methods’, SINTEF ICT
[5] JohnD.Anderson,jr ‘COMPUTATIONAL FLUID DYNAMICS A Basics with Aplication’.
[7] Idowu NA, Blunt MJ. Pore-scale modelling of rate effects in waterflooding. Transp Porous Media 2010;83(1):151–69. The paper develops rate dependent network model that takes viscous forces into account and is the first pore-scale study to reproduce a Buckley–Leverett profile on a model with 100,000 of pores.
[8] Lopez O, Mock A, Skretting J, Petersen Jr E, Øren P, Rustad A. Investigation into the reliability of predictive pore-scale modeling for siliciclastic reservoir rocks. . Paper SCA2010-4Society of Core Analysts Symposium; 2010.
[9] Al-Dhahli A,Geiger S, van DijkeMIJ. Three-phase pore-networkmodelling formixedwet carbonate reservoirs. . SPE-147991SPE Reservoir Characterization and Simulation Conference. Abu Dhabi, U.A.E. 9-11 October., 2011; 2011.
[10] Biswal B, Øren PE, Held RJ, Hilfer R. Modeling of multiscale porous media. Image Anal Stereol 2009;28:23–34.
[11] Latief FDE, Biswal B, Fauzi U, Hilfer R. Continuum reconstruction of the pore scale microstructure for Fontainebleau sandstone. Phys A Stat Mech Appl 2010;389(8): 1607–18.