ABSTRACT
ATWELL, RACHEL ANNE. Optimizing Short-term Cover Crop Benefits through Genotype Screening and Management (Under the direction of Dr. S Chris Reberg-Horton.)
Three studies were conducted investigating winter pea genotypes for grain, forage,
and cover crop use in the Southeast USA. Three additional studies were conducted to
investigate herbicide-resistant weed management using cover crop mulches and XtendFlexTM cotton.
The first study investigated winter pea grain potential. Nineteen winter pea genotypes
were planted in monoculture and in mixture with three wheat genotypes with differing
maturities. The growth of only one pea genotype was severely inhibited by cold. Disease
incidence was influenced by pea genotype but not growth in monoculture or mixture with
wheat. Pea yield was affected by pea genotype but not growth in monoculture or mixture
with wheat. Pea yield was greater with early maturing varieties; grain potential across all pea
genotypes was likely restricted by heat during flowering.
The second study screened eighteen pea genotypes for forage and cover crop
production and compared these genotypes to crimson clover and hairy vetch. All legume
genotypes were harvested across four timings to understand the influence of maturity on
biomass and quality. Legume cold tolerance, disease incidence, biomass production, quality,
and N release were estimated. At the North Carolina environments, several pea genotypes
produced similar biomass to crimson clover and hairy vetch across harvest timings. The pea
genotypes varied considerably for quality traits, including protein, lignin, and cellulose.
Relative forage quality declined as biomass harvest was delayed, and was generally higher
variation in the pea genotypes screened for biomass and quality; this variation could be
utilized in breeding efforts to enhance pea production in the region.
The third study investigated five pea genotypes, one crimson clover cultivar, and one
hairy vetch cultivar in mixture with barley, oats, and wheat for cover crop potential. Legume
cold tolerance, legume disease incidence, species competition, and species biomass
production were estimated. Oats were more competitive in mixture with the legume
genotypes than barley or wheat. At the Coastal Plain environments where soil residual N is
generally low, all legume species dominated the cover crop mixture. Winter pea produced
similar biomass in mixture as crimson clover and hairy vetch. At the Maryland and Piedmont
environments where residual N is generally higher than in the Coastal Plain, the small grain
dominated the cover crop mixture. Hairy vetch was the most competitive legume with the
small grains across environments and dominated the cover crop mixture; crimson clover and
winter pea produced a more homogenized cover crop mixture when grown with the small
grains. The variability in total biomass composition across environments in this study
demonstrates the importance of site specific cover crop seeding rate recommendations for
production in mixture.
The fourth study investigated weed management in cotton using a cereal rye and
crimson clover cover crop mulch. The cover crop biomass achieved did not provide
season-long weed control in the absence of herbicide use. Cotton emergence declined when cotton
was planted directly into standing cover crop and without row cleaners engaged. The
presence of a cover crop always reduced soil temperature and increased soil moisture
were used, indicating that conventional producers have flexibility in terminating cover crops
and residue management at cotton planting.
Two additional studies were conducted to investigate rescue Palmer amaranth control
in XtendFlexTM cotton using glufosinate and dicamba. Rescue Palmer amaranth control in XtendFlexTM cotton is possible; a co-application of dicamba and glufosinate had greater efficacy on >10 cm Palmer amaranth than either chemistry alone and is preferable for
© Copyright 2017 by Rachel Anne Atwell
Optimizing Short-term Cover Crop Benefits through Genotype Screening and Management
by
Rachel Anne Atwell
A dissertation submitted to the Graduate Faculty of North Carolina State University
in partial fulfillment of the requirements for the Degree of
Doctor of Philosophy
Crop Science
Raleigh, North Carolina 2017
APPROVED BY:
________________________________ ________________________________
Dr. S. Chris Reberg-Horton Dr. Alan York
Chair of Advisory Committee
________________________________ ________________________________
Dr. Miguel Castillo Dr. Katie Jennings
________________________________ ________________________________
ii
DEDICATION
I would like to dedicate this thesis to the growers in the Southeast; we hope some of
this information can simultaneously enhance the profitability and environmental
sustainability of your operations. I would also like to dedicate this thesis to my parents,
whose hard work and love have provided me with abundant opportunities to pursue my
professional goals, my supportive husband, and all the faculty members at the University of
iii
BIOGRAPHY
Rachel Anne Atwell was raised in Geneseo, IL. Upon high school graduation in 2008,
she attended the University of Illinois Urbana-Champaign. She graduated from the
University of Illinois in May 2012 with a Bachelor’s Degree in Natural Resources and
Environmental Sciences and a minor in Crop and Soil Science. In July 2012, she moved to
Raleigh, NC and began her graduate studies in the Crop Science Department at North
Carolina State University under the advisement of Dr. S. Chris Reberg-Horton. Rachel
completed her M.S. degree in 2015, with a thesis entitled ‘Alternative Mechanisms for Weed
Control and Fertility Management in Organic Canola and Corn Production.’ Rachel
completed a U.S. Borlaug Graduate Student Fellowship from October 2014 to April 2015 at
the University of Costa Rica in San Pedro; this research investigated allelopathic expression
in commercial rice for control of red rice with the end goal of releasing weed-suppressive
rice varieties. Rachel continued at North Carolina State University in the Crop and Soil
Science department pursuing a Ph.D. beginning in May 2015 under the advisement of Dr. S.
iv
ACKNOWLEDGMENTS
I would like to express gratitude to my advisor, Dr. Chris Reberg-Horton, for
providing guidance and an abundance of opportunities; your emphasis on collaboration, your patience, generosity, and innovative approaches to addressing research questions are
benchmarks to which young professionals can aspire. I feel extremely fortunate to have had the opportunity to work in your research program. Sincere appreciation is also extended to Dr. Alan York for exposing me to very relevant technology and weed management
challenges in conventional systems. I am grateful for the diverse extension experiences I acquired as a product of your mentorship; these experiences enriched my graduate student education. In has been an honor to work with Dr. Steven Mirsky throughout graduate school; your leadership and passion for agricultural research have been a great example. To my other committee members, Drs. Miguel Castillo, Katie Jennings, and Paul Murphy, thank you for your guidance and time serving on the committee.
I have been fortunate to work with excellent technical staff throughout graduate school; this has undoubtedly contributed to my success as a graduate student. Carrie Brinton, Rick Seagroves, and Sarah Seehaver, thank you for everything you do. I would also like to extend my thanks to the following folks for their help with this research: Carter Askew, Trace Buck, Charlie Cahoon, Esleyther Inoa, Shannon Koss, Alex May, Tomas Moreno, Cheryl Odametey, Megan Poskaitis, Cole Smith, and Manuel Umana. The research station staff at the Caswell Research Farm, Central Crops Research Station, Peanut Belt Research Station, Piedmont Research Station, and the Upper Coastal Plain Research Station have been fantastic to work with; we are fortunate in North Carolina to have a diverse set of research stations where we can conduct research. I would also like to thank the Cox and Parker families for hosting on-farm research trials. Several funding agencies have supported this research including the North Carolina Cotton Producers, the North Carolina Dairy
Foundation, and the Southern SARE Graduate Student Grant.
v
TABLE OF CONTENTS
LIST OF TABLES………viii
LIST OF FIGURES………xi
CHAPTER I Winter Pea Genotype Screening for Grain Crop Potential in the Southeast USA……...1
ABSTRACT……….2
INTRODUCTION………...3
MATERIALS AND METHODS………....6
RESULTS AND DISCUSSION………10
REFERENCES……….……….15
CHAPTER II Differences among Eighteen Winter Pea Genotypes for Forage and Cover Crop Use in the Southeast USA.………25
ABSTRACT………...26
INTRODUCTION……….27
MATERIALS AND METHODS………..30
RESULTS AND DISCUSSION………36
REFERENCES……….……….46
vi
ABSTRACT………65
INTRODUCTION……….66
MATERIALS AND METHODS………..69
RESULTS AND DISCUSSION………73
REFERENCES………..……….83
CHAPTER IV Implications of Cereal Rye/Crimson Clover Management for Conventional and Organic Cotton Producers………97
ABSTRACT………98
INTRODUCTION……….99
MATERIALS AND METHODS………102
RESULTS AND DISCUSSION………..107
REFERENCES……….………...115
CHAPTER V Effect of Delayed Dicamba plus Glufosinate Application on Palmer Amaranth (Amaranthus palmeri) Control and XtendFlexTM Cotton Yield……….…………..132
ABSTRACT………..133
INTRODUCTION………...134
MATERIALS AND METHODS………137
RESULTS AND DISCUSSION………..141
vii
CHAPTER VI
Glufosinate plus Dicamba for Rescue Palmer Amaranth (Amaranthus palmeri) Control
in XtendFlexTM Cotton………..….……154
ABSTRACT………155
INTRODUCTION………..156
MATERIALS AND METHODS………...159
RESULTS AND DISCUSSION……….163
viii
LIST OF TABLES
Chapter I
Table 1. Attributes for pea genotypes………..17
Table 2. Dates for plot establishment, data collection, and plot harvest……….18
Table 3. ANOVA for the effect of pea genotype (G) and growth in monoculture or mixture with wheat (M) and their interaction on cold tolerance, disease incidence, pea yield, and wheat yield at individual environments………...19
Table 4. Pea disease incidence by genotype averaged over growth in monoculture or mixture at individual environments………...20
Table 5. Pea grain yield by genotype averaged over growth in monoculture or mixture at each environment……….21
Chapter II
Table 1. Dates for planting and biomass harvest……….49
Table 2. Attributes for each pea genotype………...50
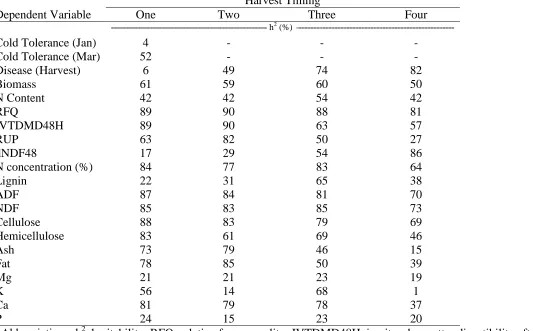
Table 3. Broad sense heritability (h2) among pea genotypes estimated on an entry-mean basis in a combined analysis of all environments……….…51
Table 4. Legume cold injury in January and March at individual environments………52
Table 5. Legume disease incidence as affected by pea genotype at individual
environments………53
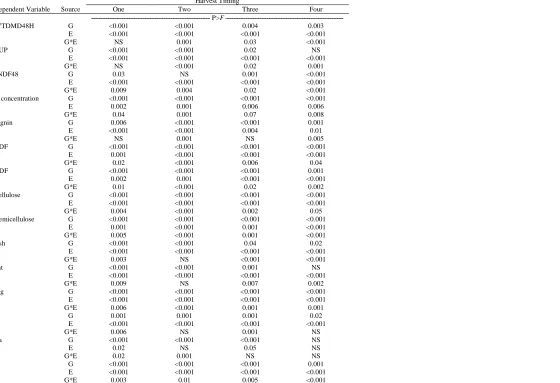
Table 6. ANOVA for the effect of legume genotype (G), environment (E), and the legume genotype by environment (G*E) interaction on biomass and N content in a combined
analysis of the North Carolina and Maryland environments………...54
Table 7. Legume biomass and N content combined over the North Carolina and Maryland environments………55
ix
Table 9. Lignin, cellulose, ADF, and NDF across biomass harvest timings in a combined analysis of all environments………57
Table 10. Predicted cover crop N release as affected by legume genotype from a combined analysis of the North Carolina environments across four harvest timings………58
Chapter III
Table 1. Characteristics for each legume genotype………86
Table 2. Dates for planting and biomass harvest………87
Table 3. Cold tolerance by legume genotype presented at individual environments……….88
Table 4. Legume disease at harvest as affected by legume genotype and small grain species at individual environments………..89
Table 5. The ANOVA results for the effects of legume genotype (LG), small grain (SG), and their interaction on mixture composition in January, March, and May at the Clayton and Kinston 2016 environments……….90
Table 6. The ANOVA results for the effects of legume genotype (LG), small grain (SG), environment (E) and the relevant interactions on legume biomass, small grain biomass, and total mixture biomass by region (Coastal Plain, Maryland, Piedmont)………...91
Chapter IV
Table 1. Dates for cover crop and cotton management at individual environments……...119
Table 2. Cover crop residue management treatment description………...120
Table 3. Dominant weed species at each environment………..121
Table 4. Fertilized dry cover crop biomass, cover crop dry biomass, and cover crop C:N ratio by environment………..122
Table 5. Crimson clover regrowth as affected by cover crop residue management and
herbicide use at individual environments………..123
x
Table 7. ANOVA results for the effect of cover crop residue management (M) on weed coverage and weed biomass at individual environments and ANOVA results for the effect of cover crop residue management (M), herbicide use (H), environment (E) and the relevant interactions on cover crop regrowth, cotton height, and cotton lint yield at individual
environments………..126
Table 8. Weed coverage and weed biomass as affected by cover crop residue management in the absence of herbicide use at individual environments………...127
Table 9. Cotton height and cotton lint yield as affected by cover crop residue management and herbicide use at individual environments………128
Chapter V
Table 1. Soil characteristics by environment………148
Table 2. Cotton planting, herbicide application, and cotton harvest dates by environment..149
Table 3. Cotton growth stage and Palmer amaranth height at first POST application, averaged over environments………..150
Chapter VI
Table 1. Soil characteristics by environment……….174
Table 2. Cotton planting, herbicide application, and cotton harvest dates by environment..175
Table 3. Palmer amaranth control and biomass as affected by glufosinate and dicamba
applied POST……….176
Table 4. Cotton height and nodes as affected by glufosinate and dicamba applied
POST………..177
xi
LIST OF FIGURES
Chapter I
Figure 1. Pea yield in monoculture regressed on pea yield in mixture (averaged over wheat maturity). Treatment means are combined over four environments for each pea genotype (Clayton 2015, Clayton 2016, Salisbury 2015, and Salisbury 2016)………...22
Figure 2. (a) Effect of flower timing on pea yield (averaged over growth in monoculture and mixture). Pea genotypes were ranked for flower timing from one through nineteen to perform the regression analysis. Treatment means are combined across four environments (Clayton 2015, Clayton 2016, Salisbury 2015, and Salisbury 2016) and represent individual pea genotypes. P values characterize the linear relationship of flower timing and pea yield (P<0.001). (b) Effect of disease incidence on pea yield (averaged over growth in monoculture and mixture). Treatment means are combined across four environments (Clayton 2015, Clayton 2016, Salisbury 2015, and Salisbury 2016) and represent individual pea genotypes. P value characterizes the linear relationship of disease incidence and pea yield (P<0.001). c) Effect of pea biomass (averaged over growth in monoculture and
mixture) on pea yield (averaged over growth in monoculture and mixture). Treatment means are combined across four environments (Clayton 2015, Clayton 2016, Salisbury 2015, and Salisbury 2016) and represent individual pea genotypes. P value characterizes the linear relationship of pea biomass and pea yield (P<0.001)………..23
Figure 3. Effect of wheat yield (averaged over wheat maturity) on pea yield in mixture (averaged over wheat maturity). Treatment means combined over two environments (Salisbury 2015 and Salisbury 2016) and represent individual pea genotypes. P value
characterizes the linear relationship of wheat yield and pea yield (P<0.001)……….24
Chapter II
Figure 1. Biomass production across harvest timing as affected by legume genotype in a combined analysis of the North Carolina environments………..59
Figure 2. Biomass production across harvest timing as affected by legume genotype in a combined analysis of the Maryland environments………..60
Figure 3. Variation in N content as affected by legume genotype in a combined analysis of the North Carolina and Maryland environments……….61
Figure 4. Relative forage quality (RFQ) across harvest timings compared between the early, mid, and late maturing pea genotype groups and crimson clover and hairy vetch in a
xii
Figure 5. Predicted N release from the highest biomass producing pea, highest N
concentration pea, highest lignin concentration pea, crimson clover, and hairy vetch in a combined analysis of the North Carolina environments………..63
Chapter III
Figure 1. Legume and small grain biomass estimates obtained visually in January, March, and May at the Clayton and Kinston 2016 environments averaged over legume genotype. Means are compared between small grain species and are significantly different at P≤0.05
based on Fisher’s Protected LSD……….92
Figure 2. Legume and small grain biomass estimates obtained visually in January, March, and May at the Clayton and Kinston 2016 environments averaged over small grain species. Means are compared between legume genotypes and are significantly different at P≤0.05
based on Fisher’s Protected LSD……….93
Figure 3. Total mixture cover crop biomass as affected by legume genotype and small grain in a combined analysis of the Coastal Plain environments (Clayton 2016, Clayton 2017, Kinston 2016, Rocky Mount 2017). Means are compared across all mixtures and means followed by the same letter are not significantly different at P≤0.05 based on Fisher’s
Protected LSD………..94
Figure 4. Total mixture cover crop biomass averaged over small grain species as affected by legume genotype and legume biomass averaged over small grain species as affected by legume genotype in a combined analysis of the Maryland environments (Beltsville North 2016, Beltsville South 2016, and Beltsville South 2017). Means are compared across all mixtures and means followed by the same letter are not significantly different at P≤0.05
based on Fisher’s Protected LSD……….95
Figure 5. Total mixture cover crop biomass averaged over small grain species as affected by legume genotype and legume biomass averaged over small grain species as affected by legume genotype at the Piedmont environment (Salisbury 2017). Means are compared across all mixtures and means followed by the same letter are not significantly different at P≤0.05
based on Fisher’s Protected LSD……….96
Chapter IV
xiii
Abbreviations: Roll, rolled cover crop; RC, row cleaner; F, fertilized; Stand, standing cover crop; BARE, no cover crop………130 Figure 2. Soil temperature and moisture as affected by cover crop residue management for a combined analysis of four environments (Clayton 2016, Lewiston 2016, Rocky Mount A 2016, Rocky Mount B 2016) and soil temperature as affected by cover crop residue
management and soil moisture as affected by cover crop residue management and herbicide use at Lewiston 2015. Means followed by the same letter are not significantly different at
P≤0.05 based on Fisher’s Protected LSD. Abbreviations: Roll, rolled cover crop; RC, row
cleaner; F, fertilized; Stand, standing cover crop; BARE, no cover crop; H, herbicide
use………..131
Chapter V
Figure 1. Palmer amaranth control 14 d after first POST (A) and 14 d after second POST (B) application as affected by delay in the first POST application of dicamba (560 g ha-1) plus glufosinate (880 g ha-1). Treatment means are combined across six environments and reported using least square means. Vertical lines are ± one standard error. P-values characterize the linear relationship of delayed timing of first POST application on Palmer amaranth control 14 d after first POST (p<0.001) and 14 d after second POST application
(p<0.001)………....151
Figure 2. Cotton stunting at layby (A), cotton nodes at layby (B), cotton height at layby (C), and cotton height 21 d after layby (D) as affected by delay in the first POST application of dicamba (560 g ha-1) plus glufosinate (880 g ha-1). Treatment means are combined across six environments for cotton stunting and cotton height at layby and over five environments for cotton nodes at layby and cotton height 21 d after layby. Treatment means are reported using least square means. Vertical lines are ± one standard error. P-values characterize the linear relationship of delayed timing of first POST application on cotton stunting (p<0.001), cotton height at layby (p<0.001), cotton nodes at layby (p<0.001), and cotton height 21 d after layby
(p<0.001)………....152
1
Chapter I
Winter Pea Genotype Screening for Grain Crop Potential in the Southeast USA
Rachel A. Vann1, S. Chris Reberg-Horton1, Miguel S. Castillo1, Steven B. Mirsky2, and Rebecca J. McGee3
1
Graduate Research Assistant, Professor, Assistant Professor Department of Crop and Soil Science
North Carolina State University Raleigh, North Carolina 27695
2
Research Ecologist
Sustainable Agricultural Systems Laboratory USDA-ARS
Beltsville, MD 20705
3
Research Geneticist
Grain Legume Genetics and Physiology Research Unit USDA-ARS
2
ABSTRACT
Winter pea (Pisum sativum L.) is desirable for grain production in the Southeast USA
to increase feed protein availability; however, there has not been previous effort devoted to
maximize pea genetics for grain production in this region. Studies were conducted at six
environments in North Carolina to assess winter pea grain potential. Nineteen winter pea
genotypes were planted in monoculture and in mixture with three wheat genotypes of
differing maturities. Pea cold tolerance, biomass production, disease incidence, maturity,
lodging, and both pea and wheat grain yield were assessed. The growth of only one pea
genotype was severely inhibited by cold. Disease incidence was influenced by pea genotype
but not growth in monoculture or mixture with wheat. At the environments with heavy
Sclerotinia pressure, grain yield of all pea genotypes was severely inhibited. All wheat
genotypes reached physiological maturity prior to any pea genotype, and the two species
were harvested simultaneously using a combine with minimal difficulties. Winter pea yield
was affected by pea genotype but not growth in monoculture or mixture. Pea yield was
greater with early maturing varieties; grain potential across all pea genotypes was likely
restricted by excessive heat during flowering. Many winter pea genotypes screened in this
study out-yielded the current winter pea available in North Carolina. These results indicate
that winter pea and wheat can be grown simultaneously and that regional winter pea varietal
3
INTRODUCTION
North Carolina ranks number two in USA poultry, egg, and hog production and this
state ranks eighteenth in USA grain production (USDA-NASS, 2016). This results in, on
average, a 200-million-bushel-per-year feed grain deficit (Shore, 2015), and necessitates
many livestock feed imports. Protein is an important constituent of animal feed for both
poultry and hog production (Cromwell, 2009); collectively poultry and hogs require
approximately 80% of the high-protein feed demand for animals in the USA (Schnepf, 2011).
Soybean is often imported in large quantities for use as a protein source in livestock feed
rations in North Carolina; shipping costs can result in a considerable increase in feed price.
Pea is an excellent source of protein in livestock diets (Tao et al., 2017), and therefore
has desirable attributes for use as a grain crop in the Southeast USA. Pea protein
concentration can range from 15-35% (Pavek, 2012); consequently pea can serve as a
soybean replacement in livestock feed rations (Uznn et al., 2005). Pea also contains 35-50%
starch and 4-7% fiber (McPhee, 2003). Pea can be grown over the winter in North Carolina,
and therefore would not be competing with soybean acreage during the summer. Unlike
soybean, pea does not require heat processing to inactivate trypsin inhibitors prior to
livestock consumption (Miller et al., 2005); this allows for direct feeding. Pea also contains
high levels of tryptophan and lysine, which are deficient in small grains but are essential
amino acids in livestock feed (Miller et al., 2005). Additionally, pea has low allergenicity
(Warkentin et al., 2014); this is beneficial for animal consumption.
Pea is very susceptible to the Sclerotinia disease complex which is often encountered
4
region. There are no pea genotypes with complete Sclerotinia resistance currently, however
genotypes with partial resistance have been identified (Porter, 2012). Disease pressure from
other complexes, viruses transmitted by aphids, and heat stress during flowering are also
important biotic and abiotic stresses in pea production (McPhee, 2003; Warkentin et al.,
2014). Research on the impacts of these factors on winter pea grain production in the
Southeast USA has been limited.
Wheat is the most commonly produced winter crop in the Southeast USA and is an
important constituent of animal feed in the region (USDA-NASS, 2016). Growing winter pea
in mixture with small grains for animal feed may have several advantages over growing each
crop alone. Total grain yield is often optimized when a cereal and legume are grown together
compared to either grown alone (Murray and Swensen, 1985; Pelzer et al., 2016). The
complementary use of N sources by each species, with the legume fixing atmospheric N and
the small grain utilizing mineral N from the soil, can help explain the increased grain
production in mixture (Naudin et al., 2010). Murrary and Swensen (1985) demonstrated that
pea grown in mixture with small grains out-yielded pea grown in monoculture. These
researchers attributed this to reduced Sclerotinia infection from the erect small grain keeping
the pea off the ground where Sclerotinia pressure is intensified by wet conditions.
Additionally, growing pea in mixture with small grains has been shown to increase the
protein concentration of the small grain (Bedoussac and Justes, 2010). When pea is grown in
monoculture, lodging can lead to seed yield declines (McPhee, 2003); growing pea in
mixture with small grains has been shown to reduce pea lodging (Uzun et al., 2005). Previous
5
simultaneously with minimal crop loss due to similar growing season requirements (Murray
and Swensen, 1985).
Despite the potential for winter pea as a grain crop in the Southeast USA, limited
effort has been devoted to maximizing pea performance for grain production in the region.
The objective of this experiment was to identify winter pea genotypes that can be grown in
6
MATERIALS AND METHODS
Experiment sites and management
Experiments were conducted for two years from 2014-2016 at three locations in
North Carolina. The locations were Central Crops Research Station in Clayton (35.67˚N,
78.51˚W), Caswell Research Farm in Kinston (35.16˚N, 77.36˚W), and the Piedmont
Research Station in Salisbury (35.41˚N, 80.37˚W); hereafter referred to as Clayton, Kinston,
and Salisbury, respectively. Year will be referred to in the spring when the grain was
harvested. The combination of year and location constituted an environment, for a total of six
environments. The Clayton 2015 trial was conducted on Varina loamy sand (fine, kaolinitic,
therminc Plinthic Paleudults) and the Clayton 2016 trial was conducted on a Wagram loamy
sand (loamy, kaolinitic, thermic Arenic Kandiudults). The Kinston 2015 and 2016 trials were
conducted on a Johns sandy loam (fine-loamy over sandy or sandy-skeletal, siliceous,
semiactive, thermic Aquic Hapludults). The Salisbury 2015 and 2016 trials were conducted
on a Lloyd clay loam (fine, kaolinitic, thermic Rhodic Kanhanpludults). P and K were
applied based on recommendations from soil tests provided by the North Carolina
Department of Agriculture and Consumer Services Agronomic Division (Raleigh, NC). No N
fertility was applied. Preemergence herbicide applications were used at several
environments; no postemergence herbicides were applied.
Treatment description
Nineteen winter pea genotypes were screened; eighteen were obtained from the
USDA-ARS winter pea breeding program at Pullman, WA. These genotypes were identified
7
included the following twelve released cultivars: ‘CAH-11’, ‘Chelan’, ‘Common’, ‘Fenn’,
‘Glacier’, ‘Granger’, ‘Lynx’, ‘Melrose’, ‘Racer’, ‘Romack’, ‘Specter’, and ‘Windham’. Six
advanced ARS breeding lines, PS07300136W, PS09300095W, PS10300120W,
PS10300121W, PS06300028W, and PS0017018W, were also included. The current winter
pea genotype readily available in North Carolina (cv ‘Nature’s Choice’) was also screened;
this cultivar was obtained by seed distributors in North Carolina from Columbia Grain
(Portland, OR). Attributes for each genotype can be found in Table 1. Each genotype was
screened in monoculture and in mixture with early (cv ‘USG 3120’), medium (cv
‘FeatherStone VA 258’), and late (cv ‘NC Yadkin’) maturing wheat cultivars commonly
grown in North Carolina. The pea cultivar ‘Racer’ was not screened at the Kinston and
Salisbury 2016 environments due to limited seed quantities. Winter pea genotypes were
screened in monoculture at 444,600 seeds ha-1 and in mixture with wheat at 296,400 seeds ha-1. Winter pea seeding rates were selected considering both previous literature and limited seed quantity (Johnston et al., 2002; Murray and Swensen, 1985). Wheat was seeded at
926,250 seeds ha-1. Plots were established using a cone planter (Hege 1000 series,
Wintersteiger Inc., Salt Lake City, UT) with 17-cm row spacing. Plot size was 1.5 by 4.6 m.
Dates for management activities can be found in Table 2.
Data collection
Cold tolerance.Winter peacold tolerance was assessed visually on a 0-6 scale with 0
corresponding to poor cold tolerance and 6 corresponding to excellent cold tolerance (Table
8
Disease. Winter pea disease was assessed visually on a 0 to 100% disease scale, with 0%
corresponding to no disease and 100% corresponding to total death from disease (Table 2).
Diseases were not rated individually; genotypes were scored for overall disease presence
from a multitude of diseases that could restrict grain production. The most prevalent diseases
across these environments included Ascochyta leaf blight (Ascochyta rabiei), powdery
mildew (Erysiphe sp. unknown), and diseases from the Sclerotinia complex; other diseases
were likely present. Aphids were readily present on these winter pea genotypes and were not
controlled; aphids are vectors of viral pathogens affecting pea (McPhee, 2003) and this
damage may have been present across these environments.
Grain harvest. At the Clayton and Salisbury environments, winter pea grown in monoculture
or mixed with wheat was harvested using a small-plot combine (Model Delta, Wintersteiger
Inc., Salt Lake City, UT) with the soybean bottom sieve in place. Lodging was rated from the
combine at grain harvest on a 0-100% scale, with 0% corresponding to no lodging and 100%
corresponding to complete lodging. Wheat and pea mixture plots were not harvested with a
combine at the Kinston 2015 and 2016 environments where pea grain yield was severely
inhibited by disease; at the Kinston 2015 environment pea was harvested by hand followed
by hand-threshing using a Wintersteiger belt thresher.
Experimental design and statistical analysis
The study was conducted in a randomized complete block design with three
replications per environment (228 plots total per environment). A factorial treatment
arrangement was used with nineteen levels of Factor A (pea genotype) and four levels of
9
cultivars). Statistical analyses were conducted using Proc Mixed and Proc Reg in SAS 9.3
(SAS Institute Inc., Cary, NC). Mixed models were used to generate ANOVA results for the
effect of pea genotype and mixture (independent variables) on cold tolerance, disease, and
grain yield (dependent variables). Regression analyses were used to investigate the
relationships between dependent variables. Winter pea genotype (G) and growth in mixture
or monoculture (M) were considered fixed factors and replication and environment were
considered random factors. Square root transformations of pea yield were performed to
correct for homogeneity of variance violations; means were back
transformed for data presentation. All other data met model assumptions. Treatment means
are reported using least square means for disease incidence and pea grain yield at each
environment. Treatment means were separated using Fisher’s Protected LSD at P≤0.05.
Combined analyses over four environments (Clayton 2015, Clayton 2016, Salisbury 2015,
and Salisbury 2016) were conducted for regression analyses. The Kinston environments were
10
RESULTS AND DISCUSSION
Cold tolerance: Pea genotype, but not growth in monoculture or mixture, affected pea cold
tolerance (Table 3). All pea genotypes survived the winter with minimal damage expect for
Racer whose growth was severely impacted by cold damage at all environments where it was
tested (data not shown). Romack also exhibited moderate cold injury in some environments,
but recovered (data not shown). Similarly, previous screening in Idaho indicated that Romack
had reduced cold tolerance compared to other genotypes (Auld et al., 1983). The presence of
a small grain in mixture with the pea did not protect the susceptible pea genotypes from cold
injury. These results suggest that many pea genotypes will survive the North Carolina winter,
however cold injury is possible and screening for cold tolerance is necessary prior to cultivar
recommendation.
Disease: Disease pressure was variable across environments. Generally pea genotype but not
growth in monoculture or mixture affected pea disease incidence (Table 3). Late-season
Sclerotinia pressure limited grain harvest with a combine at the Kinston environments. As
evidenced by limited grain production in the Kinston environments, Sclerotinia remains one
of the greatest limitations to winter pea production in the Southeast USA. The ranking of
disease incidence among the genotypes changed within each environment (Table 4), a likely
result of differing disease and insect pressures at each environment. Glacier, Granger,
Melrose, PS09300095W, and Specter tended to have the greatest disease incidence across
environments (Table 4). While these genotypes perform well for grain production in other
USA regions, disease pressure unique to the Southeast USA may necessitate treatment for
11
PS07300136W generally had less disease incidence than the other pea genotypes (Table 4);
these genotypes may be sources of disease resistance genes.
Grain yield: All wheat cultivars reached physiological maturity prior to any pea genotype,
demonstrating that producers have flexibility in selecting a wheat cultivar to grow in mixture
with the winter pea genotypes screened in this study. A late-maturing wheat cultivar would
likely be preferable to minimize wheat head sprouting while waiting for the pea to reach
physiological maturity. Lodging was observed at the Clayton environments (data not shown);
this lodging did not prevent grain harvest. In the Clayton 2015 and 2016 environments, pea
genotype affected lodging (P<0.001, P<0.001). As pea biomass increased, so did the
incidence of lodging (data now shown, Y= -25.1+12.7x, r2=0.16). In the Clayton 2015 environment, lodging was also affected by pea growth in monoculture or mixture (P=0.001).
Lodging was greatest when pea was grown in monoculture (65%) and less when pea was
grown in mixture with wheat (40-45%). Reduced lodging has been previously reported when
pea was grown in mixture with a small grain (Murray and Swensen, 1985). Pea genotypes
that were semi-leafless (vs normal leaves) were less prone to lodging (P<0.001). These
results are aligned with previous research indicating the semi-leafless characteristic reduces
lodging and helps keep the pea upright (Uzun et al., 2005).
Pea genotype (P=0.001) but not growth in monoculture or mixture affected pea grain
yield in a combined analysis of four environments (Clayton 2015, Clayton 2016, Salisbury
2015, Salisbury 2016). Across these environments pea grain yield was low compared to
12
this study were low, many pea genotypes screened out-yielded the winter pea genotype
currently available in North Carolina. This indicates that regional efforts to enhance pea grain
yield through regional cultivar development and recommendations are appropriate.
Interestingly, growth in monoculture or growth in mixture with wheat did not affect
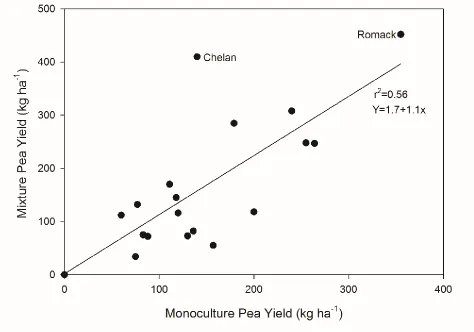
pea grain yield. Generally, as pea grain yield in monoculture increased pea grain yield in
mixture also increased (Figure 1). Chelan was an outlier to this trend and this cultivar had
higher grain yield in mixture with wheat than in monoculture. Romack was the highest
yielding pea genotype both in monoculture and in mixture with wheat.
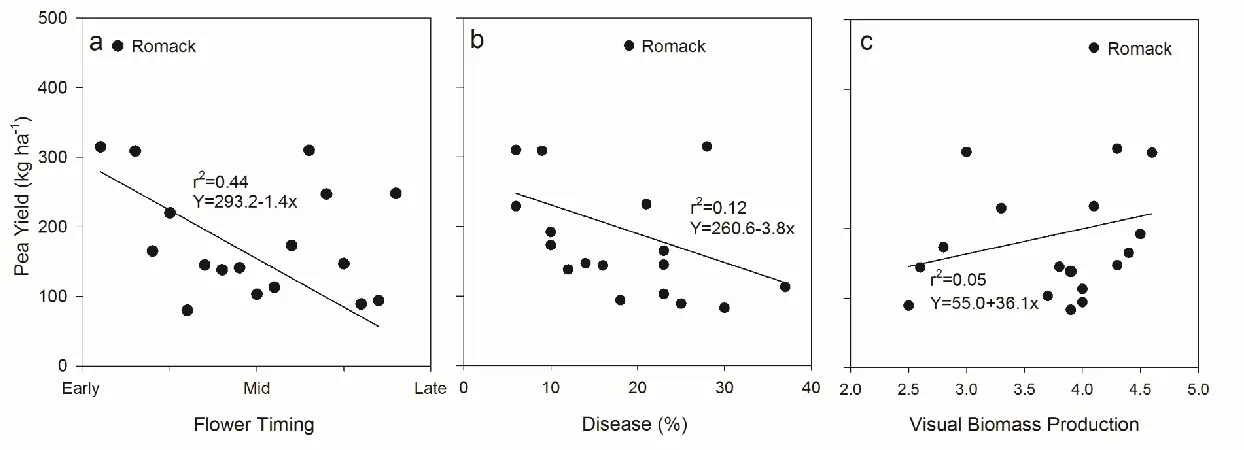
Flower timing, an indicator of maturity, affected pea yield in a combined analysis of
four environments (Clayton 2015, Clayton 2016, Salisbury 2015, Salisbury 2016). Pea yield
generally declined as maturity was delayed (Figure 2a). Heat stress during flowering is a
major abiotic stress in pea production (McPhee, 2003; Warkentin et al., 2014). There are two
major genes that control flower timing in pea; the dominant form of one gene (Hr) will make
the pea photoperiod sensitive while the recessive form of the other gene (lf) will allow the
pea to flower as early as the eighth node (Alcade et al., 1999; Lejeune-Henaut et al., 2008;
McGee et al., 2017). Combing the dominant Hr gene and the recessive lf gene will promote
early flowering, but prevent flowering in early winter when the day length is less than 13.5
hours and cold injury is likely (McGee et al., 2017). Pea planted in October in North Carolina
lacking the dominant form of the Hr gene have flowered as early as 60 days after planting
(Vann et al., observational, unpublished data); this is problematic for cold tolerance. Racer
was the earliest flowering pea genotype screened in this experiment, and did not have the
13
Carolina, breeding efforts should focus on developing cold tolerance in early flowering
cultivars.
Several other factors also influenced pea grain yield. As disease incidence increased,
pea yield declined (Figure 2b). As pea biomass increased, pea yield tended to increase
(Figure 2c). Previous research also reported a linear increase in pea grain yield with
increasing pea biomass (McPhee and Muehlbauer, 1999); these results would indicate that
breeding efforts for increasing pea biomass and grain yield can be conducted simultaneously.
Leaf type, normal vs semi-leafless, did not affect pea grain yield (data not shown).
Wheat yield was affected by wheat cultivar across all environments where wheat was
harvested (Table 3). Wheat yield averaged 930-1390, 310-390, 2,070-2,610, and 1,920-2,820
kg ha-1 at the Clayton 2015, Clayton 2016, Salisbury 2015, and Salisbury 2016 environments, respectively. Wheat yield was affected by winter pea genotype across all environments where
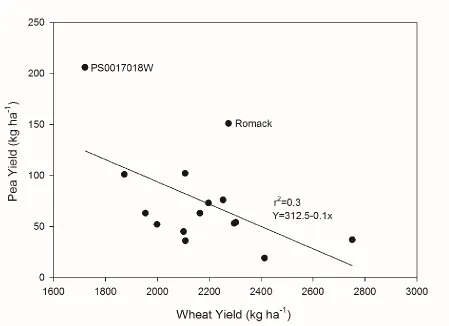
wheat was harvested (Table 3). A significant negative linear relationship between wheat
yield and pea yield was observed at the Salisbury environments where wheat yields were
higher than observed at the Clayton environments (P<0.001). At the Salisbury environments,
generally pea yield declined as wheat yield increased. Romack was an outlier to this trend
and produced moderate grain yield in mixture with moderate yielding wheat. The soils at the
Salisbury environment were higher in residual nitrogen than the soils at the Clayton
environment, and this led to high wheat yields despite low wheat seeding rates. Wheat was
too competitive in mixture with winter pea at the Salisbury environments. These results
demonstrate the importance of previous site management and soil fertility in determining site
14
Winter pea genotypes that out-perform the current winter pea cultivar readily
available in North Carolina for grain production have been identified through this research,
and growing winter pea and wheat simultaneously appears possible. While pea yield was less
than achieved in other USA regions, limited research has been conducted on winter pea for
grain yield in this region. Optimum temperature during pea flowering is 23 ˚C and when
temperatures exceed 23 ˚C, as often encountered in the Southeast USA from April-June, it
can lead to flower abortion (Strydhorst et al., 2015). Breeding efforts for this region should
be focused on developing disease resistant, cold hardy pea genotypes that are early flowering
and thus can minimize heat stress during flowering. Additional focus areas for future
research include appropriate seeding rates, seeding dates, fertility regiments, and pest control
15
REFERENCES
Alcalde, J.A., T.R. Wheeler, R.J. Summerfield, and A.L. Norero. 1999. Quantitative effects of the genes Lf, Sn, E, and HR on time to flowering in pea (Pisum sativum L.). J. Exp. Bot. 50:1691-1700.
Auld, D.L., R.L. Ditterline, G.A. Murray, and J.B. Swensen. 1983. Screening peas for winterhardiness under field and laboratory conditions. Crop Sci., 23:85-88.
Bedoussac, L. and E. Justes. 2010. The efficiency of a durum wheat-winter pea intercrop to improve yield and wheat grain protein concentration depends on N availability during early growth. Plant Soil, 330:19-35.
Cromwell, G.L. 2009. ASAS Centennial paper: landmark discoveries in swine nutrition in the past century. J. Anim. Sci. 87:778-792.
Johnston, A.M., G.W. Clayton, G.P. Lafond, K.N. Harker, T.J. Hogg, E.N. Johnson, W.E. May, and J.T. McConnell. 2002. Field pea seeding management. Can. J. Plant Sci., 82:639-644.
Lejeune-Henaut, I., E. Hanocq, L. Bethencourt, V. Fontaine, B. Delbreil, J. Morin, A. Petit, R. Devaux, M. Boilleau, J.J. Stempniak, and M. Thomas. 2008. The flowering locus Hr colocalizes with a major QTL affecting winter frost tolerance in Pisum sativum. L. Theor. Appl. Genet. 116:1105-1116.
McGee, R.J., S. Eigenbrode, H. Newlson, and W. Schillinger. 2017. Re-inventing Austrian winter pea: Towards developing food quality winter peas. Crop and Soils Magazine, American Society of Agronomy. 50:4-46.
McPhee, K.E. 2003. Dry pea production and breeding – A mini-review. Food, Agric., and Env., 1:64-69.
McPhee, K.E., and F.J. Muehlbauer. 1999. Variation for biomass and residue production by dry pea. Field Crops Res., 62:203-212.
Miller, P., K. McKay, C. Jones, S. Blodgett, F. Menalled, J. Riesselman, C. Chen, and D. Wichman. 2005. Growing dry pea in Montana. Montana State University Extension Service. Available at: www.msuextension.org/pspp/documents/GrowingDryPea.pdf
Murray, G.A., and J.B. Swensen. 1985. Seed yield of winter field peas intercropped with winter cereals. Agron. J., 77:913-916.
16
various dynamics of N availability on winter pea-wheat intercrops. Crop growth, N partitioning and symbotic N2 fixation. Field Crops Res. 119:2-11.
Pavek, P.L.S. 2012. Plant guide for pea (Pisum sativum L.).USDA-Natural Resources Conservation Service, Pullman,WA.
Pelzer, E., M. Bazot, L. Guichard, and M. H. Jeuffroy. 2016. Crop management affects the performance of a winter pea-wheat intercrop. Agron. J., 108:1089-1100.
Porter, L.D. 2012. Pea germplasm with partial resistance to Sclerotinia sclerotiorum extends the time required by the pathogen to infect host tissue. Crop Sci., 52:1044-1050.
Pratt, R.G. 1988. New forage legumes hosts of Sclerotinia trifoliorum and S. sclerotiorum in the southeastern United States. Plant Dis., 72:593-596.
Schnepf, R. 2011. U.S. Livestock and poultry feed use and availability: background and emerging issues. Congressional Research Service. Available at:
nationalaglawcenter.org/wp-content/uploads/assets/crs/R41956.pdf
Shore, D. February 5, 2015. Growing the Grain Industry: Solutions to benefit both crop and animal producers. North Carolina State University, College of Agriculture and Life Sciences News. Available at: https://cals.ncsu.edu/news/growing-the-grain-industry/
Strydhorst, S., M.A. Olson, T. Vasanthan, K.E. McPhee, R.H. McKenzie, B. Henriquez, J. Tieulie, A. Middleton, R. Dunn, P. Pfiffner, K. Coles, M. Bandara, A. Kruger, R. Bowness, D-J. Bing, and D. Beauchesne. 2015. Adaptability and quality of winter pea and lentil in Alberta. Agron. J., 107:2431-2448.
Tao, A., R.K. Afshar, J. Huang, Y.A. Mohammed, M. Espe, and C. Chen. 2017. Variation in yield, starch, and protein of dry pea grown across Montana. Agron. J., 109:1-11.
USDA/NASS. 2016. 2016 Agricultural Statistics, North Carolina. Available at:
https://www.nass.usda.gov/Statistics_by_State/North_Carolina/Publications/Annual_ Statistical_Bulletin/index.php
USDA/NASS. 2017. Crop Production 2016 Summary. pp 93. Available at: https://www.usda.gov/nass/PUBS/TODAYRPT/cropan16.pdf
17
18 Table 1. Attributes for pea genotypes.
Genotype Year released‡
Growth habit
Flower color
Pigmented
seed coat§ Biomass¶
Leaf type
Flower timing
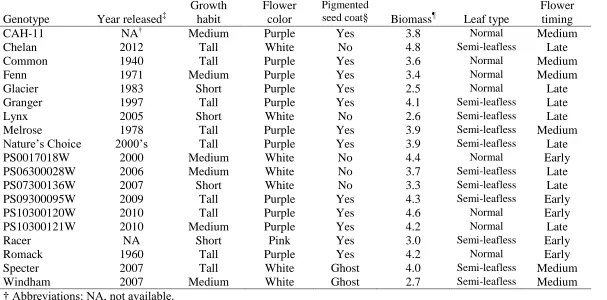
CAH-11 NA† Medium Purple Yes 3.8 Normal Medium
Chelan 2012 Tall White No 4.8 Semi-leafless Late
Common 1940 Tall Purple Yes 3.6 Normal Medium
Fenn 1971 Medium Purple Yes 3.4 Normal Medium
Glacier 1983 Short Purple Yes 2.5 Normal Late
Granger 1997 Tall Purple Yes 4.1 Semi-leafless Late
Lynx 2005 Short White No 2.6 Semi-leafless Late
Melrose 1978 Tall Purple Yes 3.9 Semi-leafless Medium
Nature’s Choice 2000’s Tall Purple Yes 3.9 Semi-leafless Late
PS0017018W 2000 Medium White No 4.4 Normal Early
PS06300028W 2006 Medium White No 3.7 Semi-leafless Late
PS07300136W 2007 Short White No 3.3 Semi-leafless Late
PS09300095W 2009 Tall Purple Yes 4.3 Semi-leafless Early
PS10300120W 2010 Tall Purple Yes 4.6 Normal Early
PS10300121W 2010 Medium Purple Yes 4.2 Normal Late
Racer NA Short Pink Yes 3.0 Semi-leafless Early
Romack 1960 Tall Purple Yes 4.2 Normal Early
Specter 2007 Tall White Ghost 4.0 Semi-leafless Medium
Windham 2007 Medium White Ghost 2.7 Semi-leafless Medium
† Abbreviations: NA, not available.
‡ Cultivar release dates were reported to the best of the authors’ knowledge. Cultivar release date was not attainable for cvs. CAH-11 and Racer.
§ Ghost mottling is very faint brownish streaks in the testa and is cultivar specific for both Specter and Windham.
19 Table 2. Dates for plot establishment, data collection, and plot harvest.
Environment Planting Cold tolerance ratings Disease ratings Biomass ratings Harvest
Clayton 2015 9 Oct. 9 Jan. 5 May 5 May 9 June
Kinston 2015 6 Oct. 9 Jan. 17 Apr. 17 Apr. 12 June
Salisbury 2015 7 Oct. 16 Jan. 28 Apr. & 18 May 18 May 17 June
Clayton 2016 16 Oct. 26 Jan. & 16 Mar. 16 Mar. & 6 May 26 Jan. 3 June Kinston 2016 15 Oct. 20 Jan. & 18 Mar. 18 Mar. & 13 Apr. 20 Jan. -
20
Table 3. ANOVA for the effect of pea genotype (G) and growth in monoculture or mixture with wheat (M) and their interaction on cold tolerance, disease incidence, pea yield, and wheat yield at individual environments.
Environment
Dependent Variable Source Clayton 2015 Clayton 2016 Kinston 2015 Kinston 2016 Salisbury 2015 Salisbury 2016 --- P>F
---Cold 1 G <0.001 <0.001 <0.001 <0.001 <0.001 0.001
M NS NS NS NS NS NS
G*M NS NS NS NS NS NS
Cold 2 G - <0.001 - 0.001 - 0.02
M - NS - NS - NS
G*M - NS - NS - NS
Disease 1 G NS <0.001 <0.001 0.003 <0.001 -
M NS NS NS NS NS -
G*M NS 0.03 NS NS NS -
Disease 2 G - <0.001 - 0.02 <0.001 <0.001
M - NS - NS 0.004 NS
G*M - NS - NS NS NS
Pea Yield G <0.001 <0.001 0.004 - 0.05 0.02
M NS NS NS - - NS
G*M <0.001 NS NS - - NS
Wheat Yield G <0.001 0.05 - - 0.001 0.03
M <0.001 0.01 - - 0.001 <0.001
G*M NS NS - - NS NS
† Abbreviations: G, genotype; M, growth in mixture or monoculture; NS, non-significant at the 0.05 level. ‡ Data not presented (--) because data was not obtained at that environment.
21
Table 4. Pea disease incidence by genotype averaged over growth in monoculture or mixture at individual environments. Environment
Disease 1 Disease 2
Genotype Clayton 2015 Clayton 2016 Kinston 2015 Kinston 2016 Salisbury 2015 Clayton 2016 Kinston 2016 Salisbury 2015 Salisbury 2016 --- % ---
CAH-11 4 a 1 cd 20 def 5 cde 22 ef 10 abcd 20 cde 33 efg 16 def
Chelan 19 a 4 a 28 cde 6 bcde 19 f 4 de 19 cde 33 efg 17 def
Common 10 a 1 cd 44 bc 7 abcde 51 bc 5 cde 13 de 47 de 24 bcd
Fenn 20 a 1 cd 66 a 3 de 47 c 4 cde 24 bcde 48 cde 20 cde
Glacier 27 a 0 d 66 a 3 de 53 bc 18 a 29 abcd 68 abcd 19 bcdef
Granger 33 a 1 cd 61 ab 5 cde 72 a 12 abc 22 bcde 85 a 40 a
Lynx 13 a 0 d 20 def 5 cde 18 f 2 e 10 e 28 fg 8 f
Melrose 18 a 1 cd 75 a 12 ab 73 a 9 bcde 44 a 75 ab -
Nature’s Choice
9 a 2 cd 32 cd 3 de 43 c 6 cde 23 bcde 43 ef 16 def
PS0017018W 4 a 3 abc 30 cd 6 bcde 12 f 8 cde 19 cde 20 gh 17 def
PS06300028W 1 a 1 cd 10 f 1 e 12 f 2 de 15 cde 8 h -
PS07300136W 0 a 0 d 12 ef 1 e 11 f 1 e 14 cde 6 h -
PS09300095W 7 a 1 cd 69 a 11 abc 67 ab 18 a 22 cde 80 ab 29 abc
PS10300120W 18 a 3 abc 38 c 4 de 40 cde 7 cde 31 abc 65 bc 30 ab
PS10300121W 6 a 3 abc 28 cde 6 bcde 25 def 5 cde 21 cde 39 ef 17 def
Racer 12 a - - - -
Romack 5 a 0 d 31 cd 13 a 42 cd 16 ab 40 ab 33 efg 24 bcd
Specter 31 a 2 cd 78 a 6 bcde 50 bc 8 bcde 18 cde 75 ab 24 bcde
Windham 3 a 0 d 35 cd 8 abcd 45 c 3 de 15 cde 52 cde 15 ef
† Data not presented (--) because pea genotypes did not survive at this environment or were not evaluated.
‡ Means are compared within each environment and means followed by the same letter are not significantly different at P≤0.05
based on Fisher’s Protected LSD.
22
Table 5. Pea grain yield by genotype averaged over growth in monoculture or mixture at each environment. Environment
Genotype Clayton 2015 Clayton 2016 Kinston 2015 Salisbury 2015 Salisbury 2016 --- kg ha-1
---CAH-11 351 fgh 52 e 33 b 47 cd 65 b
Chelan 732 abc 195 bcd 14 b 202 abc 71 b
Common 320 fgh 144 cde 11 b 28 bcd 79 b
Fenn 234 ghi 122 de 19 b 82 bcd 69 b
Glacier 220 hi 86 e - 180 abcd -
Granger 343 fgh 92 e - - -
Lynx 426 defg 134 de 11 b 43 bcd 37 b
Melrose 256 ghi 83 e - - -
Nature’s Choice 256 ghi 63 e 16 b 0 d 76 b
PS0017018W 590 bcd 220 bcd 85 a 277 ab 99 b
PS06300028W 554 cde 224 bc 49 ab 428 a -
PS07300136W 810 a 266 b 38 b 172 bc -
PS09300095W 785 ab 241 b - - 43 b
PS10300120W 480 def 133 cde - 100 bcd 47 b
PS10300121W 383 efgh 69 e 24 b 83 cd 71 b
Racer 72 i - - - -
Romack 769 ab 713 a 42 b 132 bcd 201 a
Specter 443 defg 224 bcd - - 115 b
Windham 236 ghi 268 b 30 b - 52 b
† Data not presented (--) because pea genotypes did not survive at this environment or were not evaluated.
‡ Means are compared within each environment and means followed by the same letter are not significantly different at P≤0.05
based on Fisher’s Protected LSD. § Pea moisture was corrected to 13.5%.
23
24
Figure 2. (a) Effect of flower timing on pea yield (averaged over growth in monoculture and mixture). Pea genotypes were ranked for flower timing from one through nineteen to perform the regression analysis. Treatment means are combined across four environments (Clayton 2015, Clayton 2016, Salisbury 2015, and Salisbury 2016) and represent individual pea genotypes. P value characterizes the linear relationship of flower timing and pea yield (P<0.001). (b) Effect of disease incidence on pea yield
(averaged over growth in monoculture and mixture). Treatment means are combined across four environments (Clayton 2015, Clayton 2016, Salisbury 2015, and Salisbury 2016) and represent individual pea genotypes. P value characterizes the linear relationship of disease incidence and pea yield (P<0.001). c) Effect of pea biomass (averaged over growth in monoculture and mixture) on pea yield (averaged over growth in monoculture and mixture). Treatment means are combined across four
25
Figure 3. Effect of wheat yield (averaged over wheat maturity) on pea yield in mixture (averaged over wheat maturity).
Treatment means combined over two environments (Salisbury 2015 and Salisbury 2016) and represent individual pea genotypes.
26
Chapter II
Differences among Eighteen Winter Pea Genotypes for Forage and Cover Crop Use in
the Southeast USA
Rachel A. Vann1, S. Chris Reberg-Horton1, Miguel S. Castillo1, Steven B. Mirsky2, U.K. Saha3, and Rebecca J. McGee4
1
Graduate Research Assistant, Professor, Assistant Professor Department of Crop and Soil Science
North Carolina State University Raleigh, North Carolina 27695
2
Research Ecologist
Sustainable Agricultural Systems Laboratory USDA-ARS
Beltsville, MD 20705
3
Program Coordinator
Feed and Environmental Water Laboratory The University of Georgia Cooperative Extension
2300 College Station Road Athens, GA 30602
4
Research Geneticist
Grain Legume Genetics and Physiology Research Unit USDA-ARS
27
ABSTRACT
Winter pea (Pisum sativum L.) can be used as a forage and cover crop in the
Southeast USA; minimal effort has been devoted to maximize pea genetics for forage and
cover crop production in this region. Studies were conducted from 2015-2017 in Maryland
and North Carolina screening eighteen winter pea genotypes for forage and cover crop end
uses and comparing these genotypes to crimson clover and hairy vetch. All legume genotypes
were harvested across four timings to understand the influence of maturity on biomass and
quality. Legume cold tolerance, disease incidence, biomass production, quality, and N release
were estimated. Cold injury was severe with many pea genotypes at the Maryland
environments and this restricted pea biomass production; minimal cold injury was present at
the North Carolina environments. There was considerable variation in disease incidence
among the pea genotypes depending on biotic stressors at each environment. At the North
Carolina environments, several pea genotypes produced similar biomass to crimson clover
and hairy vetch across harvest timings. At the Maryland environments, crimson clover and
hairy vetch biomass well exceeded pea biomass. N release was estimated for each legume
genotype; the high biomass producing peas and hairy vetch released N at similar quantities at
three of the four harvest timings. The evaluated pea genotypes varied considerably for quality
traits, including protein, lignin, and cellulose. Relative forage quality declined as biomass
harvest was delayed, and was generally higher with all pea genotypes than crimson clover or
hairy vetch. These results show wide genetic variation in the pea genotypes screened for
biomass and quality; this variation could be utilized in breeding efforts to enhance winter pea
28
INTRODUCTION
Cover crop adoption is increasing across the United States (Wayman et al., 2016); in
the Southeast region some states have surpassed 10% cover crop adoption on cropland
(USDA-NASS, 2016). Farmers are using cover crops for a multitude of reasons which
include improving soil quality, soil moisture conservation, weed suppression, insect
suppression, and fertility provision to the subsequent crop (Grandy et al., 2006; Mitchell et
al., 2012; Poffenbarger et al., 2015a; Schipanski et al., 2014; Vann et al., 2017). Legume
cover crops are often used for their ability to provide substantial nitrogen (N) to the
subsequent crop (Foote et al., 2014; Parr et al., 2011). Legumes typically have low
Carbon(C):N ratios that allow for accelerated residue decomposition, thereby providing N to
the subsequent crop (Wagger, 1989a). Fertility provision from legume cover crops is
beneficial for conventional producers to reduce dependency on synthetic fertilizers and for
organic producers who rely heavily on biological N sources for fertility management.
Crimson clover (Trifolium incarnatum) and hairy vetch (Vicia villosa Roth) are both
popular legume cover crops in the Southeast. Hairy vetch can produce substantial biomass
(Mischler et al., 2010; Parr et al., 2011), but also produces hard seed which can create weed
management challenges in the subsequent winter cash crops (Maul et al., 2011; Vann et al.,
2016). Many producers have wheat in their rotation and are reluctant to use hairy vetch as a
cover crop for future control difficulties in their wheat crop. Crimson clover can produce
substantial biomass and is popular with many farmers in the Southeast but can have notably
slower N release compared to other legume cover crops and has even resulted in N
immobilization under some circumstances (Reberg-Horton et al., 2012). Crimson clover
growth is also very sensitive to soil type (Reberg-Horton, personal communication). Pea is
29
Winter pea can produce high biomass, allowing for substantial N availability to the
following cash crop. In North Carolina, winter pea provided 70-91 kg N ha-1 in the Coastal Plain and 128-208 kg N ha-1 in the Piedmont regions following termination with a roller-crimper (Parr et al., 2012). Other research conducted in the Southeast showed that winter pea
could produce more dry matter than hairy vetch (Ranells and Wagger, 1997). Beyond
biomass production and N provision, additional benefits of pea include easy termination and
no hard seed (Sattell et al., 1998).
Pea has a high nutritive concentration; 18-30% protein, 35-50% starch, and
considerable concentrations of the amino acid lysine, which is deficient in small grains
(McPhee et al., 2003). Pea can be grazed, cut for hay, and ensiled (Caddel and Enis, 2015;
Uzun et al., 2005). Pea silage is more degradable in ruminant animals than barley silage
(Mustafa et al., 2000). For these reasons, pea is also a desirable forage crop.
There are several important requirements for winter pea to succeed in the Southeast
as both a forage and cover crop. Biomass production is foundationally important for the
success of a forage and cover crop. Previous research in the Pacific Northwest USA screened
multiple entries in a grain yield trial and discovered winter pea biomass ranging from
2300-4760 kg ha-1 (McPhee and Muehlbauer, 1999); similar biomass screens across multiple pea genotypes have not occurred in the Southeast. Winter pea is susceptible to a range of abiotic
stresses and is most sensitive to cold injury, excessive drought, and heat during flowering
(McPhee, 2013). Winter hardiness in pea germplasm is complex and controlled by several
mechanisms (McGee et al., 2017). Recent efforts have focused on improving winter pea
hardiness (McGee et al., 2017), however many winter pea genotypes, especially those
30
stress. Winter peas are susceptible to a wide range of biotic stresses as well (McPhee, 2003).
Significant efforts have been devoted to incorporating disease resistance in pea germplasm
(Cousin, 1997), but these efforts have focused on addressing diseases commonly encountered
in large pea producing regions of the USA. The presence and severity of pea diseases are
different in the Southeast and the regions of the USA where pea is bred and produced.
Diseases caused by the Sclerotinia complex are a restriction for pea production in the
Southeast, and the damage from this genus is intensified during cool, wet conditions often
encountered in the Southeast (Holderbaum et al., 1990). Pea genotype and the environment
can both have considerable influence on protein and starch concentrations (Cousin, 1997).
A regional screen of winter pea genotypes has not occurred in the Southeast and
growers are limited to using cultivars that have been developed in other USA regions. Lack
of regionally adapted cultivars is one barrier limiting cover crop adoption in this region
(Wayman et al., 2016). The objective of this research was to screen and compare winter pea
genotypes for forage and cover crop use in the Southeast to crimson clover and hairy vetch
which are more commonly used legume cover crops in the region and use this information to
dynamically provide information on parental selection for future crosses aimed at regional
31
MATERIALS AND METHODS
Experiment sites and management
Experiments were conducted from 2015-2016 at two sites on the USDA-ARS
Beltsville Agricultural Research Center in Beltsville, MD (North: 39.03˚N, 76.93˚W; South:
39.02˚N, 76.94˚W); the Central Crops Research Station in Clayton, NC (35.67˚N,78.51˚W);
and the Caswell Research Farm in Kinston, NC (35.16˚N, 77.36˚W), and from 2016-2017
again in Clayton, at the Upper Coastal Plain Research Station in Rocky Mount, NC
(35.90˚N,77.68˚W), and the Piedmont Research Station in Salisbury, NC (35.41˚N,
80.37˚W). Year will be referred to in the spring when biomass was harvested. The
combination of year and location constituted an environment. The Beltsville North trial was
conducted on a Hammonton loamy sand (coarse-loamy, siliceous, semiactive, mesic Aquic
Hapludults), the Beltsville South trial was conducted on a Hatboro silt loam (fine-loamy,
mixed, active, nonacid, mesic Fluvaquentic Endoaquepts), the Clayton 2016 trial was
conducted on a Varina loamy sand (fine, kaolinitic, therminc Plinthic Paleudults), the
Clayton 2017 trial was conducted on a Norfolk loamy sand (fine-loamy, kaolinitic, thermic
Typic Kandiudults), the Kinston trial was conducted on a Johns sandy loam (fine-loamy over
sandy or sandy-skeletal, siliceous, semiactive, thermic Aquic Hapludults), the Rocky Mount
trial was conducted on a Goldsboro fine sandy loam (fine-loamy, siliceous, subactive,
thermic Aquic Paleudults), and the Salisbury trial was conducted on a Lloyd clay loam (fine,
kaolinitic, thermic Rhodic Kanhanpludults). P and K were applied based on
recommendations from soil tests provided by the North Carolina Department of Agriculture
and Consumer Services Agronomic Division (Raleigh, NC). No N fertility was applied.
Preemergence herbicide applications were used at several environments; no postemergence
32
Treatment description
Eighteen winter pea genotypes were investigated for forage and cover crop potential.
Seventeen pea genotypes were obtained from the USDA-ARS winter pea breeding program
at Pullman, WA. Eleven of these genotypes were released pea cultivars: cv.s ‘CAH-11’,
‘Chelan’, ‘Common’, ‘Fenn’, ‘Glacier’, ‘Granger’, ‘Lynx’, ‘Melrose’, ‘Romack’, ‘Specter’,
‘Windham’, and six were advanced ARS breeding lines: PS07300136W, PS09300095W,
PS10300120W, PS10300121W, PS06300028W, PS0017018W. The current winter pea
genotype readily available in North Carolina (cv ‘Nature’s Choice’ (NC)) was also screened.
One crimson clover cultivar (cv AU Robin) and one hairy vetch cultivar (cv Purple Bounty)
were included as a check comparison; these legume species are used more often than pea as
winter legume cover crop in Maryland and North Carolina. Pea was drilled at 444,600 seeds
ha-1. Pea size can vary considerably between genotypes (Miller et al., 2005), therefore pea genotypes were seeded using populations as opposed to weight. Crimson clover and hairy
vetch were drilled at 22.5 kg ha-1. Seeding rates were selected based on average cover crop seeding rate recommendations in the region (SARE, 2007). Plots were established using a
cone planter (Hege 1000 series, Wintersteiger Inc., Salt Lake City, UT) with row spacing at
17 cm. Plots were planted from mid-September through mid-October (Table 1). Plot size was
1.5 by 2.5 m.
Data collection and analysis
Peacold injury (as a measure of cold tolerance) was assessed visually in January and
March at the North Carolina environments and in March at the Maryland environments using
a 0-5 scale with 0 corresponding to complete death from cold and 5 corresponding to no
33
across pea genotypes then cold injury was not assessed. At the 2017 environments, pea
disease was assessed visually on a 0 to 100% scale, with 0% corresponding to no disease and
100% corresponding to total death from disease. Diseases were not rated individually;
genotypes were scored for overall disease presence from a multitude of diseases that would
restrict biomass production and quality. The most prevalent diseases across these
environments included Ascochyta leaf blight (Ascochyta rabiei), powdery mildew (Erysiphe
sp. unknown), and diseases from the Sclerotinia complex, although other diseases were likely
present. Aphids were readily present on these pea genotypes and were not controlled; aphids
are vectors of viral pathogens affecting peas (McPhee, 2003). Legume maturity was
determined by flowering timing; genotypes were ranked in order by flowering timing across
environments and the pea genotypes were categorized into ‘early’, ‘medium’ and ‘late’
maturing groups.
Legume biomass was collected over four sampling periods beginning in mid-April
when the first flowering pea genotype appeared, which simultaneously aligned with target
cover crop termination prior to corn planting in North Carolina; subsequent harvests occurred
2, 4, and 6 weeks following the initial sampling event (Table 1). Legume biomass was
harvested from two blocks per sampling event using a 0.5-m2 quadrat randomly placed within the plot. Samples were collected and dried at 65ºC to obtain dry weight. Samples were
then ground using a Thomas-Willy Laboratory Mill (Arthur H Thomas Company,
Philadelphia, PA) to pass a 1-mm sieve to homogenize biomass in preparation for quality
analysis.
Subsamples of the homogenized biomass (5 g) were packed into ring cups (Part #