Optimal Reservoir Operation Using Genetic
Algorithm: A Case study of Mazam Reservoir
Project
Mohit Sagar1, Dr. Falguni Parekh2
PG Student, Water Resources Engineering and Management Institute, Faculty of Technology and Engineering, The Maharaja Sayajirao University of Baroda, Samiala, Vadodara, Gujarat, India1
Offg. Director, Associate Professor, Water Resources Engineering and Management Institute, Faculty of Technology and Engineering, The Maharaja Sayajirao University of Baroda, Samiala, Vadodara, Gujarat India2
ABSTRACT Application of optimization techniques for determining the optimal operating policy of reservoirs is a major issue in water resources planning and management. Genetic Algorithm is an optimization technique, based on the principle of natural selection, derived from the theory of evolution, are popular for solving optimization problems. The main aim of the present study is to develop a policy for optimizing the release of water for the purpose of irrigation. The fitness function used is minimizing the squared deviation of monthly irrigation demand along with the squared deviation in mass balance equation.The years considered are from i.e. 2001-02, 2003-04 to 2009-10 Monthly releases for irrigation from the reservoir and initial storages in reservoir at beginning of the month are the decision variables. For this Optimization, the constraints considered are the bounds for the releases and reservoir capacity. Results show that in the year of 2001-02,total 28.84 % MCM the amount of percentage water can be saved than actual release.For year of 2003-04, total61.20 % MCM the amount of percentage of water, For year of 2004-05, total 30.04% MCM the amount of percentage of water, For the year of 2005-06, total 44.20 % MCM the amount of percentage of water, For year 2006-07, total 29.38 % MCM the amount of percentage of water, For the year 2007-08, 44.60 % MCM the amount of percentage of water, For the year of 2008-09, total 39.89 % MCM the amount of percentage of water, Also For the year 2009-10, total 48.81 % MCM the amount of percentage of water can be saved than actual release. The study reveals thatusing Genetic Algorithm, irrigation demands are satisfied, monthly releases for irrigation are optimized and water is saved.
KEYWORDS: Genetic algorithm, Optimization, Reservoir
I. INTRODUCTION
Among the various elements of water resources planning and management, Reservoir Operation is an important element. Reservoir Operation contains several control variables. Operation of reservoir is done to meet the different objectives, such as hydropower generation flood control and allocation of water to different users. For guiding a sequence of releases to meet a large number of demands from stakeholders with these different objectives, operation strategies are defined by the control variables. Practically, it is very difficult to fulfill all the demands which are due to conflicting and unequal objectives in the Reservoir Operation.
reservoir problems, large number of works has been reported on the application of GA. Jothiprakash and Ganesan[
1]
developed a Genetic Algorithm model and applied to Pechiparai reservoir in Tamil Nadu, India to derive the optimaloperational strategies. The objective function was set to minimize the annual sum of squared deviation form desired irrigation release and desired storage volume. The decision variables were release for irrigation and other demands (industrial and municipal demands), from the reservoir. Hence based on that case study it was concluded that GA model could perform better if applied in real world operation of the reservoir.Kumar[2]presented in paper, a genetic algorithm GA model for obtaining an optimal operating policy and optimal crop water allocations from an irrigation reservoir. The model is applied to the Malaprabha single-purpose irrigation reservoir in Karnataka State, India. The optimal operating policy Optimized using the GA is similar to that Optimized by linear programming. The model integrates the reservoir releases with the consequent soil moisture at the root level for each crop and for each period. The model was applied to an existing single purpose reservoir in Karnataka State, India. In rabi season AET Optimized is almost equal to PET indicating that optimal allocations were Optimized from this model. It is observed that AET values Optimized by GA and LP compared well. The operating policies evolved by the study can be adopted in the field, for optimizing the utilization of the existing resources to obtain maximum benefits.Kangrang [3]stated that rule curves of reservoir are necessary guides for long term reservoir operation. The KaengLoeng Chan reservoir was considered to improve their rule curves. The calculations are based on a simulation model using Genetic Algorithms and the water balance equation (GAs-WB) with the objective function of a minimal average annual water shortage. The results have shown that the pattern of the Optimized rule curves similar to the existing rule curve. The Optimized rule curves were used to simulate the KaengLoeng Chan system for evaluating the situation of water deficit and flood release in long term operation considering synthetic inflow as well as increased inflow of 10%, 20% and 30%. The results have indicated that the situations of water shortage and excess release of the new rule curves are smaller than theirs existing rule curves.Noori [4]presented a Genetic Algorithm model for optimal operation of a multi-reservoir and multi-objective water resource system in GhezelOzan watershed for hydropower generation and flood control is developed. The system is made of two reservoirs in series on the GhezelOzan‟sriver. This model is used for optimal
reservoir operation, allocation of water among different power plants and keeping a part of storage volume to control the probable floods using a definite combination of decision variables.MathurandNikam [6]proposed that in reservoir operation, appropriate methodology for deriving reservoir operating rules should be selected and operating rules should then be formulated. In the present study Genetic Algorithm (GA) has been used to optimize the operation of existing multipurpose reservoir in India, and to derive reservoir operating rules for optimal reservoir operations. The sensitivity analysis of GA model applied to this particular reservoir suggests optimal size of population to be used 250 and probability of crossover of 0.75, to find optimal releases for Upper Wardha reservoir. The model resulted in an irrigation releases equal to irrigation demand. Hence based on the present case study it can be concluded that GA model has the capability to perform efficiently, if applied in real world operation of the reservoir.
II. STUDYAREA
III.IRRIGATIONDEMAND
Irrigation Demand is a very important parameter considered for the present study. In this study, irrigation demand is determined considering crop area and crop water requirement for that particular crop on the monthly basis. The canalefficiency for this project is considered as 60%. So in the final calculated irrigation demand for any particular month, this canal efficiency is added and then it is considered as the final Irrigation Demand for that particular month.
IV.METHODOLOGY
The fitness function of the GA model is to minimize the squared deviation of monthly irrigation demand and squared deviation in mass balance equation in the present study. The objective function is given by equation 1.
( − )2 + ( − (t + 1) + − − )2
Where,
(1)
Rt= monthly irrigation release for the month ‘t’.
Dt= monthly downstream irrigation demand for the month ‘t’. It = monthly inflow during the period ‘t’
St = initial storage in the beginning of month ‘t’. St+1 = final storage at the end of month ‘t’, and
Et = monthly evaporation loss from the reservoir during the month ‘t’.
The constraints and bounds for the above fitness function of GA model are as following: A. Release constraint.
The irrigation release during any month should be less than or equal to the irrigation demand in that month and this constraint is given by,
Rt > , ( 2)
t = 1 to 12
B. Storage constraint.
The reservoir storage in any month should not be more than the capacity of the reservoir and should not be less than the dead storage. Mathematically this constraint expressed as:
Smin≤ StAnd
St≤ Smax (3)
Smin= Dead Storage of the reservoir in MCM and Smax= Maximum capacity of the reservoir in MCM.
V. RESULTS AND DISCUSSION
The data used for calculation of irrigation demand are cropping pattern and crop water requirement for all the crops in the command area on monthly basis.
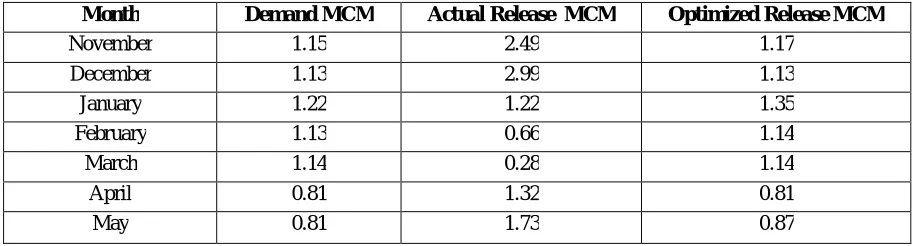
TABLE 1: DEMAND, ACTUAL RELEASE AND OPTIMIZED RELEASE BY GA FOR THE YEAR 2001-02
Month Demand MCM Actual Release MCM Optimized Release MCM
November 1.15 2.49 1.17 December 1.13 2.99 1.13 January 1.22 1.22 1.35 February 1.13 0.66 1.14 March 1.14 0.28 1.14 April 0.81 1.32 0.81 May 0.81 1.73 0.87
Table 1 shows the values of the demand, actual release and optimized release by applying genetic algorithm for each of the month for the year 2001-02From the values of the Releases by GA, it can be shown that for all the months, the demands are completely satisfied.The irrigation demand shown in table 1 is in MCM (Millions Cubic Meter) unit.The data used for the application of Genetic algorithm (GA) to the above formulated model are inflow, demand, actual release, evaporation and storage in MCM.To compute the quantity of water that should be released to meet the monthly irrigation demand is the main objective of the study. The parameters considered in GA are population size of 5, probability of crossover of 0.80, number of generations from 100 to 500 and selection function Roulette wheel selection. Table 1 is represented graphically in Fig. 1.
Fig.1 Demand, Actual Release and Optimized release for Year 2001-02
0 1 2 3 4
NOV DEC JAN FEB MARCH APR MAY
V
o
lu
m
e
o
f
w
a
te
r,
M
C
M
Month
Year:2001-02
Demand MCM
Actual release MCM
From Fig.1, it is observed that in the months of November, December, April, May, the releases optimized by GA is less than the actual release and in the other months, the release optimized by GA is more than the actual release but care is taken to satisfy the demands.
TABLE 2: AMOUNT AND PERCENTAGE OF WATER SAVED IN MCM FOR THE YEAR 2001-02
Month Water Saved in
MCM
Percentage of Water Saved %
November 1.311 52.65 December 1.8593 62.05 January -0.13 * February -0.4766 * March -0.8557 * April 0.5164 39.07
May 0.862 49.83
Table 2 shows the amount of water and percentage of water that can be saved than the actual release using GA for the year 2001-02. From the table 2, in the months of November 1.311 MCM, December 1.8593 MCM, April 0.5164 MCM, May 0.862 MCM the amount of water can be saved and also show that, in the month of November 52.65 % MCM, December 62.05 % MCM, April 39.07% MCM, May 49.83 % MCM the amount of percentage water can be saved than actual release. In the months of January, February, March the optimize release is greater than actual release so that water cannot saved but we can satisfy the demand.
Fig.2Demand, Actual Release and Optimized release for Year 2003-04
From Fig.2, it is observed that in the months of November, December, January, February the releases optimized by GA is less than the actual release and in the other months, the release optimized by GA is more than the actual release but care is taken to satisfy the demands.
0 2 4 6
V
o
lu
m
e
o
f
w
ate
r
,
M
C
M
Month
Year:2003-04
Demand MCM
Actual release MCM
TABLE 3: AMOUNT AND PERCENTAGE OF WATER SAVED IN MCM FOR THE YEAR 2003-04
Month Water Saved in
MCM
Percentage of Water Saved %
OCT -0.265 * NOV 2.1 46.83 DEC 4.263 78.94 JAN 3.105 67.79 FEB 3.579 74.87 MARCH 0.059 4.93
Table 3 shows the amount of water and percentage of water that can be saved than the actual release using GA for the year 2003-04. From the table 3,it can be seen thatthe months of November 2.1 MCM, December 4.263 MCM, January 3.579 MCM, February 3.579 MCM, March 0.059 MCM the amount of water can be saved and also show that in the month of November 46.83 % MCM, December 78.94 % MCM, January 67.79 % MCM, February 74.87 % MCM, March 4.93 % MCM the amount of percentage of water can be saved than actual release. In month of octomber in which the optimize release is greater than actual release so that water is not saved but we can satisfy the demand.
Fig.3 Demand, Actual Release and Optimized release for Year 2004-05
Fig.3 shows the Demand, Actual release and release optimized by applying genetic algorithm for all the month for the year 2004-05. From Fig.3, it is observed that in the month of October, November, December, march, April the release optimized by GA is less than the actual release and in other months the release optimized by GA is more than the actual release, but care is taken to satisfy the demands.
0 0.5 1 1.5 2
V
o
lu
m
e
o
f
w
ate
r
,
M
C
M
Months
Year:2004-05
Demand MCM
Actual release MCM
TABLE 4: AMOUNT AND PERCENTAGE OF WATER SAVED IN MCM FOR THE YEAR 2004-05
Month Water Saved in
MCM
Percentage of Water Saved %
OCT 0.163 31.53 NOV 0.982 55.48 DEC 0.011 1.12 JAN -0.2066 * FEB -0.453 * MARCH 0.789 65.96
APR 0.7846 52.63
Table 4 shows the amount of water and percentage of water that can be saved than the actual release using GA for the year 2004-05. From the table 4,it can be seen that in the months of October 0.163 MCM, November 0.982 MCM, December 0.011 MCM, March 0.789 MCM, April 0.7846 MCM the amount of water can be saved and also show that in the month of October 31.53 % MCM, November 55.48 % MCM, December 1.12 % MCM, March 65.96 % MCM, April 52.63 % MCM the amount of percentage of water can be saved than actual release. In months of January, February in which the optimize release is greater than actual release so that water is not saved but we can satisfy the demand.
Fig.4 Demand, Actual Release and Optimized release for Year 2005-06
From Fig.4, it is observed that in the months of November, December, January, April, May the releases optimized by GA is less than the actual release and in the other months, the release optimized by GA is more than the actual release but care is taken to satisfy the demands.
0 0.5 1 1.5 2
V
o
lu
m
e
o
f
w
ate
r
,
M
C
M
Month
Year:2005-06
Demand MCM
Actual release MCM
TABLE 5: AMOUNT AND PERCENTAGE OF WATER SAVED IN MCM FOR THE YEAR 2005-06
Month Water Saved in
MCM
Percentage of Water Saved %
NOV 0.439
32.16 DEC 0.774 41.21 JAN 0.362 27.14
FEB 0 *
MARCH 0 *
APR 0.735 68.05 MAY 0.677 61.55
Table 5 shows the amount of water and percentage of water that can be saved than the actual release using GA for the year 2005-06. From the table 5, it can be seen that in themonths of November 0.439 MCM, December 0.774 MCM, January 0.362 MCM, April 0.735 MCM, May 0.677 MCM the amount of water can be saved and also show that in the month of November 32.16 % MCM, December 41.21 % MCM, January 27.14 % MCM, April 68.05 % MCM, May 61.55 % MCM the amount of percentage of water can be saved than actual release.
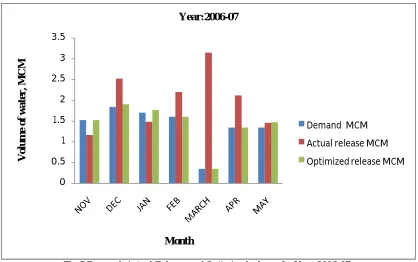
Fig.5 Demand, Actual Release and Optimized release for Year 2006-07
From Fig.5, it is observed that in the months of December, February, March, April, the releases optimized by GA is less than the actual release and in the other months, the release optimized by GA is more than the actual release but care is taken to satisfy the demands.
0 0.5 1 1.5 2 2.5 3 3.5
V
o
lu
m
e
o
f
w
ate
r
,
M
C
M
Month
Year:2006-07
Demand MCM
Actual release MCM
TABLE 6: AMOUNT AND PERCENTAGE OF WATER SAVED IN MCM FOR THE YEAR 2006-07
Month Water Saved in
MCM
Percentage of Water Saved %
NOV -0.36 * DEC 0.617 24.48 JAN -0.285 * FEB 0.598 27.21 MARCH 2.804 89.04 APR 0.775 36.56 MAY -0.011 *
Table 6 shows the amount of water and percentage of water that can be saved than the actual release using GA for the year 2006-07. From the table 6, it can be seen that in themonths of December 0.617 MCM, February 0.598 MCM, March 2.804 MCM, April 0.775 MCM the amount of water can be saved and also show that in the month of December 24.48 % MCM, February 27.21 % MCM, March 89.04 % MCM, April 36.56 % MCM the amount of percentage of water can be saved than actual release.In the months of November, January, May in which the optimize release is greater than actual release so that water is not saved but we can satisfy the demand.
FIG.6DEMAND,ACTUAL RELEASE AND OPTIMIZED RELEASE FOR YEAR 2006-07
From Fig.6, it is observed that in the months of October, November, December, January, February, March, April, May the releases optimized by GA is less than the actual release and in the other months, the release optimized by GA is more than the actual release but care is taken to satisfy the demands.
0 1 2 3 4 5
OCT NOV DEC JAN FEB MARCH APR MAY
V
o
lu
m
e
o
f
w
ate
r
,
M
C
M
Month
Year:2007-08
Demand MCM
Actual release MCM
0 1 2 3 4 5
NOV DEC JAN
V
o
lu
m
e
o
f
w
ate
r
,
M
C
M
Months
Year:2008-09
Demand MCM
Actual release MCM
Optimized release MCM
TABLE 7: AMOUNT AND PERCENTAGE OF WATER SAVED IN MCM FOR THE YEAR 2007-08
Month Water Saved in
MCM
Percentage of Water Saved %
OCT 0.071 21.51 NOV 0.453 22.12 DEC 0.768 28.64 JAN 0.929 35.47 FEB 2.418 56.76 MARCH 1.72 78.59 APR 0.195 36.11 MAY 0.255 42.5
Table 7 shows the amount of water and percentage of water that can be saved than the actual release using GA for the year 2007-08. From the table 7, it can be seen that in themonths of October 0.071 MCM, November 0.453 MCM, December 0.768 MCM, January 0.929 MCM, February 2.418 MCM, March 1.72 MCM, April 0.195 MCM, May 0.255 MCM the amount of water can be saved and also show that in the month of October 21.51 % MCM, November 22.12 % MCM, December 28.64 % MCM, January 35.47 % MCM, February 56.76 % MCM, March 78.59 % MCM, April 36.11% MCM, May 42.5 % MCM the amount of percentage of water can be saved than actual release.
FIG.7DEMAND,ACTUAL RELEASE AND OPTIMIZED RELEASE FOR YEAR 2008-09
0 5
OCT NOV DEC
V
o
lu
m
e
o
f
w
ate
r
,
M
C
M
Month
Year:2009-10
Demand MCM
Actual release MCM
Optimized release MCM
TABLE 8: AMOUNT AND PERCENTAGE OF WATER SAVED IN MCM FOR THE YEAR 2008-09
Month Water Saved in
MCM
Percentage of Water Saved %
NOV 1.319 41.69 DEC 1.8876 49.14 JAN 0.4667 21.19
Table 8 shows the amount of water and percentage of water that can be saved than the actual release using GA for the year 2008-09. From the table 8, it can be seen that inthemonths of November, December, January, the amount of water saved is 1.319, 1.8876, 0.4667 MCM respectively and also From the Table, it can be seen that in the month of November, December, January, the amount of percentage 41.69%, 49.14% 21.19% ,MCM is respectively of water is saved than actual release
.
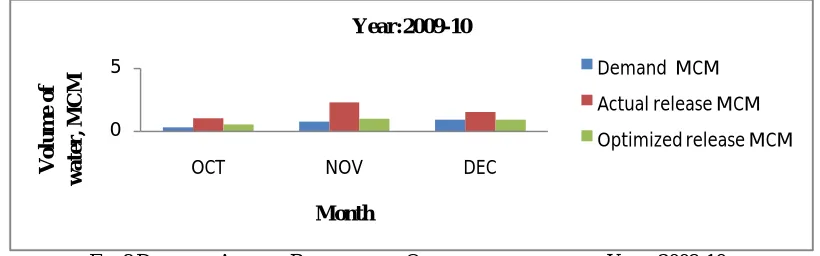
FIG.8DEMAND,ACTUAL RELEASE AND OPTIMIZED RELEASE FOR YEAR 2009-10
From Fig.8, it is observed that in the months of October, November, December, the releases optimized by GA is less than the actual release and in the other months, the release optimized by GA is more than the actual release but care is taken to satisfy the demands.
TABLE 9: AMOUNT AND PERCENTAGE OF WATER SAVED IN MCM FOR THE YEAR 2009-10
Month Water Saved in
MCM
Percentage of Water Saved %
OCT 0.494 47.05 NOV 1.298 55.95 DEC 0.619 39.43
Table 9 shows the amount of water and percentage of water that can be saved than the actual release using GA for the year 2009-10. From the table 9, it can be seen that inthemonths of October, November, December the amount of water saved is 0.494, 55.95, 39.43 MCM respectively and also From the Table, it can be seen that in the month of October, November, December the amount of percentage MCM is respectively of water is saved than actual release.
VI.CONCLUSION
saved than the actual release by GA. Thus, GA model can completely satisfy downstream irrigation demands for all the years considered for the present study and releases are minimized of eight years which leads to considerable amount of saving in water, if applied to the Mazam reservoir project in Gujarat state, India.
REFERENCES
[1]Jothiprakash, V. and Ganesan, S.,“Single reservoir operating policies using genetic algorithm”,Journal of Water Resources Management, vol. 20(6), 917-929, 2006.
[2] Kumar, N. D., Srinivasa R. K. and Ashok, B., “Optimal Reservoir Operation for Irrigation of Multiple Crops using Genetic Algorithms“, Journal of Irrigation and Drainage Engineering, ASCE, 132(2), 123- 129, 2006.
[3]Kangrang, A., Lehner, A., and Mayrhofer, P.,(2011) “An Improvement of Small Reservoir Rule Curves usingGenetic Algorithms and Water Balance Equation‟, Australian Journal of Basic and Applied Sciences, 5(12),707- 714, 2011.
[4] Noori, M., Othman, F., Sharifi, M. B., Heydari, M.,“Multi Objective Operation Optimization of Reservoirs Using Genetic Algorithm (Case Study: Ostoor and Pirtaghi Reservoirs in GhezelOzan Watershed)’, 2nd International Conference on Environment, Energy and Biotechnology, Singapore, 2013.
[5] Janga Reddy M. and Nagesh Kumar D., “Multiobjective differential evolution with application to reservoir system optimization”, Journal of Computing in Civil Engineering, pp-861-878, 2005.
[6] Y.Mathur, S. Nikam, “Single reservoir operating policies using genetic algorithm”. J. of Water Resources Management, vol.20: 917ervoir operation policies using genetic algorithm”, Int. J. EngTechnol(2), 184-187, 2009.
[7]K. SrinivasaRaju and D. Nagesh Kumar, “Irrigation Planning using Genetic Algorithms”.J. of Water Resources Management, vol.18: 163-176, 2004.
[8] Tripathy, U.K. and Pradhan,S.N “Application of Genetic Algorithm for optimal operating policy of the multipurpose Hirakud reservoir of IWWA”44(4),2012, 315-320, 2013.