RAJAGOPAL, NISHA. Modeling and Performance Prediction of IP Multimedia Subsystem
Networks. (Under the direction of Professor Michael Devetsikiotis).
IP Multimedia Subsystem (IMS) is envisioned as the solution for the next
gener-ation multimedia rich communicgener-ation. Based on an open IP infrastructure, IMS enables
access independent convergence of data, speech, video and mobile network technologies.
Session Initiation Protocol (SIP) is the signaling protocol of choice for IMS. In this thesis,
we propose service models for IMS networks with utility functions. These service models
act as control mechanisms to optimize network properties.
We analyze the IMS network based on the SIP signaling delay and predict
perfor-mance trends of the network. Our focus is on the formulation of queueing models for the
IMS network and characterization of the SIP server workload. This approach of theoretical
evaluation combined with realistic performance characterization can be used for designing
IMS networks with optimal performance. Our analysis is based on a careful study of real-life
by
NISHA RAJAGOPAL
A thesis submitted to the Graduate Faculty of North Carolina State University
in partial fulfillment of the requirements for the Degree of
Master of Science
Computer Science
Raleigh
2006
Approved By:
Dr. Michael Devetsikiotis Chair of Advisory Committee
Biography
Nisha Rajagopal was born in Calicut, India on June 5th, 1981. She holds a Bachelors degree
in Computer Science, awarded in June 2003, from Vishveswariya Technological University,
India. Nisha joined North Carolina State University in August 2003 to pursue her Master
of Science in Computer Networking. Her research is in the area of performance evaluation
Acknowledgements
First and foremost, I thank my advisor Dr. Micheal Devetsikiotis. His constant moral
and intellectual support with never ending patience to my countless questions no matter
how silly, have helped me in many ways throughout my Masters. Without our Saturday
morning meetings, my research would never have progressed. I express my sincere thanks
to Dr. Yannis Viniotis for his constructive comments and guidance. My research would
not have been in IP Multimedia Subsystem without his timely help. I thank Dr. Khaled
Harfoush for his insightful comments.
I would like to express my eternal gratitude to my parents for their love and
affection. Their support and absolute faith in my abilities have been a huge motivation.
Without them, my Masters would not have been worth the effort. I would like to thank
Indira and Prasanna Dhore for being my family away from home.
I am thankful to Ruben for being a part of my life. He has been my pillar of
strength during testing times. I thank all my friends for listening to my frustrations and
half-baked theories. Their presence has made my life more meaningful. I thank all my
colleagues at Ericsson IPI for their good wishes and encouragement. A special thanks to
Nandagopal Ancha for taking time to read my thesis. Finally, I would like to thank all the
Contents
List of Figures vii
List of Tables viii
1 Introduction 1
1.1 Motivation . . . 4
1.2 Research Overview . . . 6
1.3 Contribution of this Thesis . . . 7
2 Background 9 2.1 IMS Architecture . . . 10
2.2 IMS and SIP . . . 13
2.2.1 SIP Protocol Details . . . 14
2.3 SIP and Quality of Service . . . 17
3 Related Work 18 4 Service Models for IMS 22 4.1 Theoretical Framework for Performance Measurements . . . 22
4.2 Utility Function for IMS networks . . . 23
4.3 M/G/1 Queueing Model . . . 25
4.4 Analysis of M/G/1 . . . 26
4.5 Illustration using M/M/1 . . . 28
4.5.1 Utility Function with total time for session setup . . . 28
4.5.2 Utility Function with probability of session setup . . . 30
4.5.3 Utility Function with lost connections . . . 32
5 Characterization of SIP Workload 34 5.1 Proposed Characterization Methodology . . . 35
5.2 SIP Packet Flow . . . 35
5.3 Yahoo Case Study . . . 39
5.3.1 Experimental Setup . . . 40
5.4 Gizmo Case Study . . . 44 5.4.1 Methodology . . . 45 5.5 Inferences . . . 48
6 Simulation of SIP Servers 51
7 Conclusion 56
List of Figures
1.1 IMS overview: NGN Convergence . . . 4
2.1 Typical IMS architecture . . . 10
2.2 SIP Message . . . 16
4.1 IMS queueing network . . . 26
4.2 Utility vs. Service rate for M/M/1/∞ model, with constraint τ ≥ K (µ−λ) where K=5 andτ=30 . . . 30
4.3 Utility vs. Service rate for M/M/1/∞model, with constraintK∗e−(µ−λ)T ≤ where K=5 and =0.00005 . . . 31
5.1 Unauthorized Yahoo SIP INVITE Request . . . 36
5.2 401 Unauthorized Yahoo SIP Response . . . 36
5.3 Authorized Yahoo SIP/SDP INVITE Request . . . 37
5.4 SIP/SDP Gizmo INVITE Request . . . 38
5.5 Gizmo RTP packet . . . 39
5.6 Gizmo RTCP Sender’s Report . . . 39
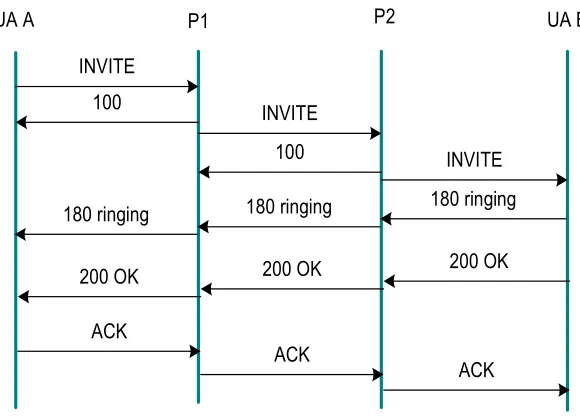
5.7 Typical SIP call flow setup . . . 41
5.8 Yahoo call flow . . . 42
5.9 Yahoo SIP server fitted distribution . . . 43
5.10 SIP call flow with single proxy . . . 45
5.11 Gizmo call flow setup . . . 46
5.12 Gizmo SIP server fitted distribution . . . 47
6.1 SIP network to simulate . . . 52
6.2 Simulation setup . . . 52
List of Tables
5.1 Square Error Values for Yahoo SIP server workload . . . 44
5.2 Goodness of fit tests for Yahoo SIP Server Workload . . . 44
5.3 Square Error Values for Gizmo SIP server workload . . . 47
5.4 Goodness of fit tests for Gizmo SIP Server Workload . . . 48
6.1 Simulated Setup Times . . . 53
Chapter 1
Introduction
The telecommunications world is being revolutionized with the emergence of next
generation networking (NGN). Next-generation networks with IP based cores allows
conver-gence of different network architectures in both wired and wireless worlds. The frontrunners
of this convergence include SIP (Session Initiation Protocol) and IMS (IP Multimedia
Sys-tem) making it possible for triple play services (voice,data and video) to flow over the same
network.
The term Next Generation Network (NGN) is used to describe an integrated,
open network architecture that provides voice, data and multimedia services over the same
network. The concept of integrated services on a single network is not new. Both Broadband
ISDN and ATM deliver integrated services. The fact that NGN is a packet-based QoS
enabled network providing both telecommunication and data services over different access
technologies, sets it apart, making it new and appealing.
Most services today are tightly coupled with a specific transport network and
signaling protocol. NGN separates service-related functions from the underlying
transport-related technologies. This independence between service and transport layer makes the
underlying technology invisible to the user regardless of where in a service,
multi-protocol, multi-vendor environment the user resides [35]. This concept of nomadicity
pro-vides seamless communication between fixed and mobile users.
The most important feature of NGN is the converged, QoS aware infrastructure.
voice etc.) and are handled differently based on their QoS criteria. NGN ensures
trans-parent service availability throughout the network by virtualizing services and provisioning
seamless access to critical information. NGN provides ubiquitous access in a converged
wireless and wireline network by decoupling transport technologies and services.
Lee and Knight [26] explain the difference between NGN and the Internet since
both use IP as one important protocol. One main difference is that NGN does not restrict
service delivery to best effort. NGN is a secure and trustworthy network supporting various
services to meet the user’s dynamic requirements. It also allows the integration of traditional
telephone networks with data communications.
International Telecommunication Union - Telecommunication Standardization
Sec-tor (ITU-T) Study Group 13 defined an NGN in Recommendation Y.2001 [18] as: A
packet-based network able to provide services including telecommunication services and able to
make use of multiple broadband, QoS-enabled transport technologies and in which
service-related functions are independent from underlying transport-service-related technologies. It offers
unrestricted access to users by different service providers. It supports generalized mobility
which will allow consistent and ubiquitous provision of services to users.
Recommendation Y.2001 further characterizes the NGN by the following
funda-mental aspects:
• Packet-based transfer
• Separation of control functions among bearer capabilities, call/session, and
applica-tion/service
• Decoupling of service provision from transport, and provision of open interfaces
• Support for a wide range of services, applications, and mechanisms based on
vice building blocks (including real-time/streaming/non-real-time and multimedia
ser-vices)
• Broadband capabilities with end-to-end quality of service (QoS)
• Interworking with legacy networks via open interfaces
• Generalized mobility
• A variety of identification schemes which can be resolved to IP addresses for the
purposes of routing in IP networks
• Unified service characteristics for the same service as perceived by the user
• Converged services between fixed and mobile networks
• Independence of service-related functions from underlying transport technologies
• Support of multiple last mile technologies
• Compliance with all regulatory requirements concerning emergency communications,
security, privacy etc.
IP Multimedia Subsystem (IMS) is referred as the heart of NGN. IMS is the
next generation IP based infrastructure enabling convergence of data, speech, video and
mobile network technology. It is the envisioned solution that will provide new multimedia
rich communication services by mixing telecom and data on an access independent IP
based architecture, defined in 3rd Generation Partnership Project (3GPP), 3rd Generation
Partnership Project 2 (3GPP2) and Internet Engineering Task Force (IETF) standards.
The IMS architecture [Figure 1.1] will be used by service providers in NGN networks to
offer network controlled multimedia services.
The aim of IMS is to provide all the services, current and future, that the
In-ternet provides with roaming facilities. To achieve these goals, IMS supports peer-to-peer
IP communications between existing technology standards while providing a framework
for inter-operability of voice and data services for both fixed (POTS, ISDN) and mobile
users (802.11, GSM, CDMA, UMTS). It provides session control, connection control and
an application services framework with both subscriber and services data, while allowing
interoperability of these converged services between subscribers. IMS truly merges the
In-ternet with the cellular world; it uses cellular technologies to provide ubiquitous access and
Internet technologies to provide appealing services [1].
IMS essentially replaces the control infrastructure in the traditional circuit-switched
telephone network, separating services from the underlying networks that carry them. IMS
has a signaling and media plane which work separately, unlike PSTN. The signaling plane
IMS Network 3 CSCF SIP Proxy Media Gateway HSS Legacy Gateway AS AS AS
IMS Network 1 2G UMTS PSTN IMS Core CSCF SIP Proxy Media Gateway HSS Legacy Gateway AS AS
IMS Network 2
3G 2.5G PSTN IMS Core CSCF SIP Proxy Media Gateway HSS Legacy Gateway AS AS AS CDMA
Internet IMS Core
Figure 1.1: IMS overview: NGN Convergence
manages the media encoding and transport issues. IMS enables services such as text
mes-saging, voice mail and file sharing to reside on application servers anywhere and be delivered
by multiple wired and wireless service providers.
1.1
Motivation
The emergence of new technologies has led to the birth of new applications with
VoIP, IPTV, Presence etc. This convergence has increased the demand for services with
new performance characteristics; a proposition that decides the future of service provider’s
business.
Wong and Verma [36] discuss the advantages and disadvantages of providing new
IP multimedia service capabilites as opposed to basic IP connectivity from a subscriber,
provided by plain vanilla Internet service provider compels the subscribers to use third-party
providers for IP multimedia services and applications.
While the network operators may lose potential revenue by not providing basic IP
multimedia services like voice-over-IP call capability, it would be difficult to predict which
services would be profitable and popular with the customers. So the network operator
pro-vides flexibility by allowing third party applications while focusing on their core competency
of providing connectivity. A drawback would be lack of reliability, quality issues caused by
careless reuse by subscribers of IP multimedia applications, leading to loss of customers and
revenue.
Today most of our services are offered by both cable television and
telecommu-nication operators. Service providers are struggling with the opportunities and challenges
that the convergence presents while striving to gain a foothold in the market segment. It
is assumed that an integrated solution with a combination of services will bolster customer
satisfaction to encourage loyalty and discourage churn. Interoperability between different
service providers is not considered as a design target.
As service providers build out their 3G, broadband and converged networks, they
are moving to a business model that makes the quick introduction of new services while
exploiting the full revenue potential of these new services and having the flexibility of
scaling easily. Service providers must now focus on management of the network resources
to optimize the performance of the services they deliver.
Expectations of the sophisticated customers from the service providers has
multi-plied with the new technologies, requiring complicated and customized solutions for their
satisfaction. Service providers need to monitor and manage network traffic to optimize
performance in order to meet the guaranteed levels of service promised to their customers.
Effective monitoring of network performance and analysis of network data to correlate
end-to-end service performance is essential for the thorough understanding of network behavior
[6].
Deploying new applications in a service provider environment creates rigorous
demands on the network infrastructure and the network operations staff. Service providers
are often targets of easy purchase of new technology products from application vendors.
Scalability, flexibility and integration of diverse applications is critical to support large and
complex networks while reducing the operational cost of the network.
competi-tive environment with increased customer focus is, not only seamless transition between
disparate network topologies but also the flexibility to embrace new service deployment
technologies such as the IP Media Subsystem (IMS). Such issues are mostly associated with
determining the right business model, back-end support and economic environment rather
than technology. Service providers need a model that makes quick introduction of new
services of primary importance, while fully exploiting their full revenue potential and
hav-ing the flexibility to accommodate easy scalhav-ing of networks. For example, ushav-ing the right
billing platform to address a variety of subscriber demographics or having the appropriate
subscriber density to financially justify the introduction of a new service are a few factors
that affect decisions to offer IP multimedia services.
Our research focuses on methodologies to evaluate IMS based architecture from
the viewpoint of service providers. We define service models for the IMS network with
util-ity functions and optimize the desired properties like the service rate to achieve maximum
revenue generation. Such an economic-theoretic performance evaluation provides flexibility
in the use of network resources [7]. This significantly simplifies the mathematical
compu-tations without reducing the qualitative applicability of results. The service models with
utility functions also serve as decentralized control mechanisms to optimize the network
properties while studying revenue generation trends in networks.
1.2
Research Overview
In our service models, we abstract the entire IMS network into a tandem queueing
model. Classical queueing theory is used to obtain insights on the performance of the
network. As the QoS in IMS for any connection is negotiated during the session setup phase,
we illustrate formal methods of modeling the network from an end-to-end session setup delay
perspective. We demonstrate variations in the modeling by introducing constraints in the
network parameters that the service provider might wish to apply.
The network performance is analyzed over different network scenarios and the
maximum utility is determined by optimizing the server service rate. Results show trends
in the network performance which can be used to strategize the QoS guarantees of the
network. Results remain consistent over different scenarios with different constraints.
signaling messages and propose a methodology to derive the approximate workload for
a SIP server. The methodology described could be applied to any server to obtain its
workload. Case-studies using popular publicly accessible SIP clients were conducted to
characterize the server workload and to gain insights into the structure of SIP servers. This
characterization can be inputted into network testing benchmarks and utilized for predicting
network performance.
Using simulation, we identify the nature of dependence of the utility with the
network parameters. We perform capacity planning by achieving a favorable number of
servers with optimized utilization. This approach to evaluate the network is extremely
useful for planning and efficiently structuring the network resources.
1.3
Contribution of this Thesis
Today with IMS becoming a fast reality, service providers are competing to offer
IP multimedia services. Service providers are streamlining their operations and are focusing
on efficient network management to facilitate an improved revenue stream by efficient use
of network resources. The resulting saving can be used to fund new and improved service
options.
Capacity planning, monitoring network performance and analyzing the relevant
data gives the service provider the ability to direct network performance effectively into
network actions. An ideal performance management solution is platform independent and
extensible while providing integrated, total network coverage. The ideal solution must
allow service providers to monitor ongoing physical network performance, analyze its data
to correlate end-to-end service performance, and finally, to take action based on a complete
understanding of network behavior [6].
Predicting trends of performance is an important phase in the planning and
im-plementation of the network. Its value is more prominent in networks with strict service
guarantees. We focus more on the approach of abstraction of IMS network with realistic
network workload. Such an analysis should be useful for service providers like Sprint or
Verizon who would like to setup their network with efficient utilization and maximum
rev-enues. Deciding on parameters like number of servers, placement, service level and quality
Tekelec SIP servers, it would need a modeling tool to plan and design the network. It
can use our approach and analyze the network for quick trends on anticipated performance
levels to decide on design parameters.
Such a depth of research is crucial if the service provider must employ service
level agreements (SLAs). The SLAs give the service providers a better understanding of
the expectations of the customer. Providers who follow such a pattern of planning and
performance analysis can consistently perform well and improve network infrastructure to
accommodate their customer’s evolving needs.
The IMS architecture requires the service providers to change the conceptual and
physical make-up of their network architecture and service models. They are required to
add new infrastructure like application servers, gateways, soft-switches etc. before being
able to provide services. It is unlikely that any service provider will make a leap into IMS
architecture without planning and testing while considering the network’s new features and
eventually migrating to services. It is critical for providers to minimize their risks and
maximize the return on their current infrastructure investments while evolving to IMS. Our
proposal helps service providers take the best approach while purchasing IMS components.
Planning and analysis as we suggest offer service providers the incremental steps for a
Chapter 2
Background
IMS is likely to become the norm for all broadband access, forming the foundation
of emerging next generation networks. The different protocols in IMS focus on delivering
different services including presence, instant messaging and push to talk [30]. IMS builds
on IETF protocols like SIP, SDP, DIAMETER, MGCP etc. to create a robust and
com-plete multi-media system with operational profiles providing support for operator control,
charging and billing, and security.
The IMS upon which NGN is based uses the Session Initiation Protocol (SIP) to
tailor a telephony-oriented signaling network over the IP cloud. It is the new wireless/wired
control plane replacing the earlier telco’s SS7 signaling. An IMS network consists of many
SIP proxy servers that mediate customer connections and access to network resources. Each
user has an associated home network and can roam across wired and wireless networks. IMS
also has a policy engine and authentication, authorization and accounting (AAA) server for
operator control and security.
IMS-based services provide person-to-person and person-to-content
communica-tions of voice, text, pictures and videos in a variety of modes in highly personalized and
controlled way. Integration with data and voice networks with interoperability and roaming
Figure 2.1: Typical IMS architecture
2.1
IMS Architecture
The IMS architecture is a collection of functional components linked by
stan-dardized interfaces [Figure 2.1]. An IMS based network comprises of many SIP servers,
user databases known as Home Subscriber Servers (HSS), Application Servers (AS), Media
Resource Functions (MRF), Public Switched Telephone Network (PSTN) gateways etc to
mediate all customer connections and access to network resources [30].
Access Network
The user can connect to an IMS network using fixed access, mobile access or
wireless access methods that use the standard Internet Protocol (IP). Direct IMS terminals
like mobile phones, PDAs, computers etc. can register directly into an IMS network using
with non IMS-compatible VoIP systems can connect through gateways.
Core Network
The core network facilitates standards-based communication to application
ser-vices. The components in the core network are described below:
Call Session Control Function
The Call Session Control Function (CSCF) is the session routing point in the IMS
core network. CSCFs are dynamically associated, service-independent and standardized
access points. It distributes incoming calls to the application services and handles initial
subscriber authentication. The CSCF uses SIP messages to pass the call event to the service
and adds additional header information to maintain control of the call. IMS has a
user-focused approach for delivery of services. It allows users to access personal services through
CSCFs.
The CSCF component uses IMS Service Control (ISC) interface to intercept call
signaling and pass it to application services for processing. The ISC interface compares these
filters with the incoming SIP message and using the information stored in HSS determines
which application services should be invoked and in which sequence. IMS uses a Session
Border Controller component to route calls through the firewall to the CSCF component
within the IMS network. CSCFs are discussed in detail in Section 2.2.
Application Server
This is a SIP entity that hosts and executes services. IMS allows reuse of functions
for fast service creation and delivery. Multiple services like telephony and messaging can be
hosted by a single Application Server. Collating services in one Application Server reduces
the workload of CSCF in the control layer.
PSTN Gateways
PSTN Gateways provide interfaces to circuit switched networks, allowing IMS
into MGCF, SGW and MGW functions.
• Media Gateway Control Function (MGCF)
This is the central node of PSTN gateway that routes calls from or to legacy platforms
like SS7/TDM channels or PSTN/PLMN networks. All calls routed through these
media gateways enter the IMS core network as SIP/RTP media streams. RTP streams
are routed directly between media servers, gateways and endpoints. The MGCF
controls the resources in MGW.
• Signaling Gateway (SGW)
This interfaces the signaling plane of the PSTN network or circuit switched networks.
• Media Gateway (MGW)
MGW interfaces the media plane of the PSTN and circuit switched networks.
Media Servers
Media Resource Function (MRF) provides the source of media in the home
net-work. The signaling plane is referred as Media Resource Function Controller (MRFC) and
the media plane is the Media Resource Function Processor (MRFP). The MRFC
commu-nicates with an application service and directs a separate media server to handle the media
stream. It controls the resources in the MRFP. The MRFP implements all media-related
functions like playing or mixing media.
Home Subscriber Server
The Home Subscriber Server (HSS) provides a central repository for subscriber
in-formation. The HSS stores all subscriber information required to establish sessions between
users and provide services to subscribers. The HSS stores subscriber registration,
prefer-ences, user profile information, location and service information. Networks with a single
HSS do need an Subscriber Location Functions (SLF). The SLF maps the user’s address
to HSSs. A node that queries the SLF, with user address as input, obtains the HSS that
Charging Entities
Charging entities are used to control billing information for subscribers using
net-work services. The interfaces used by an application service for charging entities are
main-tained in the IMS network. IMS uses Diameter messages for offline (Rf) and online (Ro)
charging entities.
Different functional components are used for providing different services. For
ex-ample, to transport media, IMS uses Call Session Control Function (CSCF), Session Border
Controller (SBC), IMS Service Control Interface (ISC), Media Gateway Control Function
(MGCF), Media Resources Function (MRF), Media Resource Function Controller (MRFC),
Home Subscriber Server (HSS) and Charging Entities.
2.2
IMS and SIP
IMS has a number of different protocols with each serving a particular function.
This allows for modularity, flexibility, simplicity and extensibility when building such a
diverse, robust and complex network infrastructure. Signaling protocols are meant for the
end points involved in the call and the network routers treat these signaling packets as any
regular data, ignoring any semantics implied by them.
The Session Initiation Protocol (SIP) [32] lies at the core of the IMS architecture.
SIP is the real-time communication protocol responsible for VoIP in IMS. SIP has been
expanded to support video and instant-messaging applications. Based on SIP, IMS defines
standard control plane interfaces for creating new applications. SIP is designed to perform
basic call-control tasks, such as session call set up and tear down and signaling for features
such as call hold, caller ID, conferencing and call transferring.
SIP is an open standard that is well-supported throughout the carrier and vendor
community. SIP implementation is popular due its compatibility with other standards
like Voice XML. This interoperability allows developers to focus on both service logic and
application services and create efficient services. Also the inherent SIP framework allows
service providers to quickly introduce extensions like security, compression etc. to meet the
evolving network and service needs [29].
The SIP servers are the essential nodes of IMS. They are collectively referred
(P-CSCF), Interrogating-CSCF (I-CSCF) and Serving-CSCF (S-CSCF) [4].
• Proxy-CSCF
P-CSCF is the first point of contact for the IMS terminal. It acts as an outbound/inbound
SIP proxy server performing user authentication and verification of correctness of SIP
requests. P-CSCF is assigned during the registration and is on the path of all signaling
messages. Authentication using IPsec, compression, QoS policy control and charging
are performed by the P-CSCF.
• Interrogating-CSCF
I-CSCF is a SIP proxy located at the edge of an administrative domain. It queries
the HSS using the DIAMETER Cx and Dx interfaces and retrieves the user location
information for routing purposes. I-CSCF’s IP address is published in the DNS of
the domain for usage by the P-CSCF in a visited domain or a S-CSCF in a foreign
domain as an entry point for all SIP packets to that domain.
• Serving-CSCF
S-CSCF is the central node of the signaling plane. Its a SIP server that acts as
a registrar while performing session control and routing services. S-CSCF is always
located in the home network. It decides to which application server(s) the SIP message
will be forwarded to, in order to provide the services and enforce the policy of the
network operator.
Each IMS connection has an initial setup phase during which the service
parame-ters of the connection are negotiated between the source, destination and the intermediate
CSCFs. We refer to all these components generically as “servers”.
2.2.1 SIP Protocol Details
Sequencing, inter-media synchronization, payload identification and frame
indica-tion are services provided by a transport protocol. The Real-time Transport Protocol (RTP)
provides services needed for generic real time media like voice and video. The Real Time
Control Protocol (RTCP), which is a subpart of RTP provides QoS feedback. Receivers
informa-tion to adjust the data rate [34]. A session is referred as a single RTP session carrying a
single media type.
A session description describes the capabilities of a session and contains
informa-tion required to join the session. Session Descripinforma-tion Protocol (SDP) is used to describe
multimedia sessions. In multimedia sessions, the information includes the IP address and
the port number where the media is accpeted and the codecs to be used to encode the
media.
SIP makes minimal assumptions about the underlying transport protocol. It can
be directly used with any datagram or stream protocol, provided that either a whole SIP
message gets delivered or no message is delivered. SIP can thus be used with UDP or TCP
in the Internet, and with X.25, ATM, IPX or PPP.
A SIP connection is initiated by issuing an INVITE request, and terminated by
issuing a BYE request. SIP has several messages. For example, INVITE message invites a
user to a call and establishes a new connection while a BYE message terminates a connection
between two users. OPTIONS message solicits information about capabilities, but does
not set up a connection and STATUS message informs another server about the progress
of signaling actions that it has requested. ACK is used for reliable message exchanges for
invitations. CANCEL terminates a search for a user while REGISTER conveys information
about a users location to a SIP server.
SIP is a request-response protocol. When a SIP endpoint is contacted with a
request, it sends back a response to the sender. The response has a response code and a
response message. There are 6 different classes of response codes that fall from 100 to 600.
Responses in the 100 category denoted as 1xx indicate call progress and are provisional.
They are always followed by other responses indicating the final outcome of the request like
2xx for success, 3xx for redirection, 4xx, 5xx and 6xx for client, server and global failures
respectively. All responses are confirmed with an ACK request to ensure reliability.
SIP is a text-based protocol unlike other signaling protocols like Q.931 and H.323.
All parameters in SIP headers have a corresponding value with a single level of sub
param-eters. SIP identifies users using SIP Uniform Resource Identifiers (URI), which are similar
to email addresses. SIP URIs consist of a user name and a domain name.
All SIP messages start with a request line in requests and a status line in
responses as in Figure 2.2. This is followed by the SIP header fields of the formatname:value.
Request-Line: INVITE sip:[email protected]:5061;transport=tcp SIP/2.0 Message Header
From: timetest345<sip:[email protected]:5061>; tag=5d00690-0-13bb-12060-55d2f8bb-12060
To: <sip:[email protected]:5061>
Call-ID: [email protected] CSeq: 1 INVITE
Max-Forwards: 70
Via: SIP/2.0/TCP 10.10.10.5:5051;branch=z9hG4bK-12060-46678cd-70054828 Contact: <sip:[email protected]:5051;transport=tcp>
Content-Length: 0
1
Figure 2.2: SIP Message
The request line consists of a method name, the Request-URI and the protocol version.
The method name indicates the purpose of the request and the Request-URI contains the
destination of the request.
SIP messages contain a set of mandatory header fields as in Figure 2.2. They are
To,From,CSeq,Call-ID,Max-Forwards andVia.
• The header fieldTocontains the URI of the destination. Thetagparameter serves as
a mechanism to identify a dialog, which is the combination of the Call-ID along with
two tags, one from each participant in the dialog.
• The Fromheader fields contains the URI of the sender,
• The Cseq header contains the sequence number and a method name. They are used
to match requests and responses.
• The Call-IDprovides a unique identifier for a SIP session.
• The Max-Forwards header is used to avoid routing loops. Every server that handles
a request decrements its value by one, and if it reaches zero the request is discarded.
• TheViaheader field keeps track of all the proxies a request has traversed. TheseVia
entries are used to route the responses.
The message body is separated from the headers by an empty line. A set of header
Message bodies are transmitted end to end. So the proxies do not parse the message body
to route the message. SIP agents can choose to encrypt the contents of the message body
for security purposes. We monitor SIP sessions and analyze the QoS parameters in the SIP
messages in Chapter 5.
2.3
SIP and Quality of Service
3GPP stresses that the IMS architecture be viewed as a collection of functions
linked by standardized interfaces. Quality of service is one of the main reasons for the
emergence of IMS. IMS ensures QoS by session layer negotiation with resources granted at
transport layer. It provides correlated accounting or charging among service, session and
transport layers under operator control.
SIP establishes connections between two or more endpoints in an IP network. The
QoS parameters for the session are negotiated during the setup. Thus, performance
evalu-ation of IMS based networks from a QoS perspective is essential. We propose a modeling
methodology that uses real-life workload characterization, queueing analysis and
optimiza-tion to provide a systematic way to select system design parameters, such that the QoS
Chapter 3
Related Work
Most of IMS-related research has been focused on the engineering rules, protocol
development, compatibility issues and refinements of SIP. Performance evaluation from
an end-to-end perspective and capacity planning are areas that haven’t been given the
much needed attention. With the entire telecommunication industry working towards the
convergence, envisioning new IP multimedia services with QoS, the assessment of setup
delay using SIP needs to be critically evaluated.
ITU-T Recommendation E.721 provides guidelines on network grade of service
parameters and target values for circuit-switched services in the evolving ISDN [17].
Rec-ommendation E.721 specifies post selection delays as 3 seconds for local connection using
ISDN. With this as a requirement, a study of IMS architecture based on delay sensitivity
is a must for QoS guarantees.
Analysis of performance metrics based on network parameters like number of
servers, arrival rates of traffic into the network and service rates can ensure efficient resource
utilization while providing the promised QoS. Capacity planning of IMS based networks will
be simplified if effective trends of performance can predicted quickly.
Eyers and Schulzrinne [10] cover SIP call setup delay based on SIP and H.323
traces from the Surveyor database. The Surveyor project provided the continuous delay
and loss statistics for UDP packets between selected cities. The focus is on delay due to
UDP loss and assumptions are made about the processing times of tasks. Kist and Harris
queueing delays to be less than 5 ms based on current web server implementations and
assume the SIP servers to have exponential service distribution.
Haase et al propose a unified mobility manager (UMM) for effective inter-working
of wireless networks and voice over IP networks. The UMM reduces performance
degrada-tion by combining UMTS Home Locadegrada-tion Register (HLR) and SIP proxy funcdegrada-tionality in
one logical entity. The focus is on integration of SIP in UMTS with PSTN [14]. Curcio and
Lundan [8] study SIP call setup time in 3G networks and compare it with call setup time
over LAN networks. The effect of SIP calls over lossy channels with restricted bandwidth
is also studied.
Fathiet al evaluate SIP session setup delay with various underlying protocols like
transport control protocol (TCP), user datagram protocol (UDP), radio link protocol (RLP)
as a function of the frame error rate (FER) [11]. The processing delays and queueing delays
through the different SIP servers are not considered in the analysis. Kueh et al study the
performance of SIP-based session setup over the S-UMTS with consideration to the larger
propagation delay over the satellite as well as the impact of the UMTS radio interface under
different channel conditions [24].
The service availability of VoIP in the current Internet was studied by Jiang and
Schulzrinne [19]. Several metrics of availability like call success probability, time loss below
a threshold, distribution of network outages and the call abortion probability induced by
the outages were analyzed.
The SIPstone Benchmark [33] by Schulzrinne et al attempts to measure request
handling capacity of SIP servers. It is useful as a tool for dimensioning and
provision-ing of the SIP network. SIPstone is designed as a benchmark with a sprovision-ingle standardized
implementation and workload. The workload is simple and exercises a breadth of system
components associated with this environment like concurrent initiation of calls by multiple
users, random call arrivals and the forwarding of requests. Such an approach is helpful from
a SIP server developer’s point of view and not from the service provider.
Chebbo and Wilson [5] describe a flexible modeling tool developed in Fujitsu Labs
for a mobile operator network using SIP as the control protocol. The tool is implemented in
Excel and incorporates a traffic model, a SIP server model, a functional model, and a system
model based on the estimated user activity. The effect of moving functionalities between
the different IMS entities is also studied using the tool by comparison of the bandwidth
M/M/1 queue with exponential service times. Our models are based on a realistic workload
with delay based parameters.
In Zhu [38] analysis is performed of a SIP network in IMS from a UMTS perspective
under a controlled environment with bottlenecks. The traffic in the network is assumed to
be following an M/D/1 model.
Banerjeeet al perform a case study for a heterogeneous network with IP backbone
having a combination of UMTS and WLAN access networks, to evaluate the performance
of SIP-based mobility management. The numerical analysis has been performed using
a heterogeneous queueing network with M/M/1 queue models for CSCFs and a priority
based M/G/1 model for the destination server [2].
IMS network throughput is dependent on the capacity, capability and efficiency
of the SIP server to a large extent. Better implementation of the SIP server with higher
processor speed and more memory will enhance the performance of the network significantly.
The response times of these servers directly effect the call setup delay. We attempt to
characterize the SIP server workload more realistically by monitoring actual traffic and
deducing a service distribution pattern. This effort was motivated by the complete lack of
literature related to realistic SIP server workload and the SIP message processing times.
In Wu et al [37], SIP performance is evaluated for SIP-T which is an effort to
pro-vide the integration of legacy telephone signaling into SIP messages through encapsulation
and translation. Evaluation is based on QoS parameters and system performance of MGC
(Media Gateway Controller) in carrier class VoIP network. Our analysis is based on the
SIP definitions in RFC 3261 [32].
Gurbani et al analyze the performance and reliability of an end-to-end native
SIP ecosystem under varying network parameters through a hierarchical performance and
reliability model [13]. The mean response time for a proxy server is computed based on
service time assumptions; for example, the INVITE service rate is fixed at 0.5 ms−1. Our research analyzes the IMS architecture’s performance from an end to end delay perspective.
We propose to view the entire IMS architecture as a open feed forward tandem queueing
network and predict trends in performance based on our analysis.
End-to-end QoS monitoring and distributed monitoring with link degradation
de-tections for IMS have become popular recently. QoS monitoring is essential for tracking
the ongoing QoS, for comparison of monitored QoS against the expected performance, for
sustain the delivery of the guranteed QoS.
In an end-to-end QoS monitoring approach, only the end-to-end QoS between the
sender and receiver of a real-time flow is monitored. In a QoS distribution monitoring
approach, the QoS distribution experienced by the flow in different network segments is
monitored in addition to the end-to-end QoS. Tham et al describe the challenges involved
in providing QoS distribution monitoring and propose solutions that can be directly adopted
in monitoring many QoS parameters like throughput, loss rate etc [20].
Ratyet al discuss the feasible placements of network analyzing and monitoring tool
to survey the protocol communication in IMS. The placement of the tool can be either at
the endpoints or at the common point(s) in the communication path between the endpoints.
The network analyzing and monitoring tool can survey the network for QoS attributes once
the SIP connections are setup. Protocol information of SIP, SDP, UDP, RTP, RTCP can
be collected at the endpoints [31]. Using a subset of the methodology we describe for
SIP workload characterization, the end-to-end real-time traffic and the QoS parameters
negotiated can be easily monitored. We discuss this in Chapter 5. In what follows, we
Chapter 4
Service Models for IMS
Our research focuses on developing formal methods for optimizing the utilization
of network resources while maximizing the revenues generated. We propose service models
for planning and performance prediction which can help service providers built an IMS
network successfully. Planning is a crucial phase in the deployment of any network. It is
critical for service providers to model and dimension their network, evaluate and predict
trends in the network before actually deploying it.
4.1
Theoretical Framework for Performance Measurements
With IMS becoming a reality, the market is buzzing with different vendors
offer-ing their IMS solution for the next generation. IMS is an architecture that standardizes
functionalities and does not have any specifications on the nodes. Implementors are free to
combine two or more functions into a single node or can split a function into two or more
nodes. This flexibility in the specifications has led each vendor to develop their own IMS
solution.
Today’s market is competing with many network equipment supplier’s IMS
so-lutions like Nokia’s fixed mobile convergence, Motorola’s global applications management
architecture, Cisco’s service exchange solutions for IMS and similar convergence solutions
approach deployment of a complete IMS network. With so many choices to choose from, the
service providers need a little direction and guidance. They need some quick performance
evaluations and insights into the network trends with different vendor solutions before
in-vesting. This is crucial with IMS as it offers excellent QoS with all of its multimedia services.
Service providers must know their capacity and network constraints for satisfying the SLA
criteria. They must also manage the network resources efficiently to get most return of
their investment. Our research aims to provide the service providers easy and incremental
steps for a reasonable deployment of a full IMS network with maximum returns.
Most multimedia sessions are delay sensitive and require fast setups. IMS is the
next generation solution for a complete fixed-mobile convergence between data and circuit
switched networks like PSTN. It is expected to replace the traditional and dedicated circuit
switched plain old telephone service (POTS). Thus, IMS is required to prove its competence
by meeting the grade of service parameters set for circuit-swiched services in evolving ISDN.
ITU-T recommendation E.721 [17] specifies a post dial delay of 3 seconds for a local
con-nection, 5 seconds for a toll connection within the country and 8 seconds for international
connections.
We study the IMS network from an end-to-end delay perspective. The focus is on
SIP signaling delay during which the connection between the end-points with the desired
QoS is setup. We denote the network as a utility function and perform queueing analysis.
The utility function is then optimized to achieve the maximum revenue. The analysis helps
us predict trends in the performance of the network. We also propose a methodology to
characterize the workload of SIP servers in the network, discussed in Chapter 5.
4.2
Utility Function for IMS networks
Economics is generally used to study revenue generation in networks. They also
serve as decentralized control mechanisms to optimize the network properties. Such an
economic-theoretic performance evaluation provides flexibility in the use of network
re-sources [7]. This significantly simplifies the mathematical computations without reducing
the qualitative applicability of results. In our modeling we define utility functions for the
IMS network and optimize the service rate to achieve maximum revenue generation.
evaluations. An economic performance evaluation helps the service provider analyze the
flexibility and the ability of the network to adapt and customize various services. Such an
economic perspective views the network and its customers as a whole and defines the system
performance to include the value the customers obtain from using the network services.
The service provider offers a variety of services and gains revenues based on the
customer subscription to those services. Profit is gained when the revenues earned exceeds
the cost of operating the network. The provider also faces losses with outages in the network
due to which the promised QoS criteria is not satisfied and the customers are churned.
Satisfying the QoS requirements is crucial in IMS networks. The session setup must be fast
for quicker connections and must be completed within a specified time period. We capture
these factors with our utility function for IMS networks.
We model the utility function of an IMS network as
U =V(λ)−C−(Φexpected−Φactual) (4.1)
Here U is the utility, V(λ) is the revenue earned by serving λ connections, C is the cost compensation for maintainingKservers in the network and (Φexpected−Φactual) is a penalty
function representing revenue losses due to lost connections. Φexpected is the desired target
time to complete the session setup and Φactualis the actual response time within which the
session was completed.
Each connection involves a session setup delay during which the service parameters
are mutually agreed upon by the source and destination. We assume connections to be lost
if the session setup delay for that connection exceeds a threshold time limit of Φexpected.
V(λ) is the income earned by the service provider by servingλnumber of connec-tions. We assume this income to be constant to model a flat charge tariff on the customer
for the usage of the network resources. Dynamic models with different pricing schemes can
also be modeled similarly. For example, the revenue generated could be dependent on other
variable network parameters like the number of servers, the capacity of the server or the
service rate of the server etc.
The penalty function (Φexpected−Φactual) in (4.1) is computed based on different
criteria and constraints. We evaluate the penalty function for the following scenarios:
2. Probability of session setup over K i.i.d. servers being completed within threshold time limitτ
3. Penalty ofc being incurred for each lost connection
These scenarios could be used as constraints or to calculate the penalty function.
Cost compensationCin (4.1) should model the variance in the costs for supporting the network along the expansion path. We assume that the cost of a single server is a
function of its service rate. The number of servers in the network are linearly dependent on
their service rates. So the cost compensation is the product of the number of the servers in
the network,K, and the cost function G(µ):
C=K∗G(µ) (4.2)
The cost function in (4.2) is represented as
G(µ) =aµ−bµ2 (4.3)
whereais the cost of each server based on its service rate µand bis the sales volume like a discount rate to model the economics of scale. The concavity of the server cost with respect
to its service rate is captured by this quadratic equation. The values of parameters a and
b are assumed to be externally provided corresponding to the current infrastructure costs [15]. Using the first derivative of the cost function, the upper bound for the cost function
is obtained. The maximum value for the cost function is at 2ab.
The mean service rate of the server is assumed to be greater than or equal to the
mean arrival rate to model fast connection setups, i.e., µ ≥ λ. This condition limits the values for µ in the range µ ∈ [λ,2ab]. This is derived from the quadratic cost function in (4.3).
In what follows, we propose a tandem M/G/1 queueing network as the service
model for IMS network. We optimize the utility function for a maximum service rate for
the efficient usage of the network resources while getting maximum returns.
4.3
M/G/1 Queueing Model
of λ. The service time distribution of the servers in the network can be geometric, beta, gamma, etc. We assume the service time distribution to be general with definite first and
second moments. TheK servers have infinite queues and do not experience any losses due to buffer overflows. We abstract such a network as a feed-forward tandem queueing network
withK servers of type M/G/1/∞.
For example, in Figure 4.1 we have an IMS network with P-CSCF, I-CSCF and
S-CSCF represented as a queueing network. All signaling messages during the connection
setup have to traverse through these three CSCF sequentially. This can be viewed as a
feed-forward tandem path. The processing time and the queueing delay experienced in
source
P I S
destination
Figure 4.1: IMS queueing network
the CSCFs and any other components that may be present in the IMS network are aptly
captured by this feed-forward tandem M/G/1 queueing model.
4.4
Analysis of M/G/1
In an M/G/1 queueing system, the average response time can be computed using
the Pollaczek - Khintchine mean value formula [23]
Tavg = ¯x+λx¯2∗
(1 +Cb2)
2(1−λx¯) (4.4)
where ¯xis the mean service time, i.e. 1µ andCb2 is the coefficient of variation for the service time.
We evaluate this M/G/1 queueing network based on the earlier defined scenario
The optimal utility function is written in terms of ¯x as
ˆ
U =max¯x
V −K(ax¯−bx¯2)−β(τ −K∗Tavg)
(4.5)
ˆ
U =max¯x
V −K(ax¯−bx¯2)−β
τ−K∗
¯
x+λx¯
2∗(1 +C2
b)
2(1−λx¯)
(4.6)
For ease in calculation we assumeM = (1 +C2
b) as a predetermined constant.
The first order derivative is
∂U
∂x¯ =−aK+ 2bKx¯+Kβ+
KβλxM¯ (1−λx¯) +
Kβλ2x¯2M
2(1−λx¯)2 = 0
Since solving for the closed form of ¯xis difficult, we deduce some properties of the solution by applying the conjugate pair theorem from calculus [9]. The conjugate pair theorem states
that for a maximization problem maxx F(x,a), the derivative ∂x
∗
∂a and the cross partialFxa
both have the same sign. Using the conjugate theorem we obtain the following analysis:
1. If the costaincreases, the service time ¯x decreases.
U¯xa=−K→ ∂U∗
∂a <0
2. If the costb increases, the service time ¯x increases.
Uxb¯ = 2Kx¯→
∂U∗ ∂b >0
3. If the penalty for losing requestsβ increases, the service time ¯x increases.
Uxβ¯ =K+
KλxM¯ (1−λx¯) +
Kβλ2x¯2M
2(1−λx¯)2 →
∂U∗ ∂β >0
4. If the arrival rate λincreases, the service time ¯x increases.
Uxλ¯ =
KβxM¯ (1−λx¯) +
2Kβλx¯2M
(1−λx¯)2 +
Kβλx¯3M
(1−λx¯)3 →
∂U∗ ∂λ >0
Now, a general service time distribution is difficult to solve if its not in a closed
form. Although, in some special cases we can still use M/G/1 analysis. Analysis of penalty
scenarios 2 and 3 require calculation of the tail probabilities of the queueing distribution
which is hard to solve. Such cases can be solved numerically. For example, certain advanced
techniques are described in [27], [12] that use the measured samples to get approximate
Instead, for the sake of illustration of the remaining cases mentioned in the penalty
scenarios, we assume the servers to have exponentially distributed service time with a mean
of µ. So the network is now viewed as a M/M/1/∞ queueing model.
4.5
Illustration using M/M/1
In a M/M/1/∞ queueing system, the expected response time is µ−1λ and the probability of the response time exceeding a time period T is given by e−(µ−λ)T. From
Jackson’s theorem and Kleinrock’s independence approximation, a system of tandem queues
can be effectively decomposed into an independent set of M/M/1 queues. So the total time
spent in the network can be approximated as the sum of time spent at each server in the
network [23].
We assume that all sessions to be established are between IMS compatible
termi-nals. So in our modeling the total number of servers in the network and the number of
servers involved in the call setup are the same. For modeling sessions between non IMS
end-points, the number of servers involved in the computation of the average response delay
can be considered as a subset of the total number of servers present in the network.
Another assumption is that the servers in the network are independent and
iden-tically distributed (i.i.d.) that is each server has the same probability distribution and are
mutually independent. An Erlang distribution can be used to model the penalty function
for the end-to-end (tandem) tail probability.
Thus, the total average response time experienced in K tandem servers in the network is µK−λ. The time period T is assumed to be a fragment of the total threshold time limitτ. So, the probability of the session setup overK i.i.d. servers being completed within threshold time limitτ while exceeding a time periodT in each server is K∗e−(µ−λ)T.
Based on the above assumptions, the following sections describe the optimization
of the utility functions for the scenarios previously defined using a M/M/1/∞ queueing
network.
4.5.1 Utility Function with total time for session setup
ˆ
U =maxµ
V −K(aµ−bµ2)−β
τ − K
µ−λ
whereβis the proportionality constant andτ is the total time limit for session establishment. The first order derivative condition to find the maximumµ is
∂U
∂µ =−aK+ 2bKµ− Kβ
(µ−λ)2 = 0 (4.7)
We deduce some properties of the solution by applying the conjugate pair theorem.
1. If the costaincreases, the service rateµ decreases.
Uµa =−K → ∂U∗
∂a <0
2. If the costb increases, the service rateµincreases.
Uµb = 2Kµ→ ∂U ∗
∂b >0
3. If penalty for losing requests β increases, the service rate µdecreases.
Uµβ =− K
(µ−λ)2 →
∂U∗ ∂β <0 Uµβ is positive asµ > λand K >0.
4. If the arrival rate λincreases, the service rateµincreases.
Uµλ=−
2Kβ
(µ−λ)3 →
∂U∗ ∂λ >0
We know that equation (4.7) is zero for the optimal µ. If −K(a−2bµ) < 0 in equation (4.7) then [−K∗ (µ−βλ)2]> 0. From this we know that Uµλ > 0 as Uµλ =
[−K∗(µ−βλ)2]∗[ 2
µ−λ].
The above trends become intuitive if the constraint τ ≥ (µK−λ) is simplified to
µ≥λ+ Kτ. We also notice that as the number of servers in the network K increases, the service rateµwill increase.
As a closed form for optimum ˆU is difficult, we use
τ
≥ K(µ−λ) as a hard constraint on U = V(λ)−C and obtain optimum utility when µ∗ = Kτ +λ provided (λ+ Kτ) < 2ab
as in Figure 4.2. We use β = 0.01, the number of servers K = 5, τ = 30 sec, the income
100 150 200 250 300 350 400 450 500 0
500 1000 1500 2000 2500 3000 3500 4000
mu = lamda to a/2b
utility
Figure 4.2: Utility vs. Service rate for M/M/1/∞ model, with constraintτ ≥ K
(µ−λ) where K=5 and τ=30
4.5.2 Utility Function with probability of session setup
For the second case, the optimal utility function is given as
ˆ
U =maxµV −K(aµ−bµ2)−β(−K∗e−(µ−λ)T) (4.8) Here again β is the proportionality constant, is the probability of completing the session setup within threshold time limit τ.
The first order derivative to compute the maximum µis
∂U
∂µ =−aK+ 2bKµ−KT β∗e
−(µ−λ)T = 0
We perform the following analysis of the solution based on the conjugate pair theorem:
1. As the costaincreases, the service rateµ decreases.
Uµa =−K → ∂U∗
∂a <0
2. As the costbincreases, the service rate µincreases.
Uµb = 2Kµ→ ∂U∗
100 150 200 250 300 350 400 450 500 0
500 1000 1500 2000 2500 3000 3500 4000
mu = lamda to a/2b
utility
Figure 4.3: Utility vs. Service rate for M/M/1/∞model, with constraintK∗e−(µ−λ)T ≤
where K=5 and=0.00005
3. As the penalty for losing requests β increases, the service rate µdecreases.
Uµβ =−KT∗e−(µ−λ)T → ∂U∗
∂β <0
4. As the arrival rateλincreases, the service rate µincreases.
Uµλ=−KT2β∗e−(µ−λ)T → ∂U ∗
∂λ >0
The first order derivative of ˆU is−aK+ 2bKµ−KT β∗e−(µ−λ)T = 0 for optimal µ
from equation (4.8). Now if −K(a−2bµ) <0, then [−KT β∗e−(µ−λ)T]> 0. That implies [−KT β∗e−(µ−λ)T]∗T >0.
The constraint K∗e−(µ−λ)T ≤ can be simplified to µ ≥λ+ lnTK − ln
T . Upon
usingK∗e−(µ−λ)T ≤as a hard constraint onU =V(λ)−C, we obtainµ∗ =λ+lnTK−ln T
[Figure 4.3] provided λ+lnTK −ln T
< 2ab. From the above solution, we note that as K
increases, the service rateµwill increase and as T increases,µ will decrease.
We use a = 4, b = 0.0043, β = 0.01, = 0.00005, the number of servers K = 5,
4.5.3 Utility Function with lost connections
In this last scenario, we have no constraints on the queueing system. A penalty of
cis incurred for each session setup that exceeds the threshold time limitτ. The probability of the connection setup time experienced in each server exceeding the time periodT forK
servers is given byK∗e−(µ−λ)T. Using Little’s law, we have the number of lost connections asλ∗(Ke−(µ−λ)T).
The optimal utility function is
ˆ
U =maxµ h
V −K(aµ−bµ2)−cλ∗Ke−(µ−λ)Ti (4.9)
Here cis the penalty for each lost connection.
The first order derivative for the maximum service rate µ is
∂U
∂µ =−aK+ 2bKµ+KT βλ∗e
−(µ−λ)T = 0
We infer the following properties of the solution based on the conjugate pair theorem:
1. If the costaincreases, the service rateµ decreases.
Uµa =−K → ∂U ∗
∂a <0
2. If the costb increases, the service rateµincreases.
Uµb = 2Kµ→ ∂U∗
∂b >0
3. If penalty for losing requests cincreases, the service rateµ increases.
Uµβ=KT λ∗e−(µ−λ)T → ∂U∗
∂β >0
4. If the arrival rate λincreases, the service rateµincreases.
Uµλ=KT β∗e−(µ−λ)T +KT2βλ∗e−(µ−λ)T → ∂U∗
∂λ >0
We observe that the trends in the network performance remain similar across
for optimal utilization of the network is heavily influenced by the arrival rateλ, the number of servers in the networkK and the total time for the session establishment τ.
Using the above discussed methods, we can analyze and predict trends in different
networks for different constraints and penalties. In the later sections, we present a
method-ology to characterize the workload of the servers in real networks to determine, even if
approximately, the actual service distributions. This derived workload is used to simulate
the end-to-end service to understand the dependence of utility function on the network
Chapter 5
Characterization of SIP Workload
Capacity planning and performance modeling are essential to understand the
com-plex integration of data and communication services. Questions like how will the service
work, what are the bounds and cost of the service, how well will the service work are
impor-tant in planning. Workload characterization of the servers provides information about the
network performance. It tells us how the network will function, how the demand for services
will be satisfied, how robust and stable the network will be, how fast will the connections
be setup etc. Service providers must know the nature of the network and what services the
network can offer to deploy service level agreements (SLAs). Thus, it is important to have
a realistic estimate of the workload as it heavily influences the capabilities of the network.
We propose an innovative methodology to obtain an approximate workload of the
servers. This study has been motivated by the lack of realistic workload characterization
in the literature. Most often, servers are assumed to have constant service times. Such
assumptions affect the capacity planning negatively. We performed case-studies of collecting
real network measurements in order to determine, even if approximately, the actual service
distributions of the servers. This derived workload is used in our simulations to model
end-to-end service and identify the dependence of utility with network parameters. This is
discussed in Chapter 6.
IMS network depends on the SIP server for the network throughput. SIP is an
application-layer protocol. So a better implementation of SIP server with higher processor
capabilities. This will enhance the performance of the network significantly. Our focus is
on the methodology rather than the actual numbers collected, as the numbers can change
with different implementations over time and across different providers.
5.1
Proposed Characterization Methodology
In our methodology, we monitored real traffic to derive the workload
characteris-tics of the server. Based on the observed traffic, we formulated an approximate service time
distribution which provided insights into the network capabilites. We conducted
experi-ments using different SIP clients and used Ethereal to monitor the SIP signaling messages.
The approximate response times were deduced from the observed traffic and used to derive
the workload.
Today most of the instant messengers like Yahoo, Gizmo, MSN use SIP signaling
to provide voice chat. Skype uses SIP to connect to the gateway service for their SkypeIn
and SkypeOut service. We performed our study on Yahoo’s Voice chat messenger and
Sipphone’s Gizmo messenger. The study captures the differences between a multi-server
and single server network. In what follows, we discuss the details of the methodology and
provide inferences from the derived service distribution. We analyze SIP packet contents
to obtain information about the session capabilities.
5.2
SIP Packet Flow
Figure 5.1 represents an INVITE request initiated by Yahoo messenger to establish
a SIP voice chat. We notice from the traces that Yahoo messenger uses SIP signaling over
TCP.
The capabilities of the connection can be obtained from analyzing the SIP and SDP
packets. An unauthorized INVITE request receives a 401 Unauthorized response as shown
in Figure 5.2. The 401 Unauthorized response includes a challenge in theWWW-Authenticate
header field that the sender must answer.
In Yahoo, an SDP packet describing the session is sent only after the sender has
been authorized. An authorized INVITE request is given in Figure 5.3. The lines with