NUTRIENT PROCESSING AND WATER QUALITY IN A PIEDMONT BOTTOMLAND RECEIVING URBAN WASTEWATER
Edward J. Kuenzler
Professor of Environmental Biology Alice B. Carberry
Research Assistant hic chin Tzeng Research Assistant
Department of Environmental Sciences and Engineering University of North Carolina at Chapel Hill
CB #7400 Chapel Hill, NC 27599
The research on which this report is based was financed in part by the Department of the Interior, U.S. Geological Survey,
through the North Carolina Water Resources Research Institute. The contents of this publication do not necessarily reflect the views and policies of the Department of the Interior, nor does mention of trade names or commercial products constitute their endorsement by the United States Government.
Agreement No. 14-08-0001-GI580 WRRI Project No. 70083
USGS Project No. 03
ACKNOWLEDGEMENTS
We are pleased to acknowledge the generous assistance of Henry Boswell with the surveying, vegetation analysis, and other field work. David Carberry, Michael Cross, Kenneth Draper, Gregory Eiband, and Kathryn Rowland helped with field sampling and laboratory analyses. Stephen Shoaf and Marilyn Maerker always contributed good advice and generous help with laboratory
analyses. Joe Pedit helped with the soil sorption methods and interpretation. Charles Barnes provided unpublished New Hope Creek discharge data collected by the U.S. ~eological Survey. Jay Sauber, Jim Fisher, and other staff members of the N.C. ~ivision of Environmental Management were always helpful and encouraging. William Telford kindly provided effluent discharge data for the Farrington Road Wastewater Treatment Plant and
ABSTRACT
Nutrient concentrations above and below a municipal wastewater outfall on a Piedmont stream were analyzed to assess the
effectiveness of its bottomland forest system in removing nutrients from the water. The wastewater significantly
increased the conductivity and raised the chloride and nutrient concentrations. Dilution by stream water decreased the
concentrations of most constituents added by sewage but,
contrary to results in the Coastal Plain, only for phosphate was there a significant amount of net removal. The drought
conditions during the study were probably important because natural inundation of the floodplain occurred only rarely and briefly, markedly decreasing the opportunity for nutrient
trapping. Even winter flooding of a greentree impoundment about 3 km below the outfall did not provide significant nutrient
removals. Other factors which
may
have been important were the prior heavy loadings of nutrients to the system and the shortage of organic carbon loadings relative to the needs fordenitrification. Because of the unusual rainfall and runoff conditions, general conclusions about nutrient retention cannot be made.
A parallel study was conducted of organic matter, phosphorus content, and sorption capacity of the floodplain soils. The mineral soil was mostly 6 4 1 % organic matter. Soil phosphorus content and sorption capacity were affected by winter flooding of the greentree impoundment. There was a significant increase in soil sorptive capacity along both transects that were
flooded, whereas the transect that was not flooded showed no change in sorptive capacity. Sorptive capacity along Transect A was significantly related to oxalate extractable iron and
inorganic phosphorus content. Further studies are planned to determine the effects of natural flooding.
TABLE OF CONTENTS
PAGE
ACKNOWLEDGEMENTS ABSTRACT
LIST OF FIGURES LIST OF TABLES
SUMMARY, CONCLUSIONS, AND RECOMNENDATIONS
I. INTRODUCTION GENERAL
W E T W D S AS NUTRIENT TRAPS
WETLANDS AND SURFACE WATER QUALITY
PIEDMONT WETLAND FORESTS NITROGEN PROCESSING
PHOSPHORUS PROCESSING
Phosphorus cycling
Abiotic phosphorus retention Phosphorus sorption theory Biotic phosphorus retention
OBJECTIVES AND SCOPE THE STUDY AREA
11. METHODS HYDROLOGY
WATER QUALITY
Calculation of nutrient loading rates ~ a l c u l a t i o n of nutrient removal
Estimation of sewage nutrient change
Estimation of flux coefficient
SOIL SAMPLING
SOIL ANALYSES
DATA ANALYSIS
ii iii
vi
111, RESULTS 24 STREAM HYDROLOGY AND TEMPERATURE 24 CONDUCTIVITY, CHLORIDE, pH, AND DISSOLVED OXYGEN 27
NUTRIENT CONCENTRATIONS 31
NUTRIENT LOADING 35
SOIL PHOSPHORUS AND ORGANIC MATTER 37
PHOSPHORUS SORPTION KINETICS 4 1
IV. DISCUSSION 43
STREAM HYDROLOGY 43
CHLORIDE CONCENTRATIONS AND CONDUCTIVITY IN
RELATION TO NUTRIENT DISTRIBUTIONS 45 NET NUTRIENT CHANGES BELOW THE OUTFALL 52
SOIL SORPTION CAPACITY 58
V. APPENDICES 6 1
APPENDIX Ao DESCRIPTION OF WATER QUALITY
SAMPLING STATIONS 61
APPENDIX Bo ELEVATZONAL CROSS-SECTIONS OF THE
FLOODPLAIN 63
APPENDIX C. WATER QUALITY DATA 66
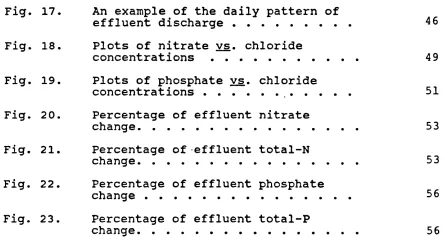
LIST OF FIGURES
FIGURE PAGE
13
Fig. 1. Fig. 2.
. .
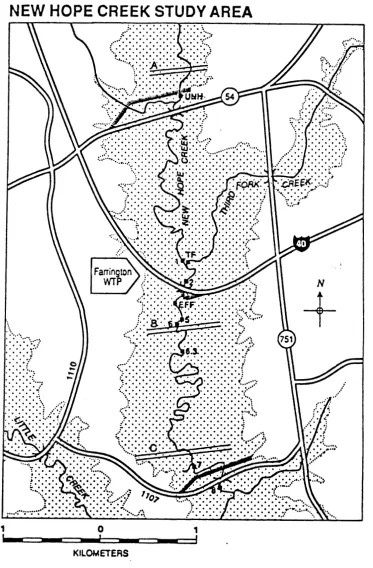
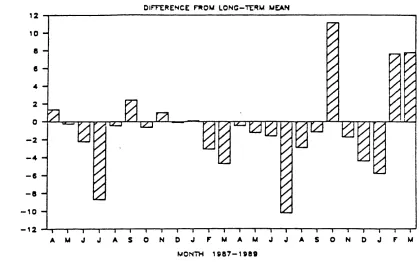
Map of New Hope Creek study area.Difference between monthly
precipitation during the study period and precipitation during 1887-1983.
.
Fig. 3. Mean monthly discharge of New HopeCreek during 1987-89 compared to the
. . .
four-year mean.Fig. 4 . Daily discharge of New Hope Creek at Station NH8 compared to daily
wastewater discharge.
. . .
Fig. 5. Water temperature at time ofsampling.
. . .
Fig. 6. Conductivity of effluent and New Hope. . .
Creek water.Fig. 7 . Chloride concentrations of effluent
. . .
and New Hope Creek water.Fig. 8. Relationship between chloride
. . .
concentration and conductivity.Fig. 9.
Fig. 10.
. . .
Dissolved oxygen concentrationsDistributions of four fractions of total nitrogen
. . .
Fig. 11. Distributions of three fractions of
total phosphorus
. . .
Fig. 12. Seasonal variations in nitrateconcentration
. . .
Fig. 13. Seasonal variations in phosphateconcentration
. . .
Fig. 14. Seasonal variation in loading ratesof nitrogen and phosphorus species.
.
Fig. 15. Soil sorption isotherms at selectedF i g . 1 7 . An example o f t h e d a i l y p a t t e r n of
. . .
e f f l u e n t d i s c h a r g e
F i g . 1 8 . P l o t s of n i t r a t e
E.
c h l o r i d ec o n c e n t r a t i o n s
. . .
F i g . 1 9 . P l o t s o f phosphatem.
c h l o r i d ec o n c e n t r a t i o n s
. . .
F i g . 2 0 . P e r c e n t a g e of e f f l u e n t n i t r a t e
. . .
change.F i g . 2 1 . P e r c e n t a g e o f - e f f l u e n t t o t a l - N
change
. . .
F i g . 2 2 . P e r c e n t a g e o f e f f l u e n t phosphate
c h a n g e . .
. . .
F i g . 2 3 . P e r c e n t a g e o f e f f l u e n t t o t a l - Pchange
. . .
LIST OF TABLES
Table Pase
Table 1. Area of some Piedmont bottomland
...
forest typesTable 2. Quality control assessment for accuracy and sensitivity
...
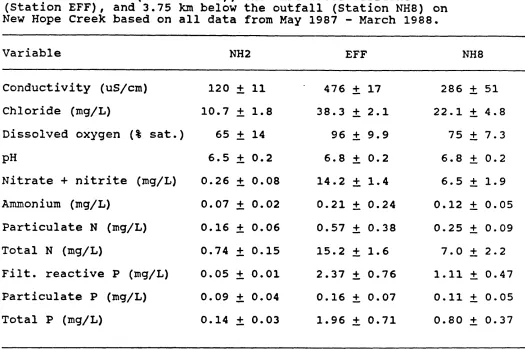
Table 3. Water quality characteristics..
Table 4 . concentrations of acid extractableinorganic phosphorus and total phosphorus in soil...
Table 5 . Significance of differences in soil
characteristics... 39 Table 6. Loss on ignition of litter and
mineral soil
.m...
Table 7 . sorption of phosphate, calculatedfrom the Freundlich equation at two
equilibrium concentrations
....
42 Table 8. Flux coefficients for nitrogen andphosphorus species
...
SUMMARY, CONCLUSIONS, AND RECONMENDATIONS
R his study aimed to provide original data on the efficiency with which Piedmont forested wetlands remove nutrients from municipal wastewaters. There have been no prior studies of this question
in the Southeastern Piedmont which compare with recent studies of nutrient removals in Coastal Plain wetlands. The Piedmont of North Carolina is generally characterized by more topographic relief, faster flowing streams, more clay in the soils, and more urbanization than the Coastal Plain. Although wetlands comprise a much smaller fraction of total land surface in the Piedmont than in the Coastal Plain, the areas of bottomland forest are significant.
New Hope Creek in Durham and Chatham Counties, North ~arolina, meanders through a wide, gently-sloping, low-relief floodplain. Municipal wastewater from the Farrington Road Wastewater
Treatment Plant (~arrington WTP), city of Durham, is discharged near the center of the study tract. New Hope Creek water above the outfall is turbid with suspended sediments, especially
during high flows, but is relatively low in conductivity and
in
chloride, nitrate, and phosphate concentrations. We examined certain water quality characteristics at stations above, at, and for 3.75 km below the wastewater outfall to establish the
amounts of change attributable to net nutrient removal. The study also included intensive study of floodplain soil
characteristics, especially sorption capacity for phosphate before and after three months of inundation of the greentree waterfowl reservoir.
~onclusions derived from this study are limited because it
coincided with a drought period. The low precipitation resulted in less-than-average stream flows and
in
only localized orshort-term inundation of the floodplain. The wastewater treatment plant effluent exceeded 25% of total stream flow
during fifteen months and exceeded 50% during nine months of the two-year study. Wastewater was therefore
a
major componentof
supplier of nutrients. There was satisfactory agreement between two methods for calculating the volume of streamflow contributed by wastewater, lending support for the assumption that chloride
is a conservative element in New Hope Creek water. The wastewater effluent was about four times higher in
conductivity and in chloride concentration than the dilution water from upstream. Dissolved oxygen concentrations were always above 25% of saturation; they averaged 96% in the effluent and more than 75% of saturation in water at most downstream stations. Chloride was considered a conservative element and its decreases downstream were attributed to
dilution. The amount of dilution was then applied to major forms of nitrogen and phosphorus in order to discriminate net nutrient removal from simple dilution.
The major forms of nitrogen and phosphorus in New Hope Creek water above the outfall were organic N (dissolved plus
particulate) and particulate P. The concentrations of nutrients were low in stream water above the outfall. Upstream at Station NH2, total N averaged 0.74 and total P averaged 0.14 mg/L. The total N concentrations in the effluent were more than an order of magnitude higher, 15.2 and 2.0 mg/L, respectively. The major forms of nitrogen and phosphorus in the effluent were nitrate and phosphate (abbreviated NOx and FRP, respectively); their concentrations were 14.2 and 2.4 mg/L, respectively. (Mean FRP exceeded
mean
TP concentration because TP analyses did not begin until after a period of high wastewater nutrient concentrations in May-October 1987). The concentrations of nutrients in New Hope Creek decreased below the outfall because of simpledilution, but net removals of nutrients from the stream water were not detectable except for a small but significant rate of phosphate removal. Alum treatment of the wastewater, especially during the last six months of the study, decreased the FRP
ÿ his study was conducted during a drought period when the stream almost never flooded naturally; consequently, there was almost no opportunity for nutrient processing by the extensive
floodplain soils. The forested wetlands of our Coastal Plain, on the other hand, tend to be flooded for a major part of the winter and early spring, providing excellent contact between stream water and floodplain and high efficiencies of wastewater nutrient removal. Furthermore, Coastal Plain streams, unless channelized, have relatively low grades, low water velocities and ample time for nutrient processing to occur in shallow
stream channels and in shallow floodwaters. Finally, the soils of Coastal Plain swamps are often relatively rich in organic matter, creating anoxic conditions where denitrification can occur
~lterations in the wet/dry cycles in bottomland hardwood systems have a direct effect on phosphorus processing by their soils. Two of the paired transects ( A and C) across the New Hope Creek floodplain were flooded during greentree management, whereas one
(B) was not flooded. Core samples taken along the three transects at low, medium, and high elevations were separated into litter, 0-10 cm, and 10-20 cm layers. Pre- vs. post- impoundment sorption characteristics of the 0-10 and 10-20 cm soil layers were compared using the Freundlich model. Sorption along transects which had been flooded increased significantly
in
both the 0-10 cm layer and 10-20 cm layer (pc005 Wilcoxon Rank Sums). Sorption along t h e unimpacted t r a n s e c t showed nosignificant change. Soil inorganic P concentration (Pi) was
significantly greater in the 0-10 cm layer than the 10-20 cm layer along Transects B and C but not Transect A.
The present study did not demonstrate a strong capability for Piedmont bottomlands to remove nutrients from wastewater. Perhaps the brevity of flooding events during these
dry
years was a major factor reducing the amount of nutrient removal. Presumably nutrients from wastewaters are trapped moreefficiently in normal and wet years when the floodplain
is
area of stream-channel sediment available for nutrient processing is far less than the area of floodplain soil contacted by floodwaters. Furthermore, most North Carolina Piedmont streams have much smaller floodplains, relative to the stream size, than most Coastal Plain streams. The higher grades of Piedmont streams result in higher water velocities and
therefore shorter times-of-travel, again decreasing the time available for nutrient processing by either the stream bottom or the floodplain. Poor nitrate removal may be attributed to high concentrations of dissolved oxygen in the effluent and the
stream water and to insufficient organic matter from leaf litter in the stream channel. Finally, the city of Durham has been discharging waste waters to tributaries of New Hope Creek for decades, probably resulting in high concentrations of sediment and soil phosphorus. In this condition, we might expect not only little further phosphorus removal from the water, but also desorption and regeneration of phosphate and its return to the stream if concentrations in the water decrease, In the case of New Hope Creek, such phosphate will ultimately flow into B. Everett Jordan Lake.
We are unable to come to general, definitive conclusions
regarding the potentials for Piedmont wetlands as natural traps for municipal wastewater nutrients because the study took place during drought years. Clearly, when a major fraction of stream flow consists of wastewater, when the discharge has persisted for decades, and when the stream is c o n f i n e d within i t s banks,
there is little potential for water quality improvement. We can speculate that nutrients would be trapped more effectively
during normal or wet years than during dry years because of greater opportunity for nutrient processing by the floodplain. Finally, there is the suggestion in our results that phosphorus trapped in stream sediments is being returned to the water
during periods when alum additions at the wastewater treatment plant had markedly reduced the phosphate concentrations in the effluent ,
The following recommendations may be made:
1. continuing efforts are necessary to reduce the nitrogen and phosphorus loadings from the wastewater treatment plant.
Loadings can be reduced only if the product of concentration times effluent volume is reduced; a slight decrease in
concentration coupled with a large increase in volume will not reduce the ultimate loading to B. Everett Jordan Lake and thus will not ,slow or reverse the rate of eutrophication of this important body of water.
2. Further studies are needed:
( A ) A similar study of water quality changes below the outfall during normal and wet years should be conducted to assess the impact of floodplain soil processing. The study should
determine particularly the amounts of accumulated nutrients in the greentree reservoir that are transported down to Jordan Lake when the reservoir drains.
(B) There seems to be considerable potential below the
Farrington WTP to perform small scale %esocosml~ experiments wherein relatively small volumes of wastewater are pumped for short periods (weeks) with varying dilutions of streamwater onto designated small tracts of floodplain. Such studies would
provide tightly controlled experiments without damage to the existing bottomland system. .. . .
(C) It is important to gain further information regarding the effectiveness of the greentree subimpoundments as treatment lagoons. Presumably these subimpoundments will be operated for many years. Their functioning will continue to be of interest, particularly the flushing of temporarily retained nutrients into Jordan
Lake
when the floodgates are opened.(D)
More studies are neededto
determine the rate of sorptive capacity changes both as a function of phosphate loading and ofchemical changes, especially to the iron and aluminum species, as a result of flooding and redox changes.
INTRODUCTION
GENERAL
North ~arolina is in the Humid Temperate Subtropical Province (Bailey 1976). A moderate amount of precipitation falls in most months, the land is dissected by many flowing streams, and
groundwater is available for withdrawal. Natural Piedmont streams tend to be more turbid than those of the Coastal Plain because of the abundance of clay in the soils, the steepness of the slopes, and other factors (Simmons 1988). Water quality is, however, generally satisfactory for many purposes except where degraded by municipal and industrial wastewaters, cropland runoff, livestock wastes, or construction activities. Wetland systems, especially forested bottomlands and swamps, are a natural feature of our Coastal Plain, and to a lesser extent Piedmont, streams. They are situated where they can trap
suspended sediments and nutrients coming from uplands and urban areas (Kuenzler 1989b). Although rainstorms sometimes cause flooding in other seasons, these wetlands usually are flooded in late winter and early spring.
WETLLNDS AS NUTRIENT TRAPS
Wetland systems often function as secondary or tertiary wastewater treatment sites. Many municipalities in the
Southeast, including North Carolina, discharge their effluents to streams bordered by forested wetlands, especially in the Coastal Plain. Such discharges have been occurring for decades
(Environmental Protection Agency 1983), but little
is
knownabout relationships between wastewater loadings and the wetlands which receive them. The floodplains of Southeastern forested wetlands provide large areas of soil for nutrient removal and thus function as sinks for both non-point and point sources of pollution (Kuenzler 1989a). Nitrogen and phosphorus are quickly removed when low flows of municipal wastewaters are discharged
especially nutrient loading rate, duration of loading, type of soils, and contact with soils (Nichols 1983; Richardson 1985; Kadlec 1985).
Prior research on nutrient cycling and water quality of North ~ a r o l i n a swamps (Brinson 1977; Kuenzler et al. 1977, 1979:
Mulholland and Kuenzler 1979; Brinson
&
a.
1980, 1981a; Yarbro et al. 1981; Qualls 1984) has not included Piedmont systems.- -
Freshwater marshes and swamps elsewhere, however, remove large amounts of N and P (Hartland-Row and Wright 1975; Sloey et al. 1978; van der Valk et al. 1978; Nichols 1983; Chescheir &
a.
1987). The quantity of nutrient removed by a wetland divided bythe nutrient input during some period has been termed the
nutrient removal efficiency. Nichols (1983) showed that both N and P removal efficiencies tended t o decrease as the loading
2
rate ( g / m ) increased. Efficiencies of P removal also tended to decrease over a period of years, suggesting upper limits t o
phosphorus retention (Nichols 1983; Richardson and Marshall 1986; Kadlec 1987). Two swamps in Florida, however, still
removed most of the N and P from sewage effluent after 20 to 40 years (Boyt et al. 1977; Ewel and Bayley 1978). Intensive
studies of wastewater loadings to Florida cypress domes showed that these relatively closed systems substantially reduced nutrient and bacteria concentrations (Ewel and Odum 1978; Ewel and Deghi 1978). Nutrient concentration changes, corrected for
dilution, in swamp water above and below two municipal outfalls in Coastal Plain North Carolina showed that these wetlands
removed most of the wastewater N and P (Kuenzler 1987).
Richardson and Nichols (1985) reviewed the literature concerning wastewater and wetland retention capacity for northern wetland systems and Kuenzler (1989a) reviewed the literature for the Southeast.
WETLANDS AND SURFACE WATER QUALITY
floodplains is unavailable for deposition and remobilization in lakes located downstream. Soluble forms of P are also retained by plants, microbes, and soils of wetland systems (Yarbro 1979). Phosphorus is often the limiting nutrient for aquatic primary productivity (Dillon and Rigler 1974; Schindler 1974; Wetzel 1975; Medine and Anderson 1983) and is therefore linked to lake eutrophication and ncxious algal blooms (Medine and Anderson 1983). In B. Everett Jordan Lake, N.C., however, nutrient limitation appears to shift between N and P both spatially and temporarily (Kuenzler et al. 1986). Nutrients removed by
wetlands are unavailable to support eutrophication of downstream lakes, reservoirs, and estuaries.
New Hope Creek is a major tributary to Jordan Lake, a reservoir constructed for flood control but with potential for other uses if eutrophication is controlled. This stream receives municipal wastewater from Durham, North Carolina and, after passing
through a bottomland wetland system, delivers a heavy nutrient load to the lake. Three greentree reservoirs, flooded in winter for waterfowl management, were constructed by the Army Corps of Engineers to flood portions of the New Hope Creek bottomland. PIEDMONT WETLAND FORESTS
There are more than 2.4 million hectares of commercial forest land
in
the Piedmont of North Carolina. Of this, the two wetland forest types, oak-gum-cypress and elm-ash-cottonwood, cover 69,000 and 99,400 acres, respectively, constituting 6.95% of total commercial forest area (TCFA) (Welch 1975). Thepercentages of wetland forest are substantially larger in
counties of the Triassic Basin where this research was conducted (Table 1).
Most Piedmont streams have bordering bottomland or river gallery forest, but there have been virtually
no
studies ofTable 1. Area of bottomland forest types in six Piedmont counties with Triassic Basin streams (Welch 1975). TCFA is Total Commercial Forested Area
County Oak-gum-cypress Elm-ash-cottonwood Percent of
(hectares) (hectares) TCFA
Chatham 4,200 16,540 15.6
Durham 2,130 6,380 18.5
Granville 15,700 17.8
Orange 6,100 10.0
Person 4,010 2,000 9.2
will generally be called bottomlands in this report. The trees include such flood-tolerant and moderately flood-tolerant
species as swamp chestnut oak, overcup oak, willow oak,
sweetgum, hickory species, elm species, ash species, ironwood, and red maple (Moore and Wood 1976; McKnight &
a.
1981). The forest is moderately productive of timber and game and ispresently managed by the N.C. Wildlife ~esources Commission. The New Hope Creek bottomland constitutes the lower end of an urban watershed draining into Jordan Lake. Moderately severe eutrophication problems occur in the New Hope River arm of this lake (Kuenzler et al. 1986; w e b s and Francisco 1988),
suggesting the need to understand nutrient removal in the bottomland forest. The importance of Piedmont bottomlands to water quality is not understood. They are less extensive and are flooded for shorter periods than Coastal Plain wetlands, reducing the opportunity for nutrient removal. The areas of wetland forest in the Triassic Basin are relatively large and their importance in nutrient removal is probably greater than for the rest of the Piedmont where stream valleys are steeper and bottomlands are narrower or absent. However, relatively small areas of natural bottomland forest may provide significant removals of both suspended sediments and of nutrients.
NITROGEN PROCESSING
Periodically-flooded bottomland hardwood forests play an
important role in the erosion/deposition balance of wetlands and affect many aspects of the system's abiotic and biotic
character. Variations in the timing and period of stream
inundation can affect the entire community including changes in microbial activity, plant vitality, and system nutrient
cation and anion exchange reactions, and 6) change in the sorption and desorption of ions (Ponnamperuma 1972; Sah and Mikkelsen 1986~).
~ n o r g a n i c nitrogen is much more concentrated in municipal sewage than in natural waters. Microbial denitrification is important in systems receiving municipal wastewaters since it represents a pathway for permanent removal of nitrogen. This process has been studied in flooded and drained soils (Engler and Patrick
1974; Mulvaney and Kurtz 1984). Many factors affect
denitrification, but the most important is the presence of zones of low redox potential created by excessive organic matter in
the soil. Denitrification occurs when nitrate in the soil or overlying water diffuses into anoxic zones. Ammonium may
diffuse into an aerobic zone and become oxidized t o nitrate. The diffusion of ammonium and nitrate is dependent upon the
thickness and duration of these zones, which in turn are
affected by hydroperiod, dissolved oxygen in overlying water, biological activity, and soil drainage (Reddy et al. 1976; Reddy and Patrick 1984; Myrold and Tiedje 1985). Rates and controls of denitrification in Piedmont wetlands probably differ from those of Coastal Plain systems (Reddy et ale 1976; Gilliarn and Gambrel1 1978; Dierberg and Brezonik 1985; Gilliam and Jacobs 1983; Smith &
fl.
1983). Flooding of the waterfowlsubimpoundments may result in accumulation of organic nitrogen
(Keeney 1972; Richardson and Nichols 1985); subsequent draining will permit mineralization, leaching, and chemical
transformations (Sloey &
fie
1978; Brinson et a l e 1981a).PHOSPHORUS PROCESSING
p h o s ~ h o r u s cvclinq. Phosphorus cycling in wetlands involves numerous chemical forms and processes which are directly
Richardson and Marshall 1986). In Walker Branch, Tennessee, 91% of total exchangeable P removal was due to microbial uptake
(Elwood et al. 1981). In a Michigan fen being enriched with 5 . 5
kg P ha-lyrW1 litter microorganisms retained up to 84% and 67.5%
of the increment the first and second years, respectively. Once the capacity of the microbial pool was reached, abiotic sorption dominated phosphorus retention (Richardson and Marshall 1986).
biotic
~hosphorus retention. The electrochemicaltransformations that occur with the flooding of soil are
reversed when soil is drained. Alternate flooding and draining of soils thus affects the stability of minerals in the soil. The higher dissolved C 0 2 concentration in flooded soil solution reduces the pH, thereby increasing the solubility of calcium phosphate minerals (Sah and Mikkelsen 1986a). The solid phase
iron forms also shift during reduced conditions, causing Fe(II1) activity to decrease and P-activity to increase (Sah and
Mikkelsen 1986a). Upon reoxidation, many investigators have reported an increase in amorphous ferric and aluminum hydroxides
(oxalate extractable iron and aluminum) with a corresponding decrease in crystalline iron and aluminum minerals.
The high specific area of these amorphous forms increases soil phosphorus sorption capacity (Khalid et al. 1977; Kuo and
Mikkelsen 1979; Richardson 1985; Sah and Mikkelsen 1986~). In slightly acid to neutral soils, the sorption activity of
amorphous iron oxides and aluminum hydroxides is greater than that of crystalline Fe(II1) and A1 (111) forms (Hsu 1964).
Phosphorus adsorption on ferric hydroxide occurs as a specific sorption reaction where the surface of the iron oxide is
-
protonated by protons occurring in solution or by the H2P04 ion itself. It has been suggested that soil P-retention capacity may be estimated from the amount of oxalate-extractable aluminumin the soil (Richardson 1985; Richardson and Marshall 1986; Richardson
&
a.
1988). Prior floodingof
soil decreasedP
concentrations in soil solution; soluble
P
addedto
Sah and Mikkelsen ( 1 9 8 6 ~ ) found that prior flooding increased phosphorus sorption significantly at all three temperatures tested. Prevention of drying cycles may decrease nutrient retention in soil (Richardson and Nichols 1985). With increased time after drainage, the amorphous minerals form more
crystalline forms which have less surface area and therefore are less reactive t o phosphorus.
P h o s ~ h o r u s Sorption Theorv. Sorption theory has been
successfully applied to solute/solid systems (Olsen and Watanabe
1957). Sorption models provide a condensed method to define the
relationship between sorbed and equilibrium P concentrations so that different soils may be compared (Syers &
a.
1973; Barrow 1978). The Freundlich and Langmuir models and their various permutations are most commonly used to describe P sorption. The Freundlich equation is an empirical model which defines aparabola.
where K and n are constants, Q is the mass adsorbed, and C is eq the equilibrium concentration (Barrow 1978).
Although the Freundlich model is empirical, it conforms t o the theory that P adsorption affinity decreases as adsorption
increases. This decreased affinity of the solid surface with increased sorption is consistent with the effects of specific adsorption of anions on an adsorbing surface (Barrow 1978). The Freundlich model has the disadvantage of being unable to predict an adsorption maximum (Olsen and Watanabe 1957).
The ~ a n g m u i r equation is a theoretical model based on the
assumption that adsorption is a dynamic process which relies on four assumptions: 1) adsorption occurs as a monolayer; 2) rate of desorption is equal to the rate of adsorption at equilibrium;
site; and 4) adsorption affinity remains constant (Olsen and Watanabe 1957; Gunary 1970; Barrow 1978).
The ~ a n g m u i r equation may be used in two forms:
where Q is the mass adsorbed, C, is the equilibrium phosphorus concentration, b is an affinity term, and Qo is the adsorption maximum (Barrow 1978). The major advantage of the Langmuir
model is that the adsorption maximum, surface area, and affinity of the substrate for P can be calculated (Olsen and Watanabe 1957; Bache and Williams 1971; Syers & 1973; Sah and Mikkelsen 1986c; Sah and Mikkelsen 1986d). The Langmuir
equation may be accurate only over a limited concentration range and the calculated adsorption maximum may be experimentally
exceeded at high P concentrations (Olsen and Watanabe 1957; Barrow 1978). Thus, the calculated Langmuir adsorption maximum may not be correct for natural systems because the P
concentrations required t o reach the predicted maximum far exceed natural levels.
Phosphorus sorption typically occurs in two phases, an initial fast reaction lasting for the first few hours, then a slower sorption reaction (Ibrahim and P r a t t 1982). There are several possible explanations for this phenomenon. Some researchers believe that the two reactions represent a combination of adsorption and precipitation reactions. Phosphorus
~ a n g m u i r equation t o obtain a better fit t o his data. Inclusion of this term, however, suggests that, as with the Freundlich model, the soil's adsorption affinity decreases with increased sorption (Barrow 1978). Olsen and Watanabe (1957) also suggest the importance of correction for initial surface phosphate
present in the soil.
The important factors t o consider when comparing data presented by either the Langmuir or the Freundlich model are: 1) the period and temperature of shaking, 2) the method of shaking, 3)
the soil-to-solution ratio, 4) the identity and concentration of the supporting electrolyte, 5) the initial moisture content of the soil, and 6) initial soil P content. All of these factors will affect the constants derived by any model used.
Biotic Phosphorus Retention. Periodically flooded soils such as those found in greentree impoundments represent a new regime in which t o study microbial uptake of phosphorus. There is a large pool of organic P in the soil, 60% of which may be microbial
(Cosgrove 1977). Organic P in soils is subject to decomposition by heterotrophic microbes, releasing soluble orthophosphate. The floodplain microbial community will be directly affected by anaerobic environments produced during the winter flood period and by abundant soil moisture early in the draw-down period. Conditions affecting transformation and retention of P by
microbes include: 1) soil composition and particle size, 2) type of microbes, 3) moisture content, 4) temperature, 5) pH, and 6)
soil aeration (Cosgrove 1977: Gunnison & g&. 1985). Soil pH and Eh are two critical factors that determine microbial
activity. Under anoxic conditions, anaerobic microbes largely control P dynamics, although there is generally a net release of
P from reduced iron when oxygen is <1.5 mg/L (Brannon et al.
1985). Soil microbial populations control much of the
mineralization of organic
P
in
soil (Brookes et al. 1984).Water fluctuation has a significant effect on the microbial
population and activity in soils (Lund and Goksoyr 1980). Microcosm studies showed that microbial uptake of P was
at higher concentrations where abiotic sorption dominated (Richardson and Marshall 1986). The upper 0 - 5 cm of soil had the highest microbial activity; in deeper layers, P uptake was mainly physically controlled (Richardson and Marshall 1986).
OBJECTIVES AND SCOPE
~nteractions between wastewater loadings to Piedmont wetlands and ultimate nutrient loadings to downstream water bodies are poorly understood. Changes to hydrology, such as the winter flooding of subimpoundments, and increased nutrient loadings, such as from sewage, significantly affect wetland soils, plant and animal species composition, productivity, and elemental cycling. Wetlands, in turn, affect turbidity, nutrient
concentrations, dissolved oxygen, and bacteria in the water. The major objective of this study was to gather original data on nutrient processing and removal in a wastewater-impacted
Piedmont stream bordered by a wide bottomland-hardwood wetland.
A further goal was to estimate the ability of the stream-wetland system, including the winter subimpoundents, to reduce nutrient inputs to Jordan Lake. We aimed to examine relationships
between rates of nutrient loading, rates of nutrient removal by wetlands, and changes in water quality, with particular
attention to the importance of the floodplain. The original scope was curtailed by the shortening of the grant period to only two years. Although the New Hope Creek floodplain is inundated less often and for shorter periods than those along Coastal Plain streams of similar size, we expected that nutrient removal by the bottomland soils would prove important. Detailed studies of phosphorus retention by the floodplain soil were
initiated because of the potential importance to lake water quality, but budget limitations also constrained this phase.
THE STUDY AREA
The stream-bottomland system selected for study is in
large, central sector of North Carolina. It has the highest population densities and the most industry but lacks abundant surface water relative to municipal demands. New Hope Creek originates in the Carolina Slate Belt, a region of moderate slopes and narrow valleys. After entering the lower grade Triassic Basin (Daniels &
a.
1984), it meanders through a floodplain approximately one-kilometer wide (Fig. 1). Because of meanders, the elevation of New Hope Creek decreases very slowly from north t o south with a grade of about 5 cm/km; the floodplain itself, however, has a grade of only about 8 c m / k m .The stream is usually turbid with suspended fine sediments
arising from erosion of upland soils and scouring of the stream channel (Simmons 1988)
.
~ l o o d p l a i n relief was similar along all three transects (Appendix B). Most stations fell within 0.5 m of the mean elevation along their transect. The bottom of the channel is about 2 m below the bank elevation (Appendix B), and the channel average 11.9 2 0.6 m wide based on 15 measurements between
Stations EFF and NH7. Old creek channels provide additional topographic lows which retain water after a flood or heavy rain. Since the floodplain is relatively flat and drainage is
sometimes poor, even soils at higher stations may remain
saturated long after floods have receded. Soils are described as the Chewacla-Wehadkee series ~ssociation, about 1.5 rn deep,
strongly t o medium acid, and with a silt-loam surface horizon and a silty-clay-loam subsurface ( U . S . soil conservation service 1971; Daniels & aJ. 1984). The bottomland is dominated by
moderately flood-tolerant hardwood trees.
The Corps of Engineers recently modified the study area by constructing three greentree subimpoundments along the Creek
(Fig. 1) t o be flooded from November through February for
wintering waterfowl. When completely full, they inundate 1.38,
1.7, and 1.7 km2 from the north to south subimpoundment,
respectively. The southernmost subimpoundment (south of 140)
Fig. I.
NEW
HOPE CREEK STUDY AREA
Map of Nev Hope Creek Study area. Stippled area is
forested vetland. Numbered black squares are water
quality sampling stations. Lettered parallel lines
Wastewater Treatment Plant (Farrington WTP). Wastewater treatment is by the activated sludge process. Greentree
METHODS
HYDROLOGY
Stream and effluent discharge rates came from the U.S.
Geological Survey gauging station (#02097314) near Blands
(Gunter et al. 1983: Hill et al. 1984, 1985; ~ a r k e r &
a.
1986; Ragland et al. 1987, 1989) and the Farrington WTP, respectively. The fraction of downstream (NH8) discharge contributed byeffluent was estimated by dividing the measured effluent flow by
the stream flow. It was also estimated from the concentration of effluent chloride remaining after dilution by stream water
(Kuenzler et al. 1987):
where FR is the fraction remaining and C 8 , CU, and Ce are the chloride concentrations at the downstream stations (NH8), the upstream station ( N n Z ) , and in the effluent, respectively.
The contact area between the New Hope Creek water and substratum was estimated two ways. Before and after greentree management
(June 1987-October 1988 and February-March 1989) while the stream was mostly in its channel, the contact area was assumed
to be the streambed. This area (4.5 x lo4 m2) was stream length between the outfall and Station MI8 (3.75 km) times mean stream width (11.9m). During greentree management (November 1988- January 1989), the contact area was streambed area plus t h e flooded area near Station NH7. Field observation suggested a
WATER QUALITY
Water quality changes were determined from changes in nutrient concentrations at stations above, at, and below the wastewater outfall t o establish patterns of nutrient retention and removal. Sampling trips were usually made every four weeks t o about ten stations (see Appendix A). Field measurements of water
temperature, conductivity, and dissolved oxygen were made with Yellow Springs Instrument Co. meters. The water pH was measured with Cole-Parmer Digi-Sense meter, usually within 1 hour of
collection. Grab samples were collected from just beneath the stream surface in rinsed disposable polyethylene bottles. Water for nutrient analyses was filtered through rinsed Whatman GF/F
glass fiber filters (effective retention = 0.7 fm). Samples for filterable reactive phosphorus (FRP; mostly orthophosphate), chloride (Cl), ammonium (NH4), and nitrate plus nitrite
(generally called NOx or nitrate in this report) were placed immediately on ice, then refrigerated at 4O C and analyzed
within 24 hours. Samples for determination of total phosphorus (TP)
,
filterable total phosphorus (FTP),
total Kjeldahl nitrogen (TKN) and filterable Kjeldahl nitrogen (FKN) were preserved with H2S04 t o pH less than 2, frozen or refrigerated, and analyzed within three weeks.Nutrient and chloride concentrations were measured colori-
metrically using methods provided by Orion Scientific Instrument Co. for their automatic analyzer. The concentrations of NOx
were measured after reduction on a copper-cadmium column by the Orion method; this closely resembles EPA Method 353.2
(Environmental Protection Agency 1983). The NHq concentrations were determined by the Berthelot reaction using reactants
prepared as for the TKN (EPA Method 351.2). The concentration of FRP was measured by the phosphomolybate technique after ascorbic acid reduction, a method very similar to EPA Method
365.2. Total-N and total-P concentrations were measured after
Particulate organic N (PON) was calculated by difference between
TKN and FKN concentrations. Filterable organic N (FON) was the difference between FKN and NH4 concentrations. Colorimetric analyses for T P and FTP of the digest were the same as for FRP. Particulate P was obtained by difference between TP and FTP
concentrations. Chloride was measured .by the ferric thiocyanate nethod (EPA Method 325.2). All concentrations were expressed as elemental mass per liter, e . g . , mg Cl/L, mg N/L, or mg P/L.
Analytical quality assurance was based on recommendations of the Environmental Protection Agency (1979). Standard curves were run for each analysis with every batch of samples. Analytical sensitivity, or lowest detectable concentration (LDC), was calculated to be twice the standard deviation of seven or more blank samples (Wilson 1961)(Table 2). Accuracy was determined from the percentage recovery of spiked samples (Table 2).
Calculation of nutrient loadina rate. Nutrient loading included nutrients from effluent and from New Hope Creek water. The
amounts of nutrients were divided by the contact area between water and substratum to calculate nutrient loading rates (NLR)
for each major nutrient species. The equation was as follows:
NLR (g/m2d) = (QU[NU]
+
Qe[Ne] )/Loading areawhere [NU] and [N,] were nutrient concentrations upstream at Station NH2, and at Station EFF, respectively, and QU and Q,
were daily flow rates at these two stations.
Calculation of nutrient removal. Net nutrient removal from stream water was considered to include physical, chemical and biological retention as well as transfer out of the system (e.g. by denitrification. It excludes the effect of simple dilution. Nutrient removal efficiencies were defined as decreases in concentrations in stream water after correction for dilution, assuming conductivity to be conservative. Decreases in
Table 2. ~ u a l i t y control assessment for accuracy and sensitivity.
-
Nutrient (Mean
+
3 S.D.) (mg/L) Filterable Reactive PhosphorusTotal phosphorus 101 2 3 0 0.01 b
Filterable phosphorus 101 2 25 0.01 b
Ammonium 99 & 27 0.07 a
itr rate
plus nitrite 104 5 11 0.001 aTotal Kjeldahl nitrogen
Filterable Kjeldahl nitrogen 110 & 73 0.04 b
Organic nitrogen 100 2 47 0.04 C
a. Calculated from spike recoveries in distilled water.
tributaries, base flow, or precipitation, and perhaps to lags in equilibration with interstitial water.
~utrient removal was calculated using principles applied to
Coastal Plain swamps (Kuenzler 1987). By comparing the measured nutrient concentration in effluent to the calculated
concentration (corrected for dilution by conductivity) at each downstream station, an estimate of nutrient removed by the bottomland stream system was obtained. The fraction remaining
(FRi) of effluent conductivity at downstream Station i was:
where Ci, Cut and C, are the conductivities of Station i, the upstream station (at NHZ), and the effluent, respectively. Estimation of sewaae-nutrient chanse. A calculated nutrient concentration, [Ni]calc, at downstream Station i was determined, assuming that the amount of nutrient in the effluent was diluted to the same extent as the conductivity:
where [NeImeas and [Nulmeas were the measured nutrient concentrations the effluent and at the upstream station,
The nutrient change at any downstream station
i
was divided byFRi t o calculate the concentration if dilution had not occurred; this in turn was divided by the measured concentration in the effluent to obtain a percentage of the sewage-nutrient change:
sewage-nutrient Change ( % ) = [loo]
*
(D[Ni]/'Ri) / [N,Jmeas
( 8 )Estimation of flux coefficient ( F C L The measured nutrient concentration of Station
i
resulted from simple dilution and nutrient removal. It included the nutrients contributed by effluent and stream water. On the basis of the measuredconcentration at Station
i t
corrected for the amount of nutrient input from stream water and the effect of simple dilution, acalculated effluent concentration [NeIcalc was determined. This
represents the effluent nutrient concentration which would provide the measured concentration at Station
i t
[Nilmeas, if there had been no dilution.The amount of nutrient dilution was assumed t o be the same as for conductivity dilution. The difference between the
calculated and measured effluent concentrations was the amount of net nutrient change by the system between the outfall and Station
i:
The value of
D[Ni]
is a function of distance (Dist) between theoutfall and Station
i
and a flux coefficient (FC). ThisA positive flux coefficient represented a net flux of nutrient to the water whereas a negative flux coefficient represented a net loss from the water,
S O I L SAMPLING
Three pairs of east-west parallel transects were established across the floodplain t o aid in random selection of soil
sampling stations and quantification of flood duration within the study area. Transect site A (north and south) was in the uppermost subimpoundment above Highway 54; sites B and C were in the lowermost impoundment above Stagecoach Road (County Road 1107)(Fig. 1). Each transect was divided into stations 10
meters apart, the elevations of which were determined from Corps of Engineers benchmarks using a David White transit. The
stations of each site were categorized into three elevation groups using the transit data along its paired transects. The low, medium, and high plots comprised 20%, 60%, and 20%,
respectively, of all stations at each site. Three stations from each of the three elevational categories were chosen by a
stratified random sampling design for a total of nine stations from each transect pair.
At each of these random stations, four soil cores (2.25 cm dia.) were taken 2 m from the station center at 45, 135, 225, and 315 degrees magnetic. Soil cores were subdivided vertically into litter, 0-10 cm, and 10-20 cm layers. Similar depth layers from the four cores were combined into one composite station sample and returned t o the laboratory on ice. All selected stations from a transect pair were sampled on the same day. Large roots were removed and the composite samples were homogenized, then refrigerated ( ~ O C ) at field moisture until analyzed. Soil
SOIL ANALYSES
soil pH was determined in a 1:10 w/v ratio of soil t o 0.01 M
CaC12. sand-silt-clay percentages were determined using the
hydrometer procedure of Day (1965). Subsamples of each fraction
were weighed before and after oven drying at 1 0 5 ~ ~ for 24 hours
t o determine wet/dry ratios for use in formula conversions. The
oven-dried soil was then pulverized using a mortar and pestle.
To determine inorganic P (Pi) and total P content of soil
samples, 0.5 g of pulverized soil from each layer was weighed
into a) 50 ml polyethlyene centrifuge tubes and b) 20 ml
crucibles. The sample set in the crucibles was muffled overnight at 550°c, reweighed t o determine loss on ignition
( U I ) , and then transferred t o centrifuge tubes for total P
extraction. Both sets were extracted for 20 hours with 1N H2S04
on an end-over-end shaker at 2 5 O ~ . After the extraction period,
samples were centrifuged at 2500 rpm for 25 minutes, the
supernatant was neutralized with 5N NaOH, and the P
concentrations determined calorimetrically (Olsen and Sommers
1982).
Phosphorus sorption potential was determined on the 0-10 cm and
the 10-20 cm soil layers from each station. Two grams (field
moisture content) of soil from each layer (except litter) was
weighed into each of five Kimax centrifuge tubes, giving a total
of 9 0 tubes plus replicates at several stations. The tubes were
then treated with 30 ml of a supporting ionic solution
consisting of 0, 15, 30, 60 and 120 mg P/L as KH2P04 in O.0lM
CaC12 and 0.1% NaNj. These treatments were placed on an end-
over-end shaker for three days t o allow equilibration. The
tubes were then centrifuged at 2500 rpm for 25 minutes and the
equilibrium phosphorus concentration (C ) of the supernatant
eq
was measured using the method of Watanabe and Olsen (1965). The
amount o f phosphorus lost from solution and assumed t o be have
where Q was the mass of P removed per unit mass of soil (mg/g), Co was the initial P concentration (mg/l), v was the volume of supporting ionic solution (L), and m was the dry-weight
equivalent mass of soil (g).
DATA ANALYSIS
Data handling and graphing was done using Lotus 1-2-3 (Lotus Development Corporation, cambridge, MA) on IBM microcomputers. Measured or calculated concentrations below the LDC of the method were assigned a concentration one-half of the LDC. Descriptive assessments of downstream nutrient changes and of flux coefficients were done using Systat (SYSTAT, Inc.,
Evanston, IL) box plots (Tukey 1977). Significance of
differences among stations determined from box plots (McGill &
al. 1978) was based on the median and 95% confidence interval of
-
log-transformed data (Tukey 1977). Median flux coefficient of each major nutrient species was determined by Systat stem-and- leaf displays. Pearson correlation procedure, regression
procedure, and test of nomality in Statistical Analysis System (SAS 1986) were used to examine the relationship between
nutrient loading rate and flux coefficient for FRP, TP, NO,, and
TN. The nonparametric sign test (Quade 1989) was used t o
examine the median of flux coefficient. It is based on the signs of the diviations of the observations from the
hypothesized median. The probability of significant differences from the null hypothesis (Ho: hypothetical median = 0,
evidencing no net flux) was determined by comparison t o the binomial distribution. Soil phosphorus concentrations and
RESULTS
STREAM HYDROLOGY AND TEMPERATURE
Rainfall and runoff were lower than usual during the dry, two- year period of this study. Precipitation at Carrboro, about six miles south of the headwaters of New Hope Creek, was less than
the 94-year mean monthly values at or near Raleigh (Ruffner and
Blair 1985) in 17 out of 24 months (Fig. 2). The first year (1987-1988) showed a 15-cm deficit from the long-term annual mean (114 cm). The second year had only a 2.5-cm deficit,
largely because of monthly rainfalls exceeding 17 cm in October 1988 and February and March 1989; these three months provided 48% of the precipitation during the second year.
The mean monthly discharges of New Hope Creek at County Road
1107 (Station NH8, ~ i g . 1) varied widely from about 17 cfs in August 1987 and December 1988 to 1400 cfs in March 1989 (Fig.
3)(Ragland, et al. 1987, 1989; U.S. Geological Survey file report)(l cfs = 28.3 L/sec). Mean monthly stream discharges were below the prior 4-year average (Water Years 1983-1986) in every month of the study except April and September 1987,
January, September, and October 1988, and March 1989 (Fig. 3).
The annual mean discharge during WY 1988 was 48 cfs, whereas the
4-year mean was 104 cfs. Stream flows on the sampling dates were also skewed toward below-average discharges; only in June and September 1987 and April, May, and September 1988 did daily discharges exceed the 4-year mean discharge for those months
(Fig. 4). vapora at ion and seepage into the stream bed may
account for lower flow at Station NH8 than of wastewater in October 1987. The wastewater treatment plant effluent exceeded 25% of total stream flow at Station NH8 during the dry periods
of May-December 1987 and June-December 1988 ( ~ i g 4). Wastewater discharge rate varied much less than stream discharge.
Inundation of the floodplain during the study was restricted t o
local areas behind beaver dams ( e . g . , Third Fork Creek) and the
D I m R E N C E FROM LONG-TERM MEAN
12
,
A M J J A S O N D J F M A M J J A S O N D J F M
MONTH 1087-1989
Fig. 2. Difference between monthly precipitation during the study period (measured in Carrboro) and the mean monthly
precipitation during 1887-1983 (measured at Raleigh or Raleigh-Durham Airport).
MEAN MONTHLY D I S C U R G E S
1.5
MONTH 1917- 1 SO@
o t ~ a 7 - t s a 0 + 4-YR MEAN
F i g . 3 . Mean monthly discharge (cis) of H ~ w Hope Creek during 1987-89 compared to the four-year aean for vatar year8
MONTH 1987-1 989
p
-A NEW H O P E CREEK q-\I EFFLUENT
Fig. 4. Daily discharge (cfs) of New Hope Creek at station NH8 compared to daily discharge of Farrington Road Wastewater Treatment Plant on the sampling dates. (Data for July and November 1987 are missing.)
DAYS SINCE 24 J U N E 1987
0 NH2 0 EFF A NH5 X NH6 V NH8
Fig. 5 . Water temperature (C) at time of sampling. ~ i n e s
connecting points do not imply linear changes, but are to
overbank flow during a few days following heavy rains during February and March 1989. The winter subimpoundment pool at NH7 expanded the contact area between water and substratum from
4 2 5 2
about 4 * 5
x
10 m to an estimated 6.8x
10 m.
Water temperatures showed the usual sinusoidal seasonal pattern. Stream water temperatures ranged from about 2O t o 20°c. (Fig.
5), whereas the wastewater temperature never dropped below loOc. CONDUCTIVITY, CHLORIDE, pH, AND DISSOLVED OXYGEN
Stream conductivities immediately above the outfall (Station
NH2) averaged 120 uS/cm (Table 3) and never exceeded 171 uS/cm
whereas the effluent averaged 476 and always exceeded 400 uS/cm (Fig. 6). Conductivity tended t o decrease again below the outfall, especially during January-May 1988 and January-March 1989 when heavier stream discharges provided dilution water for the effluent; the mean at Station NH8 was 286 uS/cm (Table 3).
During the dry seasons, however, the changes in conductivity downstream were small. The patterns of chloride concentration
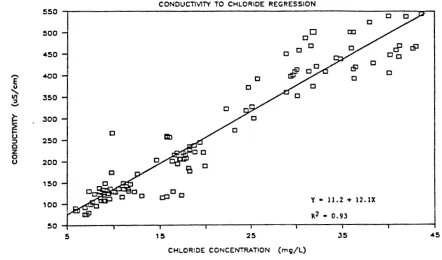
(Fig. 7) and conductivity were very similar, showing a strong positive relationship (Fig. 8). chloride concentrations ranged
from 6 t o 17 mg/L upstream and from 29 t o 44 mg/L in the effluent, averaging 10.7 and 38.3, respectively (Table 3).
Chloride and conductivity values at Station NH2 were used t o determine dilution factors by which nutrient concentrations below the outfall were corrected in order to calculate net nutrient removals. Chloride concentrations at Station NH8
averaged only about 60% of the mean values
in
effluent, but the much higher standard error downstream (Table 3) reflects the varying dilution through the year.Mean pH values were not significantly different among these three stations (Table 3), but there were seasonal changes
exceeding 2 pH units at some stations. Dissolved oxygen (D.0.)
concentrations at all stations were high (mostly in the range of
4-12 mg/L) but varied considerably among sampling dates and
Table 3. Water quality characteristics (mean
+
2 S.E.) justabove the outfall (Station NH2), the wastewater effluent
(station EFF), and 3.75 km below the outfall (Station NH8) on
New Hope Creek based on all data from May 1987
-
March 1988.- - -
Variable NH2 EFF NH8
Conductivity (uS/cm) 120 2 11
Chloride (mg/L) 10.7 1.8
Dissolved oxygen ( % sat.) 65
t
14PH 6.5 & 0.2
Nitrate
+
nitrite (mg/L) 0.26+
0.08Ammonium (mg/L) 0.07 & 0.02
Particulate N (mg/L) 0.16
+
0.06Total N (mg/L) 0.74
+
0.15Filt. reactive P (mg/L) 0.05 2 0.01
Particulate P (mg/L) 0.09
+
0.04A S 0 D J F M A M J J A S O N D J F M
1 ' I
0
1 ' 1 "
: , :
: : :200 400 600
DAYS SINCE 24 JUNE 1987
0 NH2 0 fff L N H 5 X N H 6 v NH8
Fig- 6 . conductivity (pS/cm) of effluent and New Hope Creek w a t e r .
*
A S 0 D J F M A M J J A S O N D J F L(
0 1 .
8 1 .
0
I ' I '
.
. I ; : : :200 400 600
DAYS SINCE 24 JUNE IS87
0 EFF A N H S X N H 6
CONDUCllVlM TO CHLORIDE REGRESSION 550
0
500
-
mFig. 8.
CHLORIDE CONCENTRATION (mg/L)
elations ship between chloride concentration and conduct-
ivity in effluent and new Hope Creek w a t e r , 1987-1989.
DAYS SINCE 24 JUNE 1987
0 EFT A NH5 X N H 6
Fig. 9. Dissolved oxygen concentration (mg/L) in effluent and New
from 29 t o 152 (mean = 65) percent (Table 3), whereas the
effluent averaged 96 percent of saturation. Thus the effluent tended t o increase the D.O. levels below the outfall; there was never evidence of a D.O. sag from biochemical oxygen demand of the wastewater just below the outfall. The mean D.O. value was
75% of saturation at Station NH8. NUTRIENT CONCENTRATIONS
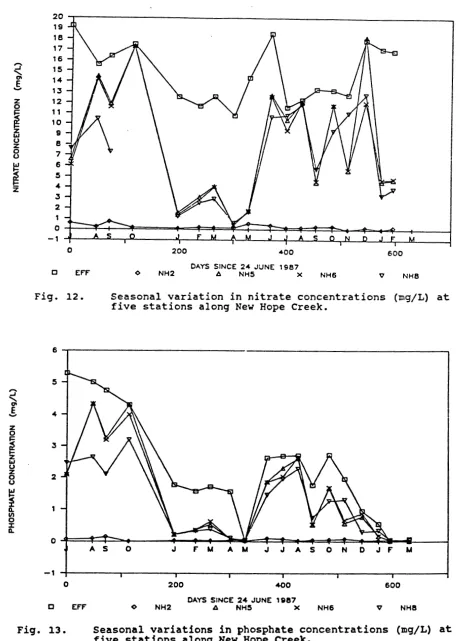
Inorganic nutrient analyses began in May 1987, but regular total-nutrient determinations began in January 1988. Total-N concentrations at Station NH2 above the outfall were usually less than 1 mg/L (Appendix C) and averaged 0.74 mg/L (Table 3). Except in August-October 1988, the operationally defined organic nitrogen (PN plus FON) dominated, NOx tended to be intermediate, and NH4 constituted the smallest fraction of nitrogen at the control station (Fig. 10A). The nitrate concentrations were much higher in the effluent (mean = 14.2 mg/L; Table 3),
completely dominating the nitrogen pools (Fig. lOB). At NH8, the lowermost station, NOx still dominated the nitrogen pools with a mean concentration of 6.5 mg/L (Table 3; Fig. 10C). Because the NH4 concentrations were so low, they will receive little discussion.
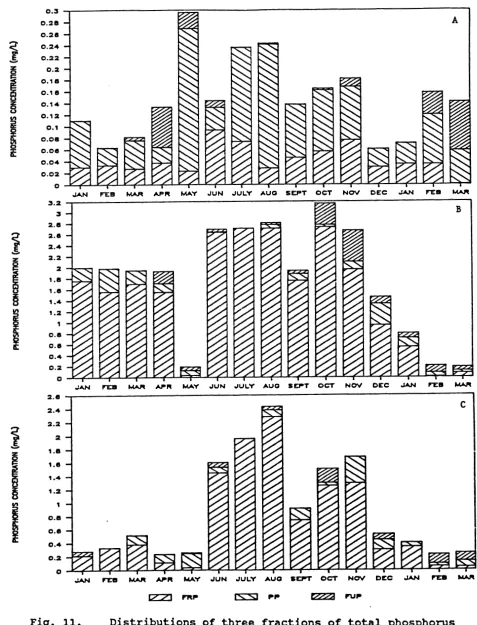
Particulate P was the largest fraction in most New Hope Creek samples above the outfall (Fig. 11A); concentrations at NH2
ranged widely, from 0.03 to 0 . 2 5 mg/L and averaged 0.09 mg/L (Table 3). Although never exceeding 0.14 mg/L, FRP was the second largest fraction (Appendix C). Wastewater phosphorus, however, was dominated by FRP (Fig. llB), averaging 2.37 mg/L
(Table 3), almost two orders of magnitude higher than New Hope Creek water. Except for dilution in the wet months, the
Fig. 10. Distributions of four fractions of total nitrogen (mg/L)
at (A) Station NH2, (B) Station EFF, (C) Station NH8.
J14N FEB M A R APR MAY JUN JULY AUO SEPT OCT N O V DEC JAN FEB W
J A N M A R APR MAY JUN JULY AUO S D T OCT N O V DEC 34N FEb hUR
Fig. 11. Distributions of three fractions of total phosphorus
(mg/L) at (A) Station NHZ, (B) Station EFF, ( C ) Station