©
DOI: 10.1534/genetics.104.039107
The Exchangeability of Amino Acids in Proteins
Lev Y. Yampolsky* and Arlin Stoltzfus
†,1*Department of Biological Sciences, East Tennessee State University, Johnson City, Tennessee 37614-1710 and†Center for Advanced Research in Biotechnology, Rockville, Maryland 20850
Manuscript received July 29, 2004 Accepted for publication May 11, 2005
ABSTRACT
The comparative analysis of protein sequences depends crucially on measures of amino acid similarity or distance. Many such measures exist, yet it is not known how well these measures reflect the operational exchangeability of amino acids in proteins, since most are derived by methods that confound a variety of effects, including effects of mutation. In pursuit of a pure measure of exchangeability, we present (1) a compilation of data on the effects of 9671 amino acid exchanges engineered and assayed in a set of 12 pro-teins; (2) a statistical procedure to combine results from diverse assays of exchange effects; (3) a matrix of “experimental exchangeability” values EXijderived from applying this procedure to the compiled data; and (4) a set of three tests designed to evaluate the power of an exchangeability measure to (i) predict the effects of amino acid exchanges in the laboratory, (ii) account for the disease-causing potential of missense mutations in the human population, and (iii) model the probability of fixation of missense mutations in evolution. EX not only captures useful information on exchangeability while remaining free of other effects, but also outperforms all measures tested except for the best-performing alignment scoring matrix, which is comparable in performance.
M
EASURES of the pairwise distance (or similarity) of rate at which mutation introduces new alleles (Kimuraamino acids provide the basis for scoring schemes 1983).
in the alignment of sequences (HenikoffandHenikoff Although mutational effects are rarely treated as im-1993) and in other types of comparative analysis (Wen portant phenomena in their own right, they appear to
et al.1996;Yanget al.1998;Atchleyet al.2001;Alex- be extremely important. For instance, each
nonidenti-andreandZhulin2003). A great many such matrices cal amino acid pair can be assigned a “genetic code dis-exist: an incomplete listing available from the AAIndex tance”Gij僆{1, 2, 3} equal to the minimum number of database (KawashimaandKanehisa2000) includes 83 nucleotides that must be changed to switch from amino matrices of pairwise amino acid similarity or distance acidi to amino acid j; the different categories some-and 494 indices of amino acid properties. Formally re- times are referred to as “singlet,” “doublet,” and “triplet” lated to these are various schemes to distinguish “con- exchanges. The practical importance of genetic code dis-servative” from “radical” amino acid changes (Hughes tance is amply demonstrated by the effectiveness of Fitch’s et al.1990;Hughes1992;Randet al.2000;Zhang2000). matrix of “mutational” distance (Fitch1966) as a source A tacit assumption has been that the ultimate yard- of match scores for protein sequence alignment (Feng stick for measuring amino acid similarity is the propen- et al.1985). Furthermore, pairs of amino acids with the sity for evolutionary change from one amino acid to an- same genetic code distance may differ in the density other. However, evolutionary transition probabilities, of minimum-length mutational paths connecting them. although they must reflect the operational exchange- Finally, specific mutational paths between codons may ability of amino acids in proteins, must also reflectrates differ in rate due to nucleotide mutation biases. For of mutation from one kind of codon to another(in principle, instance, both Ala-Gly and Ala-Val are singlet exchanges they may also reflect subtle fitness effects unrelated to with the same singlet path density (1 per codon), but protein operation, due to different metabolic costs of Ala and Val are interconverted by a nucleotide transi-different amino acids or to transi-different translational effi- tion mutation (GCN↔GTN) with a severalfold higher ciencies of different codons, and so on). In the simplest rate (Schaaperand Dunn 1991;Nachman and Cro-case in which new mutations are rare, and regardless well2000) than the nucleotide transversion mutation of whether one is considering random or selective fixa- that interconverts Ala and Gly (GCN↔GGN). Likewise, tions, the rate of evolution is directly proportional to the
a bias favoring AT (or GC) base pairs would affect the relative rates of Glu →Gly (GAR → GGR) vs. Glu → Val (GAR→GTR), and such effects seem to have played
1Corresponding author:Center for Advanced Research in
Biotechnol-an importBiotechnol-ant role in the evolution of amino acid
compo-ogy, 9600 Gudelsky Dr., Rockville, MD 20850.
E-mail: arlin.stoltzfus@nist.gov sition (SingerandHickey2000).
The ability to distinguish such mutational effects from measure is here called “experimental exchangeability” selective effects relating to protein operation is of con- (EX). EX and diverse other measures were evaluated siderable interest. To address this issue requires a reli- for their power to (1) predict effects of experimental able measure of the exchangeability of amino acids in amino acid exchanges, (2) account for the disease-caus-proteins that is free of mutational effects. Such a mea- ing potential of different types of missense mutations sure would not be easy to find. The distance measures of in humans, and (3) model the acceptance of missense
Grantham(1974) andMiyataet al. (1979) are used com- mutations in protein evolution. In these tests, the perfor-monly as though they were pure measures of physico- mance of EX exceeds or closely follows the best of the chemical distance (e.g.,Li1997;Krawczaket al.1998; other measures tested, which include matrices based on
Yanget al.1998;GraurandLi2000), yet they are not. sequence alignments, computational structural model-The approach taken byGrantham(1974) was to iden- ing of proteins, andad hocstatistical measures incorpo-tify, from a large number of potentially relevant physico- rating physicochemical properties of amino acids. Of the chemical properties, a set of three—volume, polarity, available measures, EX seems to be the best-performing and composition—that, when their differences are as- measure that is free of mutational biases, and it is the signed appropriate weights, provide an unusually good only measure that is likely to be substantially improved fit with observed evolutionary transition probabilities. in the future by modest increases in the amount of Thus, Grantham’s distances (and the derived measure of available experimental data.
Miyataet al.1979) represent a physicochemical param-eterization of evolutionary propensities. Pure measures
of amino acid exchangeability exist, but they are theo- MATERIALS AND METHODS retical;e.g.,MiyazawaandJernigan(1993) computed
Identification of studies for inclusion:An initial set of three expected effects of exchanges in proteins of known
struc-widely cited exchange studies (Axeet al.1998; Kleina and ture using a contact-energy model. However, because the Miller1990;Rennellet al.1991) was expanded by tracking validity of the theoretical model is uncertain, one does citations forward and backward (utilizing the “Web of Science” not know how well the results will apply to real exchanges service from the Institute for Scientific Information). To iden-tify further studies, surveys were carried out by inspection of in proteins.
entries in the Protein Mutant Database (PMD) (Kawabataet al. An alternative strategy for deriving a mutationally
un-1999), as well as by keyword searches in PubMed. Candidate biased measure based on actual amino acid exchanges studies were then screened individually to identify studies would be to use data from the experimental manipula- with at least 20 single-exchange variants generated and assayed tion of proteins. The published literature includes many under conditions that do not appear to impose strong biases on (i) the set of sites subject to exchanges, (ii) the set of ex-studies in which a large pool of variant proteins, each
changes imposed on each site, and (iii) the set of exchange differing from a reference protein (typically a wild type)
variants assayed for biological or biochemical effects. Ideally, by a single amino acid residue, is assayed for the effects
each set should be a complete set, a randomly chosen subset, of this change. Such exchanges clearly reflect the com- or, at the very least, an arbitrary subset based on some factor plexities of real proteins (albeit operating under labora- (typically, experimental convenience) extraneous to the issues
raised by exchangeability. tory conditionsin vitro or in vivo). Furthermore, such
Some judgment was exercised in the application of the above exchanges can be produced and assayed systematically.
criteria. For instance, the choice to alter only conserved bind-For instance, Rennell et al. (1991) placed nonsense
ing motifs bySlacket al. (2000) was considered a problematic codons at every position (except the start codon) in a bias, while the choice ofHortnagelet al. (1999) to alter only T4 lysozyme gene and then used a set of 13 suppressor a continuous block of 20 sites in RecA (or the similar focus of strains to insert (separately) 13 different amino acids CunninghamandWells1989 on a set of three blocks compris-ing 54 sites) was considered tolerable, partly because a 20-residue at each position. The resulting nonsense-site/suppressor
block is a sizeable block and partly because the experimenters combinations were assayed by growth of the bacteriophage
were otherwise highly systematic in producing and assaying in vivo, with the effect of the exchange being assigned to all 20⫻19⫽380 possible single-exchange variants within this one of four categories (“⫺,” “⫹ ⫺,” “⫹,” “⫹ ⫹”) on the block. The second criterion was not interpreted to exclude ala-basis of the size of the bacteriophage plaque. When nine-scanning studies, to the extent that alanine is an arbitrary subset of all amino acids. The third criterion does not necessar-such studies do not introduce biases on the retention
ily exclude studies that rely on selective growth of a subset of or loss of activity (e.g., by altering only active-site
resi-variants, because in some cases (see supplementary materials dues), they may serve as the basis for deriving a measure
at http://www.genetics.org/supplemental/) the membership of of exchangeability. the subset of variants that failed to grow can be inferred, so In this work, a set of such systematic exchange studies that the composition of both the “inactive” and “active” classes
is known. is identified, comprising 9671 amino acid exchanges in
Structural analysis:Protein structure data are from the Pro-12 different target proteins. An analysis of the activity
dis-tein Data Bank (Bermanet al.2000). For proteins with a known tribution of variants suggests a common severity-of-effect
site is classified as “buried” if the wild-type amino acid is⬍20% tU ⫽ 0.12, or 12% wild-type activity, and the activity value assigned (by way of Equation 3) to variants in the minus accessible relative to its accessibility in an Ala-X-Ala tripeptide.
The correction for sampling error in the frequencies of category would beAminus⫽0.037, or 3.7% wild-type activity. In some cases, the effects of amino acid exchanges may be exposure for each amino acid (used in computing the
context-averaged exchangeability, explained below) is based on acces- given, not by assignment to categories, but by a continuous valuexfrom some measurement that does not have the units sibilities computed for a large and nonredundant set of
struc-tural data, namely the PDB_SELECT25 (HobohmandSander of relative wild-type activity (e.g.,xiis aKdor⌬⌬Gvalue). In such a case, the observed values can be ranked and treated 1994) subset of 2216 structurally characterized chains with an
upper limit of 25% pairwise sequence similarity. For this set as a set of categories (i.e., one category for each distinct value ofxi) for the purpose of assigning activity scores. In general, of chains, computed surface accessibilities for 342,785 residues
in 2159 chains are available in the Definition of Secondary Struc- this method makes the implicit assumptions (seediscussion) that the scale of experimental values has a monotonic relation-tures of Proteins (DSSP) database (Hooft et al. 1996). The
resulting frequencies with which amino acids are exposed ship with activity and that the polarity of this relationship is known (i.e., one knows which end of the scale represents low (⬎20% surface accessibility relative to an Ala-X-Ala tripeptide)
are, in increasing order: Cys, 21.7%; Ile, 24.7%; Phe, 27.8%; activity and which end represents high activity).
Statistical procedures:Unless otherwise indicated, statistical Leu, 28.8%; Val, 29.0%; Trp, 34.3%; Met, 37.3%; Ala, 42.9%;
Tyr, 42.9%; Gly, 56.9%; Thr, 59.9%; His, 60.0%; Ser, 62.0%; analysis was performed with the Macintosh program JMP (SAS
Institute1999). Pro, 66.6%; Asn, 72.8%; Gln, 76.8%; Arg, 77.9%; Asp, 78.1%;
Glu, 83.8%; and Lys, 88.0%. These values correlate strongly Frequency-activity regression:The regression in Equation 1 is estimated (by nonlinear regression) from any {t,pt} pairs avail-(R2⫽0.93) with the values presented in a previous study with
a 100-fold smaller set of data (Holbrooket al.1990, Table II). able from the set of 12 studies. Data points are weighted so that each study contributes equally. To assign weights by study Assignment of scores to a common scale:Some
experimen-tal exchange studies provide information on the proportion size would be inappropriate, because most of the uncertainty is in the value oft, which is independent of study size, not of variantsptobserved to have activity below some threshold
level,t. Such {t,pt} pairs are points on a cumulative frequency pt, which is more reliable for larger studies. For example, in the T4 lysozyme study, the reported threshold value oft⫽ distribution functionC(t), a nondecreasing function oft
de-limited byC(0)⫽0 andC(∞)⫽1. If a common function can 3% for the minimal activity of “⫹” variants might be off by a factor of two in either direction, whereas the range of the be found to fit all studies, then it may be used to assign scores
on the common scale oft, even for experiments that provide 95% confidence interval forpt⫽328/1918⫽0.171, which is only a ranking of results with no activity measurements. To 0.154–0.189, is only a factor of 1.1 in either direction. In two define a suitable cumulative frequency distribution function cases (HIV-RT and insulin), quantitative activity values for all C(t) in the absence of a cleara prioriexpectation of its mathe- variants have been determined experimentally, and therefore matical form, we find an empirical fit toC(t)⫽B(t)/(a⫹B(t)), the entire observed cumulative frequency distribution may be where the basis functionB(t) is chosen from a small number used in the regression.
of simple functions (linear, exponential, or power function). In Missing data, weights, and uncertainties:For 6 of the 380 off-practice (seeresults), the power law allows the best fit, and thus diagonal cells of the 20⫻20 exchangeability matrix, no ob-the frequency distribution function is defined as servations are available, while the remaining cells represent varying numbers of observations (seeresults, Table 2). The missing EX values are excluded from all analyses, and the C(t)⫽ t
b
a⫹tb, (1)
remaining values are analyzed using the number of observa-tions as a weight. For instance, the symmetric form of ex-whereaandbare estimated from the data (seeStatistical
pro-changeability is computed with the formulaSij⫽ (nijEXij⫹ cedures, below). Differentiating the cumulative distribution
njiEXji)/(nij⫹nji); that is, the mean is weighted by the relevant function,C(t), yields a frequency density function:
numbers of observationsn. When a standard error is given for an individual EXijvalue, this is the standard error derived f(t)⫽dC/dt⫽ a bt
b⫺1
(a⫹tb)2. (2) by bootstrapping across studies (results are available from the authors).
This distribution function may be used to convert ordinal values Measures used for comparative evaluation:The AAIndex data-to continuous-activity values, as illustrated in Figure 1. First, base (KawashimaandKanehisa2000) lists nearly 100 mea-given the frequencies of variants in each ordinal category, the sures of amino acid similarity or distance, not including some lower and upper thresholds,tLandtU, may be estimated from recently derived matrices (e.g.,VenkatarajanandBraun2001; the results of the regression ofC ont(Equation 1). Second, XiaandXie2002). Rather than testing all available measures, given the values oftthat define a category of effect (values that we defined a set of six categories, drawing one or two represen-may be computed from Equation 2 or known empirically), tative measures from each category as explained inresults. observations in a category may be assigned a continuous value The BLOSUM series of matrices were taken fromHenikoffand AL,Udefined as the mean value for the category: Henikoff’s (1992) supplementary material, which provides five digits of precision (better than the reduced-precision matrices widely used by sequence alignment software). The VB (
Ven-AL,U⫽
冮
L Ut f(t)dt
冮
L Uf(t)dt
. (3) katarajan and Braun 2001) matrix was obtained in elec-tronic form from the authors, and the XX matrix was entered manually fromXiaandXie(2002). Other measures are from the AAIndex database (KawashimaandKanehisa2000). This has no analytical solution given the definition off(t) in
Comparative evaluation using experimental exchanges:The power Equation 2; therefore, it is evaluated numerically (using
Mathe-of various measures Mathe-of exchangeability was evaluated by pre-matica 4.0). As a numerical example, one may consider the
dicting the results of experimental exchanges. Circularity in pre-hypothetical “minus” category depicted in Figure 1, which
in-dicting experimental exchange effects using an EX measure cludes the 47% of variants with activities ranging fromtL⫽
is avoided by using a jackknife method in which the predictor 0 to the unknown upper thresholdtU. If the regression (1)
indepen-TABLE 1
Summary of experimental exchange studies
Protein Source species Methoda Sitesb Variants Exchange effects assayed Citation LacI Escherichia coli Sup 328 (360) 4038 Operon repression, Markiewiczet al.
in vivo (1994)
Lysozyme Phage T4 Sup 155 (164) 1918 Plaque size,in vivo Rennellet al.(1991) Interleukin-3 Homo sapiens Sat 103 (152) 754 Cell proliferation, Olinset al.(1995)
in vivo
Barnase E. coli Sat 109 (110) 676 RNAse activity,in vivo Axeet al.(1998) -Lactamase Pseudomonas Sat 27 (246) 513 Ampicillin resistance, MateronandPalzkill
in vivo (2001)
RecA E. coli Sat 20 (323) 380 Plaque size,in vivo Hortnagelet al.(1999) Reverse transcriptase HIV Sat 109 (300) 366 RNA-dependent DNA Wrobelet al.(1998)
polymerase activity, in vivo
Protease HIV Sat 99 (99) 336 Protease activity, Loebet al.(1989)
in vivo
Protein V Phage f1 Sat 86 (87) 313 Host inhibition, Zabinet al.(1991)
in vivo
Nuclease Staphylococcus Scan 143 (149) 290 ⌬⌬G,in vitro Greenet al.(1992);
Meekeret al.(1996);
Shortleet al.(1990) Growth hormone H. sapiens Scan 50 (191) 50 Dissociation constant, CunninghamandWells
in vitro (1989)
Insulin H. sapiens Scan 37 (51) 37 Receptor affinity, Kristensenet al.(1997)
in vitro
Total 1266 9671
aSup, nonsense suppression; sat, saturation mutagenesis; scan, alanine scanning (Ala and Gly scanning in the case of Nuclease). bAmino acid positions altered (in parentheses, total number of positions in the protein).
dent predictor EX⫺Tbased on results from all proteins except contribute to the category are not saturated with detected variants.
T. For target studies in which the effects of exchanges are
given on a continuous scale (e.g., percentage of activity), a Comparative evaluation using evolutionary probability of acceptance: For use in a model of sequence evolution, similarity measures linear regression with the predictor is used. When the target
results are ordinal (e.g., “⫺,” “⫹”), logistic regression is used. are converted to distances by subtracting each value of the measure from its maximum value. The minimum distance is For testing the entire set of 9671 results from all 12 target
studies, each result is paired with its independent predictor thus zero, and in the Goldman-Yang model as implemented in the PAML package (Yanget al.1998), amino acid pairs with EX⫺T, and linear regression is used, with ordinal values
con-verted to continuous-activity values as described (see above, this distance will be accepted with the highest probability pos-sible for a nonsynonymous change. The nucleotide alignments Assignment of scores to a common scale). For purposes of
interpre-used for evolutionary analysis are from two sources: the con-ting the results of this test, it is helpful to define thepowerof
catenated mitochondrial gene data fromYanget al.(1998) and a study as the number of variants assayed multiplied by the
the 10 eukaryotic sequence families analyzed byQiuet al.(2004). mean information content of an assay result. The mean
infor-Sites in the latter data sets with noncanonical codons (due to mation content of an ordinal assignment is ⫺兺(fi log fi),
protist genes with noncanonical genetic codes) were removed wherefiis the frequency of theith category, ignoring
uncer-from the analysis. The PAML software was executed using a tainty in the assignment itself, which reduces information
con-control file specifying the codon model (seqtype⫽1, model⫽ tent to an unknown degree. Continuous-valued results are
0, as inYanget al.1998) and the appropriate genetic code. ranked and treated as ordinal data for the purpose of
comput-ing information content (again, ignorcomput-ing uncertainty in the ranking).
RESULTS Comparative evaluation using data on human variation:EX and
other measures are used as predictors of disease-causing
po-Studies chosen for inclusion:From an initially broad tential, defined (for each source-destination combination) as
literature search, the number of candidate studies was the ratio of the number of Human Gene Mutation Database
(HGMD) entries (Stensonet al.2003) to the number of HGV reduced by eliminating small studies (⬍20 variants) and Base entries (Fredmanet al.2002; http://hgvbase.cgb.ki.se/), then by eliminating studies with methodological biases, using only those HGVBase SNPs with “proven” status. This as described inmaterials and methods. These crite-ratio of the number of entries for particular categories of
ria reduced the number of candidate studies by roughly variant is not the same as a ratio of population frequencies;
two orders of magnitude, to a total of 15. The most com-nevertheless, it can be used as an estimator (e.g., as in
TABLE 2
Counts of exchanges by source (row) and destination (column)
C S T P A G N D E Q H R K M I L V F Y W Total
C . 7 2 7 7 9 1 1 7 6 6 8 6 3 1 7 2 8 9 2 99
S 45 . 13 45 61 46 8 5 40 39 37 44 40 4 7 42 5 42 44 3 570
T 33 56 . 54 60 44 16 7 34 35 35 43 39 5 21 34 9 32 33 5 595
P 21 33 21 . 45 30 5 6 22 26 29 39 26 5 6 41 5 22 20 6 408
A 52 68 16 71 . 80 5 12 59 53 54 56 55 4 2 61 25 53 54 3 783 G 57 59 15 46 77 . 11 24 53 45 43 63 48 10 14 45 43 42 43 13 751 N 27 39 17 31 40 34 . 16 27 29 40 31 36 7 17 35 9 28 35 7 505 D 30 33 7 34 58 57 24 . 53 33 46 33 33 5 5 35 25 32 49 4 596 E 25 34 6 31 58 49 5 15 . 32 27 29 33 4 3 32 13 25 28 3 452
Q 31 37 5 46 44 37 3 1 44 . 42 43 37 4 5 46 5 32 30 5 497
H 12 14 7 17 21 18 11 8 13 18 . 19 14 7 7 19 6 16 17 6 250
R 36 46 9 40 44 45 3 4 31 33 41 . 37 1 8 43 6 31 30 3 491
K 25 38 24 29 55 50 22 5 38 45 28 46 . 15 14 31 7 26 27 7 532
M 15 14 3 15 22 19 4 3 14 14 15 17 16 . 7 18 5 15 14 2 232
I 32 52 27 37 44 40 17 4 35 33 33 46 37 23 . 60 30 49 30 4 633 L 55 74 14 72 86 73 10 7 61 68 63 79 57 15 19 . 33 68 56 14 924 V 47 49 7 48 70 68 4 11 52 46 48 48 45 5 17 58 . 54 45 4 726 F 21 21 4 15 23 15 4 4 13 11 13 14 14 2 13 24 11 . 21 4 247 Y 29 27 0 16 26 22 11 12 14 15 26 18 14 1 0 16 0 31 . 2 280
W 11 8 1 6 6 12 0 0 5 6 5 9 6 1 0 11 1 6 6 . 100
Total 604 709 198 660 847 748 164 145 615 587 631 685 593 121 166 658 240 612 591 97 9671
were that the study aimed to identify only “critical” resi- A common severity-of-effect distribution as the basis for combining results:The 12 studies differ in the target dues by focusing on a handful of predefined target
resi-dues (e.g., suspected active site residues) or that the study protein, the type of assay performed, and the form of the results (Table 1; supplementary material at http:// provided assay results only for a highly nonrandom subset
of variants (e.g., variants that gained some crucial activity). www.genetics.org/supplemental/). Results from differ-ent studies are not directly comparable: a value of⫹ The studies selected for analysis, listed in Table 1 by
target protein, comprise 12 different target proteins, might mean “phage growth” in one study, and “drug resistance” in another study; a value of 0.4 might mean 1266 altered sites, and 9671 individual exchanges. The
exchanges are tabulated by source and destination ⌬⌬Gof 0.4 in one study and an activity of 40% of wild type in another study.
amino acid in Table 2. No data are available for the
doublet exchangesY→ T,Y→ I, and Y →V nor for A method for combining such data would seem to require: (i) a precise physical model relating protein the triplet exchanges W → N, W → D, and W → I.
For the remaining exchanges, the mean numbers of thermodynamics and chemistry to assays of enzymologi-cal or biologienzymologi-cal activity, (ii) an arbitrary resenzymologi-caling of instances are 32.4 (range, 1–80) for singlets, 22.6 (range,
1–86) for doublets, and 12.4 (range, 1–32) for triplets. diverse results (e.g., each result converted to 0 or 1) on the assumption that arbitrary biases will cancel out given The exchanges were engineered using three different
methods: nonsense suppression (Miller1991), that is, sufficient data, or (iii) a heuristic model that relates the results of different studies through some common the introduction of a nonsense mutation at a site,
fol-lowed by expression using a nonsense-suppressor tRNA parameter(s). The first approach is not possible, and the assumptions of the second approach are not justi-that inserts some amino acid; cassette-based saturation
mutagenesis (Reidhaar-Olson et al. 1991), resulting fied, given the relatively small number of studies. The possibility of a heuristic approach based on a in a set of randomly generated codons at some position;
and site-directed mutagenesis, resulting in a specific al- common severity-of-effect distribution can be illustrated by reference to the barnase study ofAxe et al.(1998), ternative at some position, as in alanine-scanning
stud-ies. For each of these 12 studies, the supplementary mate- the T4 lysozyme study ofRennellet al.(1991), and the
-lactamase study of Materon and Palzkill (2001) rial at http://www.genetics.org/supplemental/ describes
the experimental design (the method for generating (see Table 1). In each case, a large number of variants were produced and assayed to yield a⫹or⫺outcome and assaying variants) and the form of the results, which
may be continuous values (e.g., percentage of wild-type relative to an arbitrary threshold level of activity. How-ever, the studies differ dramatically in their outcomes: activity) or ordinal values (i.e., ranked categories, such
Figure1.—Assigning activity scores to categories based on a frequency distribution. (a) A hypothetical distribution of variants, with 47% in the “minus” class and the remainder in the “plus” class. (b) The fit of this classification to a known quency distribution of effects on activity. For any given fre-quency distribution, there is a unique valueTthat divides the density into a minus class of 47% and a plus class with the remainder. Then, for this frequency distribution, variants in
each class can be assigned a unique mean activity value (e.g., Figure2.—Empirical severity-of-effect distribution. The ob-Aminusfor variants in the minus category). This approach gener- served frequency of amino acid exchange variantsp
Tthat fall alizes to any number of ranked categories. below some threshold of activityTis shown as a function of the threshold, on a double-log scale. Data on this relationship are available from seven studies (for details, see supplementary in the lysozyme case, 20%; and in the-lactamase case, materials at http://www.genetics.org/supplemental/): the 93%. This might be due to inherent differences between lysozyme (pink dot), barnase (black dot), and -lactamase (yellow dot) studies each contribute a single point; two points barnase, lysozyme, and-lactamase. However, in the
bar-are available from the interleukin-3 study (brown dots); three nase case, the experimenters define inactive as having
points from the LacI study (gray dots); and the observed
⬍ⵑ0.2% of the wild-type protein activity (
Mossakow-discretized frequency distribution is available for 37 insulin ska et al. 1989;Axe et al. 1998); in the lysozyme case, variants (blue dots) and 366 HIV-RT variants (orange dots). the threshold is 3% activity (Rennellet al.1991); and The sizes of dots represent weights assigned to each point for purposes of regression. The dashed line is the best fit (residual in the-lactamase case, the threshold isⵑ50% activity
sum-of-squares, 0.13) to a cumulative frequency distribution (T.Palzkill, personal communication). Thus, the higher
based on the power law (Equation 1). the threshold is, the fewer the variants are that surpass
it, suggesting an underlying distribution of effects on activity that applies across studies. To the extent that
such a common distribution applies, it can serve as the exponential) showed a worse empirical fit. This com-mon severity-of-effect distribution may be used as the basis for a method to assign scores on a common scale, as
illustrated in Figure 1 (seematerials and methods). basis for transforming results of any experimental study to a common scale, nominally a scale of activity. Available data on the distribution of activity effects
are plotted in Figure 2. A total of eight threshold values EX:The “experimental exchangeability from itoj,” or EXij, is the mean activity of variants with an exchange are available from five studies. For two additional studies
(insulin and HIV-RT), activity values for all variants are from amino acidito amino acidj. For instance, Table 2 indicates that data on 34T→Eexchanges are available, reported, providing a finely discretized distribution. As
described inmaterials and methods, these data may and thus EXT,E will be the average of 34 values, each representing the fraction of wild-type activity in the vari-be used to estimate the shape of a common frequency
distribution, on the assumption that such a distribution ant protein, including both experimentally determined values (e.g., for variants of HIV-RTase) and estimates exists. This assumption is borne out by the close
empiri-cal fit to a power law (specifiempiri-cally,y⫽0.91x0.374), theR2 assigned using Equation 3 (materials and methods). Individual EX values have considerable uncertainty. The value for which is 0.78 (residual sum-of-squares, 0.19).
On the basis of this result, the data were then fit to mean standard deviation of individual EX values, com-puted by bootstrap resampling (results not shown), is Equation 1, a function that is based on the power law,
but that has the properties of a cumulative frequency 0.071 for resampling among studies and 0.056 for re-sampling among individual exchanges.
distribution (seematerials and methods). The curved
line in Figure 2 shows the best fit to Equation 1 (a ⫽ By taking advantage of available structure data (see
materials and methodsand supplementary material
0.278, b ⫽ 0.666), with a residual sum-of-squares of
TABLE 3
Exchangeability (⫻1000) by source (row) and destination (column)
C S T P A G N D E Q H R K M I L V F Y W EXsrc
C . 258 121 201 334 288 109 109 270 383 258 306 252 169 109 347 89 349 349 139 280 S 373 . 481 249 490 418 390 314 343 352 353 363 275 321 270 295 358 334 294 160 351 T 325 408 . 164 402 332 240 190 212 308 246 299 256 152 198 271 362 273 260 66 287 P 345 392 286 . 454 404 352 254 346 384 369 254 231 257 204 258 421 339 298 305 335 A 393 384 312 243 . 387 430 193 275 320 301 295 225 549 245 313 319 305 286 165 312 G 267 304 187 140 369 . 210 188 206 272 235 178 219 197 110 193 208 168 188 173 228 N 234 355 329 275 400 391 . 208 257 298 248 252 183 236 184 233 233 210 251 120 272 D 285 275 245 220 293 264 201 . 344 263 298 252 208 245 299 236 175 233 227 103 258 E 332 355 292 216 520 407 258 533 . 341 380 279 323 219 450 321 351 342 348 145 363 Q 383 443 361 212 499 406 338 68 439 . 396 366 354 504 467 391 603 383 361 159 386 H 331 365 205 220 462 370 225 141 319 301 . 275 332 315 205 364 255 328 260 72 303 R 225 270 199 145 459 251 67 124 250 288 263 . 306 68 139 242 189 213 272 63 259 K 331 376 476 252 600 492 457 465 272 441 362 440 . 414 491 301 487 360 343 218 409 M 347 353 261 85 357 218 544 392 287 394 278 112 135 . 612 513 354 330 308 633 307 I 362 196 193 145 326 160 172 27 197 191 221 124 121 279 . 417 494 331 323 73 252 L 366 212 165 146 343 201 162 112 199 250 288 185 171 367 301 . 275 336 295 152 248 V 382 326 398 201 389 269 108 228 192 280 253 190 197 562 537 333 . 207 209 286 277 F 176 152 257 112 236 94 136 90 62 216 237 122 85 255 181 296 291 . 332 232 193 Y 142 173 . 194 402 357 129 87 176 369 197 340 171 392 . 362 . 360 . 303 258 W 137 92 17 66 63 162 . . 65 61 239 103 54 110 . 177 110 364 281 . 142
EXdest 315 311 293 192 411 321 258 225 262 305 290 255 225 314 293 307 305 294 279 172 291 Italic and underlined values are one standard deviation above and below (respectively) the mean, where means and deviations are computed separately for EX , EXsrc(exchangeability as source), and EXdest(exchangeability as destination).
protein sites into surface sites or buried sites, so that and no values forY→T,Y→I,Y→V,W→N,W→ D, andW→Iexchanges, due to the lack of data noted exchangeability can be computed separately for each
class of sites. The resulting pair of matrices, not pre- earlier (Table 2). If needed, the missing values may be interpolated by averaging the exchangeability-as-source sented here, provides a means to correct for statistical
error in sampling surface and buried sites for each of the source amino acid, and the exchangeability-as-destination of the destination amino acid. A symmet-amino acid. The corrected “context-averaged”
exchange-ability value is the weighted average of the surface and ric exchangeability matrix can be computed with EXSij⫽ EXSjidefined as the average of EXijand EXji, with each buried exchangeability, where the weights for a specific
exchange are based on the background frequency with value weighted by the number of underlying observa-tions in Table 2. The missing values are irrelevant to which the source amino acid is found in each context
(seematerials and methods). The corrected values the tests of power below because: (i) the cross-validation obviously includes no observations of these types, since are very similar to the uncorrected values, performing
only slightly better in the tests described below. Hence- none are present in the original data set; and (ii) the other tests use only the values for singlet exchanges, forth, the context-averaged exchangeability is treated
as the definitive version of experimental exchangeability whereas the six missing paths are doublet and triplet exchanges. The symmetric matrix EXSijhas no missing and is referred to simply as EX.
The values of EX (context averaged, as just noted) values because exchange data are available for every possible unordered pair of amino acids.
are given to three decimal places in Table 3, with source
amino acids by row and destination amino acids by col- Comparative evaluation of amino acid similarity mea-sures:Applying the heuristic procedure described above umn. The mean exchangeability-as-source is given for
each amino acid in the last column of Table 3, with the to available data on experimental exchanges yields an EX matrix that must reflect, to some unknown degree, mean exchangeability-as-destination in the last row. The
grand mean of exchangeability is 0.29. Alanine is the the average effects of exchanging one amino acid for another. However, it remains to be demonstrated how best replacement for other residues, with an
exchange-ability-as-destination of 0.41. The amino acid that is the well this procedure captures useful information about the “exchangeability” of amino acids or even if such a most readily replaced is Lysine, with EXsrc ⫽ 0.41,
though its exchangeability-as-destination is notably concept is valid. To address such questions there is nei-ther a convenient existing benchmark nor a precise and poor, 0.23.
grounds, one expects that greater exchangeability should study (9671 experimental exchanges) may be used as targets for prediction. Circularity in the use of EX is correlate with greater similarity in crucial
physicochemi-cal properties such as volume and hydrophobicity, and avoided by using, for each target proteinT, the indepen-dent predictor EX⫺T (see materials and methods). indeed this correlation is observed for EX and various
other measures (not shown). Yet, this relationship can- Table 4 shows the results of this test, using logistic regres-sions for studies with ordinal results (e.g., ⫺, ⫹) and not be used to distinguish among such measures,
be-cause the prior expectation establishes only the polarity linear regressions for studies with continuous-valued re-sults (e.g., percentage of activity). Given that the number of the correlation, not its exact form.
Thus, the task of evaluating a measure of amino acid ex- of tests is on the order of 100 (12 target studies multi-plied by eight types of predictors), a probability⬍5⫻ changeability presents a challenge for which new methods
are required. To confront this challenge, three distinct 10⫺4 is marginally significant when considering a re-sult chosenex posteriori, and a probability⬍10⫺6is highly tests, each based on an independent source of data, have
been developed and applied to EX and a set of measures significant.
Overall predictive power reflected inR2values is low, chosen for purposes of comparison. The logic of each
test is that, to the extent that predictable statistical regu- presumably due to crucial context effects not included in the model (i.e., every site has a specific context in a larities associated with effects of amino acid changes in
proteins are captured by the procedure used here for protein that is not addressed), such that the best pre-dictor explains only 2.6–16.4% of variance in effects of deriving an EX matrix, the resulting EX matrix should
be a statistically significant predictor of patterns involv- individual substitutions. Systematic differences in pre-dictability of target studies are explained predominantly ing amino acid changes in proteins. To reduce the
num-ber of statistical tests, rather than including all known by the power of the study (Table 4), defined as the number of assayed variants multiplied by the mean in-matrices of similarity or distance, we define five
catego-ries of measures other than EX (which is in its own formation content of an assay result. For instance, con-sidering the best predictor, study power accounts for category as an empirical measure of pure
exchangeabil-ity) and choose a prominent example from each: 82% of the between-target-study variance in predictabil-ity [i.e.,R2⫽0.82 for the regression of⫺log(probability) 1. Theoretical models of amino acid exchangeability in
on study power]. proteins. The M J matrix ofMiyazawaandJernigan
EX⫺Tis the best predictor in the combined test, while (1993) is used.
BLOSUM100 (BLO100), the best of the five BLOSUM 2. Empirical models of evolutionary transition
probabil-levels tested (30, 45, 62, 80, and 100), has a larger num-ities. The WAG matrix (WhelanandGoldman2001)
ber of first-place and second-place results in the separate provides maximum-likelihood estimates of transition
tests (Table 4). In general, the order of effectiveness of probabilities for a Markov model of evolutionary amino
predictors is {EX⫺T, BLO100} ⬎ {VB, XX, Miyata, acid replacement.
WAG}⬎Grantham. The symmetric matrix, EXS⫺T, per-3. Physicochemical parameterizations of evolutionary
forms better than the intermediate predictors but worse transition probabilities. The so-called “biochemical
dis-than EX⫺Tand BLO100. In such comparative tests, the tance” measures ofGrantham(1974) andMiyata
predictive power of EX⫺Tis aided by its asymmetry and et al.(1979) are widely used.
by the availability of statistical weights (the counts in 4. Sequence alignment match-score matrices. Matrices
Table 2). By contrast, all the other measures are symmet-that supply match scores for alignment algorithms
ric and without weights. Of these two aspects, asymmetry are the most familiar type of amino acid similarity
mea-is important, as indicated above by the reduced perfor-sure. Formally, theSi jvalues of such a matrix are odds
mance of EXS⫺T, while weighting has relatively little ratios of true juxtaposition to false juxtaposition of
effect (results not shown). residuesiandj(Altschul1991). The BLOSUM series
Correlation with disease-causing potential of human
mis-of matrices based on conserved sequence blocks is
sense mutants:The analysis of deleterious human variants widely used in homology searches and performs
bet-is a problem for which an asymmetric measure of ex-ter than other measures in systematic tests (Henikoff
changeability would be useful, since typically one can andHenikoff 1992).
distinguish which allele is the ancestral wild-type allele 5. Miscellaneous heuristic measures. The VB matrix (
Ven-and which is the mutant. The nearly 19,000 entries for
katarajanandBraun2001) is derived from
multi-missense mutants in HGMD (Stensonet al.2003) can dimensional scaling of a diverse set of 237 diverse
be categorized on the basis of the source (wild-type) amino acid properties. The XX matrix (XiaandXie
amino acid and the destination (mutant) amino acid. 2002) is based on observed neighbor frequencies of
In principle, as long as the probability of sampling re-amino acids in protein sequences and represents a
mains low (both in regard to individuals bearing a par-distinctive new approach.
ticular haplotype and in regard to haplotypes within a particular amino acid exchange category), the number
Prediction of effects of experimental amino acid exchanges:
TABLE 4
Comparative evaluation: prediction of experimental exchange effects
R2and probability (in parentheses) for prediction with each target studya Study (typeb) Power EX
⫺T EXS⫺T BLO100 VB XX Miyata WAG M J Grantham
LacI (r) 6241.5 0.030 0.020 0.016 0.018 0.013 0.012 0.011 0.008 0.0005
(1.0E-63) (2.6E-40) (1.3E-31) (5.0E-35) (8.0E-27) (1.3E-24) (1.0E-22) (4.0E-16) (3.2E-01)
T4 lysozyme (r) 2736.9 0.049 0.048 0.020 0.016 0.017 0.011 0.016 0.013 0.008
(2.0E-42) (5.4E-37) (3.0E-18) (7.0E-15) (6.0E-16) (1.5E-10) (3.0E-15) (3.4E-12) (2.6E-08)
IL-3 (r) 1013.7 0.040 0.040 0.026 0.027 0.029 0.023 0.013 0.023 0.021
(1.5E-11) (1.5E-12) (1.1E-09) (8.0E-10) (2.0E-10) (1.7E-08) (3.0E-04) (1.4E-08) (4.6E-08)
HIVProt (r) 505.4 0.098 0.071 0.104 0.096 0.050 0.060 0.095 0.039 0.0522
(1.0E-15) (2.0E-13) (1.7E-17) (2.0E-16) (3.0E-09) (8.0E-11) (3.6E-16) (1.4E-07) (1.5E-09)
RecA (r) 463 0.016 0.007 0.019 0.011 0.0147 0.024 0.009 0.000 0.0096
(9.0E-03) (8.7E-02) (5.0E-04) (7.0E-03) (2.0E-03) (8.0E-05) (1.4E-02) (7.0E-01) (9.1E-01)
-Lac (r) 191.8 0.009 0.008 0.023 0.011 0.012 0.013 0.012 0.050 0.019
(1.6E-01) (1.8E-01) (1.4E-02) (1.0E-01) (7.0E-02) (6.1E-02) (8.0E-02) (3.0E-04) (2.4E-02)
Barnase (r) 190.2 0.047 0.060 0.053 0.050 0.045 0.031 0.038 0.012 0.022
(6.0E-04) (2.0E-05) (2.0E-04) (3.0E-04) (6.0E-04) (5.0E-03) (1.5E-03) (7.8E-02) (1.7E-02)
RTase (c) 2170.1 0.163 0.165 0.164 0.099 0.072 0.110 0.150 0.024 0.091
(1.0E-15) (1.0E-12) (7.0E-16) (9.9E-02) (2.0E-07) (8.0E-11) (3.0E-15) (3.0E-04) (4.3E-09)
f1 pV (c) 992.6 0.081 0.064 0.105 0.063 0.040 0.039 0.092 0.024 0.044
(3.0E-07) (6.5E-06) (4.1E-09) (6.3E-02) (4.0E-04) (5.0E-04) (4.1E-08) (6.0E-03) (2.0E-04)
Nuclease (c) 1650 0.129 0.140 0.112 0.029 0.024 0.042 0.021 0.082 0.019
(3.0E-10) (5.0E-11) (5.5E-09) (3.4E-03) (8.3E-02) (4.0E-04) (1.4E-02) (6.8E-07) (1.8E-02)
hGH (c) 254.7 0.017 0.001 0.015 0.010 0.034 0.018 0.013 0.062 0.016
(3.6E-01) (8.0E-01) (3.9E-01) (4.9E-01) (2.0E-01) (3.6E-01) (4.3E-01) (8.2E-02) (3.9E-01)
Insulin (c) 184.8 0.026 0.045 0.087 0.002 0.038 0.036 0.079 0.061 0.006
(3.4E-01) (2.1E-01) (7.7E-02) (7.8E-01) (2.5E-01) (2.6E-01) (9.2E-02) (1.4E-01) (6.5E-01)
All 0.0373 0.029 0.03631 0.02631 0.02458 0.02289 0.02204 0.01698 0.00918 (8.0E-82) (2.0E-63) (1.0E-79) (5.0E-58) (3.0E-54) (1.0E-50) (9.0E-49) (7.0E-38) (3.6E-21) aItalic and underlined values indicate the best and next-best (respectively) predictors byR2for each target study. EXS is not included in the rankings because it is redundant with EX.
bDepending on whether the data are ordinal (r) or continuous (c), predictions use logistic or linear regression, respectively.
is an estimator of the total frequency of occurrence of the acceptability of the mutant alleles (i.e., due to their mean effects on survival and reproduction).
disease-causing variants of that category, modulated by
a likelihood of clinical characterization. However, the Conveniently, the latter three factors are subsumed in the corresponding category frequencies from HGVBase relative chance of clinical characterization of a point
mutation in a protein-coding region is based solely on (Fredmanet al.2002), a database of human single-nucleo-tide polymorphisms (SNPs). To the extent that confound-the disease-causing propensity and confound-the population
fre-quency and not on experimental detectability, given ing cross-factor effects can be ignored, then, dividing the number (or frequency) of HGMD entries by the that all types of missense mutations are equally
detect-able by the standard experimental procedure of DNA se- number of HGVBase entries for the same type of mis-sense change would cancel out extraneous effects of co-quencing. The population frequency, in turn, is a
in which the differences arise. That is, when the first exchange fromitojtakes place in one of two initially identical proteins, the resulting difference occurs in an identical context, and thus the pairing ofiandjin the aligned sequences is a more accurate indication of the exchangeability ofi andjthan the same pairing of resi-dues in proteins that have diverged so that they are only 30% identical. Indeed, we find that, for singlet and doub-let exchanges, the slope of the correlation of BLOSUM scores on EXS values is steepest for BLOSUM100 and becomes flatter with decreasing BLOSUM level (results not shown). This observation is not necessarily in con-flict with the results ofBenneret al.(1994), who argue [from a discrepancy that arises in extrapolating the per-cent accepted mutation (PAM) model] that the effect of minimal mutation distance on the pattern of divergence decreases as proteins diverge. The effect of minimum
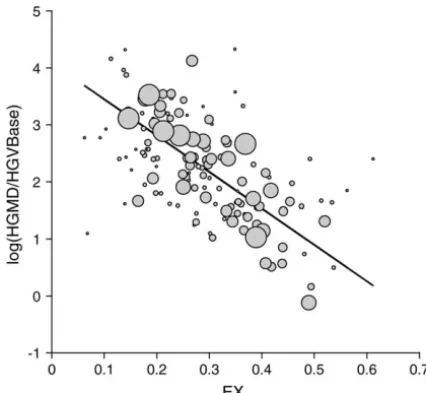
Figure3.—Relationship of disease-causing potential to EX. mutational distance also diminishes with the BLOSUM The vertical scale is the log of the disease-causing potential, level (i.e., the mean BLOSUM scores for singlets, dou-defined as the ratio of the number of HGMD (Krawczakand blets, and triplets become less extreme).
Cooper1997) entries for a given missense class, to the number
Use as a model of acceptance of missense changes in evolution: of HGVBase (Fredmanet al.2002) entries for the same class.
While the above results demonstrate that EX performs For reasons explained in the text, this ratio is expected to
reflect disease-causing potential and to be free of confounding well in predicting the effects of a random sample of ex-effects of mutation. The solid line shows the weighted least- changes (the experimental data) or a sample enriched squares regression,y⫽4.08⫺6.38x, with weights based on for damaging exchanges (the disease-associated variants), Table 2 (weight of each point is reflected by its size). EX
ex-one might argue that a more subtle measure is needed plains 49% of the variance in the log HGMD/HGVBase ratio,
for modeling evolutionary change, to the extent that more than any other measure tested. Given the observed
re-gression, one way to describe how HGMD is enriched (relative (presumably) it is a sample enriched for benign or in-to HGVBase) in low-exchangeability variants is in-to note that nocuous exchanges. The problem of compensating for the bottom one-third of the distribution of EX values is en- mutational effects in evolution is addressed by the phylo-riched 2.4-fold relative to the overall sample andⵑ9-fold
rela-genetic analysis by maximum likelihood (PAML) soft-tive to the top one-third.
ware of Yang (1997) for numerical analysis of maxi-mum likelihood models. The basis for this approach is as follows. Molecular evolution is often characterized as an origin-fixation process with a steady-state rate equal method for deriving EX captures useful information on
effects of amino acid changes in proteins, EX should to the product of the rate of introduction of new mu-tants, N, and their probability of fixation, : in the correlate negatively with the HGMD/HGVBase ratio.
Note that this test scrutinizes only singlet exchanges, simplest case, for neutral variants, ⫽1/N, while for significantly beneficial mutants,⬇ 2s, wheres is the given that SNP data, by definition, are single-nucleotide
polymorphisms. coefficient of selection (Kimura1983). Thus,Goldman
andYang(1994; see alsoMuseandGaut1994) intro-In general, measures of amino acid similarity or
dis-tance show a better linear fit to the log of the disease- duced a “mechanistic” model of codon change with sep-arate factors for mutation and acceptance. The muta-causing potential than to the untransformed value.
Figure 3 shows the regression for the best predictor, EX, tional factor is modeled using a nucleotide substitution mutation model applied to codons. The acceptance fac-which explains half of the variance in the log(HGMD/
HGVBase) ratio. The values ofR2for the various predic- tor for different types of missense mutations is modeled using a linear or geometric transformation (with two fitted tors are: EX, 0.494 (EXS, 0.499); BLOSUM100, 0.475;
WAG, 0.368; Grantham, 0.352; Miyata, 0.330; XX, 0.325; parameters) of a user-supplied, symmetric measure of amino acid distance.Yanget al.(1998) tested five sym-VB, 0.299; and M J , 0.076.
As for the previous test using experimental exchanges, metric measures of amino acid distance: differences in polarity, volume, and composition; Grantham’s distances the higher levels of the BLOSUM series of matrices
per-formed better; e.g.,R2 for BLOSUM62 was 0.444, and (Grantham1974); and Miyata’s distances (Miyataet al. 1979).
for BLOSUM30 it was 0.309 (the BLOSUM level is the
upper limit of sequence identity among pairs of se- Here, to evaluate various measures, a likelihood analy-sis was carried out using PAML with the original data quences used to compute the matrix). A potential
expla-nation is that closely related proteins should more accu- set of Yang et al. (1998) and with 10 additional data sets fromQiuet al.(2004), as described inmaterials
TABLE 5
Comparative evaluation: PAML acceptance function
Log-likelihood of observed family data given an acceptance function based on the predictor at lefta
Actin AdhII AdhI Aldh CuZnSOD EF1Alpha GAPDH HSP70 MnFeSOD TPI mtCDNA Total
BLO100 ⫺49,185 ⫺25,526 ⫺25,721 ⫺45,735 ⫺8,293 ⫺24,745 ⫺16,231 ⫺57,489 ⫺11,187 ⫺8,482 ⫺29,835 ⫺302,429
EXS ⫺49,116 ⫺25,653 ⫺25,879 ⫺45,952 ⫺8,328 ⫺24,675 ⫺16,261 ⫺57,641 ⫺11,069 ⫺8,480 ⫺29,881 ⫺302,937
VB ⫺49,350 ⫺25,618 ⫺25,818 ⫺45,900 ⫺8,353 ⫺24,857 ⫺16,297 ⫺57,711 ⫺11,222 ⫺8465 ⫺29,869 ⫺303,458 Miyata ⫺49,358 ⫺25,643 ⫺25,864 ⫺46,086 ⫺8,401 ⫺24,770 ⫺16,321 ⫺57,790 ⫺11,199 ⫺8,508 ⫺29,890 ⫺303,829 WAG ⫺49,400 ⫺25,654 ⫺25,872 ⫺46,020 ⫺8,358 ⫺24,868 ⫺16,285 ⫺57,708 ⫺11,248 ⫺8,528 ⫺29,887 ⫺303,830 XX ⫺49,259 ⫺25,656 ⫺25,926 ⫺46,087 ⫺8,387 ⫺24,792 ⫺16,345 ⫺57,866 ⫺11,188 ⫺8,500 ⫺29,867 ⫺303,872 Grantham ⫺49,578 ⫺25,720 ⫺25,931 ⫺46,285 ⫺8,410 ⫺24,915 ⫺16,398 ⫺57,971 ⫺11,226 ⫺8,538 ⫺29,912 ⫺304,883 MJ ⫺49,561 ⫺25,785 ⫺26,062 ⫺46,423 ⫺8,481 ⫺24,896 ⫺16,332 ⫺57,998 ⫺11,242 ⫺8,517 ⫺29,907 ⫺305,204
aItalic values, best predictor for this gene family (column); underlined values, next-best predictor.
and methods. Measures of similarity, such as EXS or (Table 5). On the basis of the results of these tests, EX BLOSUM, are converted into the required form of adis- is recommended as the only measure of the mean effects
tancemeasure by subtracting each value from the maxi- of amino acid exchanges that performs well and that mum. The likelihood score that results from an analysis is known to avoid potentially confounding effects of can be used to evaluate the performance of a distance mutation.
measure in comparison to other measures (all tests have The concept of a pure measure of exchangeability is the same number of parameters). As with the previous largely novel, as is the method of deriving EX, and this test involving disease-causing variants, this test evalu- novelty raises a number of questions. How does the ates power only with respect to singlet exchanges, be- severity-of-effect model provide a basis for combining cause these are the only kind used in the Goldman- results from different studies? What are the most likely
Yang model. sources of bias and error in this approach? How could
The results of this comparative analysis are shown in EX be improved with new data or methods? What, ex-Table 5. For each of the 11 data sets, log(likelihood) values actly, does EX represent, and how does it relate to con-are shown for the geometric transformation only, which cepts such as evolutionary acceptability or “functional” (as inYanget al.1998) generally yields higher likelihoods effect or to measures such as PAM? How can exchange-than the linear transformation. The best measure for use ability be applied to scientific questions or technical as an acceptance function is BLOSUM100, which outper- challenges?
forms the second-best measure, EXS, in terms of both The concept of amino acid exchangeability:Most of the sum of log(likelihood) values and the number of first- the questions listed in the previous paragraph relate to and second-place results. The order of performance is the general issue of what it means to seek out average BLO100⬎EXS⬎{VB, Miyata, WAG, Grantham}⬎MJ. tendencies among heterogeneous sets of data. The ca-pacity of EX to represent average tendencies useful for any given purpose depends on three types of factors. DISCUSSION First, EX is derived from individual assay results that reflect experimental biases and uncertainties, and thus A measure of the exchangeability of amino acids has
the accuracy of EX depends on the strength of such been computed from results of 9671 exchanges in 12
effects. Second, EX is a measure of mean effect averaged proteins, based on a set of experimental studies chosen
over diverse contexts (diverse sites in different proteins to avoid systematic biases in the assessment of exchange
operating under differing conditions in different assays), effects (Tables 1 and 2). In this set of studies, the
rela-and thus the accuracy of EX depends on the strength tionship observed between frequency and severity of
of these context-dependent effects (relative to intrinsic effect suggests a common distribution that provides a
effects) and how well the distribution of contexts has basis for combining results from different studies
(Fig-been sampled. The procedure used here compensates ures 1 and 2) to yield a measure of mean effect, called
only for the differing severity of assays (via the frequency-EX (Table 3). This measure has been evaluated, in
com-activity regression, Figure 2) and for sampling error in parison to a sample of other types of measures, by a
regard to the distribution of amino acids among surface statistical cross-validation using the data on
experimen-and buried sites. Third, EX is a measure of effects fo-tal exchanges (Table 4), by measuring its correlation
cused mainly on protein activity and stability as mea-with the disease-causing potential of human missense
sured with biochemical or growth assays in the labora-mutants (Figure 3), and by testing its ability to serve as
of amino acid exchange (e.g., in natural variation and of stability. However, at the low end of the scale of⌬⌬G, there are a few exchanges that actually increase stability evolution) depends on the extent to which these effects,
as opposed to others (e.g., metabolic cost of amino acids), (decrease⌬G), and one would not necessarily assume that such exchanges increase activity—the increased sta-are important.
In principle, such sources of variance could prove so bility might make for a too-rigid protein unable to bind a substrate or release a product. An analogous interpre-overwhelming that it would be pointless to pursue a
gen-eral measure of exchangeability. In practice, this is not tation could be applied to the problem of assigning scores to human growth hormone variants on the basis the case. The results presented here demonstrate
con-clusively that there is a general phenomenon of ex- of a ranking of Kd values. To clarify this issue would require systematic data (not currently available, to our changeability in the sense of predictable statistical
regu-larities seen across various types of data involving amino knowledge) in which a large set of variants is subjected both to assays for effects on biological activity and to acid exchanges (or differences) from a diverse array of
proteins and organisms. The three data sets used to evalu- effects on kinetic parameters or thermostability. Future prospects for a measure of exchangeability: ate EX and other measures are from three independent
sources and correspond to random exchanges (experimen- Many have expressed surprise that EX performs better than other measures tested, given that its derivation tal data), relatively damaging exchanges (HGMD data),
and relatively benign exchanges (evolution). Yet, most reflects the results of relatively crude laboratory experi-ments with a small set of proteins that may not be repre-predictors are significant in most tests, and the ranking
of predictors shows considerable regularity between tests sentative of proteins in general. Clearly, individual EX values are highly imprecise relative to other measures, (e.g., EX and BLO are the best, and Grantham and MJ
are among the worst). Among other things, this indi- with relative standard deviations of 20–25%, on average. A major reason for this imprecision is that an individual cates that various sources of data could be used in
deriv-ing a measure of exchangeability, not just data from EX value is based on an average of only 25 exchanges. The exchanges typically are assigned a highly discretized experimental genetics. The unique value of the latter
data is that, if one wishes to disentangle mutational and (thus imprecise) score, and the assignment itself may have considerable individual uncertainty.
selective effects in evolution, experimental exchanges
provide independent data on amino acid exchange ef- However, though imprecise, EX values are focused on protein exchangeability per se, a concept that has fects with no obvious risk of confounding mutational
effects. not received much attention. Of the other measures
tested, only MJ is derivationally a pure measure of pro-The common severity-of-effect distribution:The
suc-cess of the method of assigning activity scores from the tein-level effects. While other measures sometimes are used as if they were pure measures of operational ex-regression in Figure 2 would seem to depend on the
extent to which two principles apply: (i) regardless of changeability (e.g.,Terwilliger1995;Wenet al.1996;
Li1997;Krawczaket al.1998;Yanget al.1998;Graur
the nature of the protein, the frequency distribution of
activity effects in a random or arbitrary set of amino andL i2000;AlexandreandZhulin2003;Pupkoet al.
2003), they are not. acid exchanges is the same, and (ii) regardless of how
exchanges are assayed, the rank order of the mean sever- Thus, what EX lacks in precision and reliability, it makes up for in accuracy, because it is focused specifi-ity-of-effect for all 380 source-destination pairs will be
the same (e.g., whether the assay is for biological activity, cally on the operational exchangeability of amino acids in proteins, as opposed to being focused on something biochemical activity,⌬⌬G, orKd).
Presumably neither principle is perfectly applicable, else. Precisely because of this combination of high accu-racy with low precision and reliability, there is every but applies only roughly. The first principle is supported
by the strength of the regression shown in Figure 2. reason to believe that EX can be improved simply by gathering more and better data. If future experimental With respect to the second principle, one may consider
the case of integrating the staphylococcal nuclease stud- studies can be designed so that measured exchange effects have high information content, and exchanges ies (Shortleet al.1990;Greenet al.1992;Meekeret al.
1996) in which⌬⌬Gvalues (rather than activity effects) are distributed equally among the most practically rele-vant class—the singlet exchanges—a mere twofold addi-are measured for protein variants. To assign scores to
exchanges in this study, the⌬⌬Gvalues are ranked from tion to the amount of data (another 19,000 variants) would ensure⬎100 variants of each singlet type, which highest to lowest, and this is treated as a rank order of
severity of effect, going from what are presumed to be would yield a considerably more powerful measure. With modern high-throughput methods, producing such data the most disruptive effects (highest⌬⌬G, greatest loss
of stability) to the least disruptive or most benign. The could be much faster and cheaper than it was in the past. implicit expectation is that if staphylococcal nuclease
variants were assayed for activity rather than for
thermo-SUPPLEMENTARY DATA stability, the rankings would tend to correspond, with