©
DOI: 10.1534/genetics.104.033456
DNA Sequence Polymorphism and Divergence at the
erect wing
and
suppressor
of sable
Loci of
Drosophila melanogaster
and
D. simulans
John M. Braverman,*
,†,‡,1Brian P. Lazzaro,
§,‡Montserrat Aguade´
†and Charles H. Langley
‡*Department of Biology, Georgetown University, Washington, DC 20057-1229,§Department of Entomology, Cornell University,
Ithaca, New York 14853,†Departament de Gene`tica, Facultat de Biologia, Universitat de Barcelona, 08071 Barcelona,
Spain and‡Center for Population Biology and Section of Evolution and Ecology,
University of California, Davis, California 95616 Manuscript received August 2, 2004 Accepted for publication April 5, 2005
ABSTRACT
Several evolutionary models of linked selection (e.g., genetic hitchhiking, background selection, and random environment) predict a reduction in polymorphism relative to divergence in genomic regions where the rate of crossing over per physical distance is restricted. We tested this prediction near the telomere of the Drosophila melanogasterandD. simulans Xchromosome at two loci,erect wing(ewg) andsuppressor of sable[su(s)]. Consistent with this prediction, polymorphism is reduced at both loci, while divergence is normal. The reduction is greater atewg, the more distal of the two regions. Two models can be discriminated by comparing the observed site frequency spectra with those predicted by the models. The hitchhiking model predicts a skew toward rare variants in a sample, while the spectra under the background-selection model are similar to those of the neutral model of molecular evolution. Statistical tests of the fit to the predictions of these models require many sampled alleles and segregating sites. Thus we used SSCP and stratified DNA sequencing to cover a large number of randomly sampled alleles (ⵑ50) from each of three populations. The result is a clear trend toward negative values of Tajima’sD, indicating an excess of rare variants atewg, the more distal of the two loci. One fixed difference among the populations and highFSTvalues indicate strong population subdivision among the three populations atewg. These results indicate genetic hitchhik-ing at ewg, in particular, geographically localized hitchhiking events within Africa. The reduction of polymorphism atsu(s)combined with the excess of high-frequency variants inD. simulansis inconsistent with the hitchhiking and background-selection models.
S
EVERAL evolutionary models of linked selection have a skew is not expected in a practically sized sample of sequences under background selection (Hudson and been proposed to explain the patterns of DNAse-quence variation observed in natural populations. Ge- Kaplan1994;Charlesworthet al. 1995). The pseudo-hitchhiking model also yields reduced polymorphism netic hitchhiking is a model of strong directional
selec-and a skew in the frequency spectrum in regions of tion in which the fixation of favorable variants removes
restricted recombination (Gillespie2000). Finally, ran-linked neutral variation (Maynard SmithandHaigh
dom-environment models involving linked selection can 1974). This hitchhiking effect is expected to be strongest
also produce reduction in polymorphism (relative to in genomic regions where crossing over is restricted per
divergence) and a skew toward rare variants (Gillespie physical distance (Kaplanet al. 1989). The
background-1997). All these models of linked selection predict that selection model also predicts a reduction in
polymor-the effect(s) on selectively neutral polymorphism will phism that is due to what essentially amounts to a
de-be most apparent in regions of the lowest crossing over. crease in effective population size, caused by selection’s
The distal tip of theXchromosome ofDrosophila
mela-removal of linked deleterious mutants (Charlesworth
nogaster(and its close relatives) offers an excellent
op-et al. 1993). Neither model predicts a reduction in
inter-portunity to test models of linked selection, since the specific divergence. A chief difference between the models
rate of crossing over per physical distance decreases is whether a skew toward rare polymorphisms is
ex-to zero at the gene-rich euchromatic region at the pected; the hitchhiking model predicts such a skew
telomere. For example,Aguade´ et al. (1989) found a
(Aguade´et al. 1989;Bravermanet al. 1995), while such
reduction in polymorphism using RFLP in the yellow-achaete-scute (y-ac-sc) region of D. melanogaster. Begun
andAquadro(1991) andMartı´n-Camposet al. (1992)
1Corresponding author:Department of Biology, Georgetown
Univer-studiedy-acusing greater sample sizes from additional sity, 3700 O St. NW, Washington, DC 20057-1229.
E-mail: [email protected] geographic locations and extended the investigation to
the sister speciesD. simulans. All three studies found a One of the goals of the present study is to increase reduction in polymorphism in both species and an ex- the statistical power of the tests for neutrality, such as cess of rare variants. When the site frequency spectrum Tajima’s D, by using large sample sizes. We surveyed was quantified with Tajima’sD(Tajima1989), observed ⵑ50 lines per population to find additional variation, values were negative, indicating a skew toward rare vari- especially rare variations. An additional reason for our ants, although not always significantly so. Divergence generous sample sizes is to make informative compari-data from D. melanogaster andD. simulans permitted a sons among different Drosophila populations. We sam-test of the neutral prediction that polymorphism and pled from three continents, Africa, Europe, and North divergence are correlated; the levels of divergence ob- America.
served were normal, thus ruling out a reduction in the Another goal of this article is to use interspecific diver-neutral mutation rate or the exclusive action of genetic gence to gain insight into the evolutionary forces at drift as an explanation for the data from these regions. work. Thus we surveyed bothD. melanogasterand its sister Hence genetic hitchhiking appeared to explain the data species D. simulans. A normal level of divergence, for from these studies. example, would rule out a low local neutral mutation Additional work on theXtelomere extended the sur- rate and/or mutagenic recombination in regions of nor-veys to samples from Africa (BegunandAquadro1993, mal crossing over. In addition, we can test the generality 1995b). Polymorphism was reduced in the telomeric of the phenomena by comparing data from the same genesyandac. The levels of polymorphism were higher genes experiencing similar but not identical genetic in Africa than on other continents, and population sub- and population conditions in more than one species. division between African and non-African populations Although the rate of crossing over per physical distance was detected. These results supported the theory that is restricted at the telomere of both species, crossing
D. melanogasteroriginated in sub-Saharan Africa and mi- over in D. simulansis thought to increase faster when grated to Europe and North America (DavidandCapy moving away from the tip (Sturtevant et al. 1929). 1988; Lachaise et al.1988). D. simulans is thought to Also, the effective population size may differ between have a similar history. Thus demographic phenomena these two species. The greater heterozygosity, greater and/or local adaptation affect genetic variation in codon bias, and fewer nonsynonymous polymorphisms
D. melanogaster, not unlike what was already known in observed in
D. simulanshas been interpreted as evidence
D. ananassae(StephanandMitchell1992). Yet sample
that D. simulans has a larger population size than sizes were generally limited and Tajima’s D was not
D. melanogaster(Aquadro1992;MoriyamaandPowell statistically different from zero, raising questions about
1996;Irvinet al. 1998). statistical power and the applicability of the hitchhiking
We surveyed two genes located near the telomeres of model.
D. melanogasterandD. simulans. The geneerect wing(ewg) More recent surveys of genes near theXchromosome’s
codes for a transcription factor and is located at polytene telomere consider regions with intermediate levels of
chromosome band position 1A1 (Koushikaet al. 2000; crossing over and larger samples sizes. The studies of
Drysdaleet al. 2005), distal toyellow. In this first region,
Aguade´et al. (1994) andLangleyet al. (2000)
investi-excluding insertion-deletions (indels), we surveyed 3166 gated two loci,suppressor of sable[su(s)] andsuppressor of
bp inD. melanogaster and 3193 bp inD. simulans. The
white apricot[su(wa)], which are (centromere) proximal
genesu(s)encodes an RNA-binding protein and is lo-toy-ac-sc. Crossing over is still reduced at these loci, but
cated at position 1B13 (Geyer et al. 1991; Voelkeret
less so than at y-ac-sc. These authors found that the
al. 1991;Drysdaleet al. 2005). In this second region, hitchhiking model could explain their data, according
excluding indels, we surveyed 2832 bp in D. simulans. to the reduction in polymorphism, and a general trend
The two loci are separated byⵑ360 kb. OurD. simulans
of the skew in the site frequency spectrum toward rare
su(s)data complement a previously published survey of variants, but again Tajima’sDwas not always significantly
thesu(s)region inD. melanogaster(Langleyet al. 2000). negative. In the North American sample, D was large
Our results can be summarized as follows. First, the and positive. Simulation analysis of the data found a
ewgregion has an extreme reduction in polymorphism better fit between that data and the hitchhiking model
and a negative Tajima’s D in bothD. melanogasterand than between that data and the background-selection
D. simulans, which is consistent with the hitchhiking model, but neither model fit well. Further work is needed
model. Second, the pattern of variation across popula-to examine these questions in a genomic region with even
tions ofD. melanogastercould be the result of geographi-lower recombination using the same or similar samples.
cally localized hitchhiking events, similar to what has In such regions of extremely low crossing over, the
im-been found in D. ananassae (Stephan andMitchell pacts of both the hitchhiking and the
background-selec-1992; Stephan et al. 1998;Baines et al. 2004) and in tion models should be greater. The expected further
re-other regions of theD. melanogaster Xtelomere (Begun duction in polymorphism also means fewer segregating
andAquadro1993). Third, variation atsu(s)is reduced
sites per base pair with which to evaluate the frequency
Figure2.—The SSCP fragments ofsu(s).These are similar
Figure 1.—The SSCP fragments of ewg, shown as small but not identical to fragments inLangleyet al. (2000). The horizontal lines below the gene. Only part of the entire gene open box is the 5⬘-UTR. See the Figure 1 legend for more is shown, and it is oriented with the 3⬘-end on the left in information.
contrast to the standard orientation to illustrate the fragment positions relative to the physical location of the su(s) frag-ments. The solid boxes are exons, the shaded boxes are
alter-Data analysis:We reportˆ , the average number of pairwise natively spliced exons, and the thin lines connecting the solid
differences per nucleotide. When direct sequencing revealed boxes are the introns. The scale is indicated with a bar 200
polymorphism undetected by SSCP, the procedures of
Agu-nucleotides long.
ade´et al. (1994) were followed to estimateˆ *, the average number of pairwise differences per nucleotide, which incorpo-rates an estimate of the amount of hidden variation. The 95% hitchhiking model nor the background-selection model confidence intervals associated withˆ andˆ * were calculated can explain results at that gene in that species. by bootstrapping over alleles for 1000 replications. Calcula-tions of the HKA test (Hudsonet al. 1987) and Tajima’sD (Tajima 1989) assumed that sequences within SSCP classes were identical to the sequenced subsample. DnaSP 4.0 (Rozas
MATERIALS AND METHODS
et al. 2003) was used for the HKA test, the calculation ofFST Samples:D. melanogasterflies were obtained from the follow- and the permutation test (Hudson et al. 1992a,b; Hudson ing sites: North America (Raleigh, NC; same collection and 2000),RM(Hudsonand Kaplan1985), and the estimation extraction as forMiyashitaet al. 1993), Europe [14 from the of the number of silent sites (NeiandGojobori1986). Canary Islands, Spain, 17 from Groningen, Holland, and 21 from Gene regions:We annotated ourewgdata from bothD. melano-Requena, Spain; same collection and extraction asMartı´n- gasterandD. simulansaccording to GenBank entry no. AE003417,
Camposet al. 1992 (see their Figure 1)], and Africa (collected which was prepared as part of theD. melanogaster genome in September 1990 in the Sengwa Wildlife Preserve, Zimbabwe; annotation release 3.1 (Celnikeret al. 2002). TheD. melano-same collection asBegunandAquadro1993). The following gaster ewgstudy included introns (2200 bp, excluding polymor-collections ofD. simulans were studied: North America (25 phic indels) and exons (966 bp). Also excluding polymorphic collected in September 1995 from the Noble Apple Orchard, indels, theD. simulanssurvey covered 2252 bp of noncoding Paradise, CA, and 25 collected in July 1995 from the Wolfskill DNA (introns) and 941 bp of exons. The total number of Orchard, Winters, CA, and extracted in 1995 in the laboratory silent sites (noncoding⫹synonymous coding;Neiand Gojo-of M. Aguade´ using the attached-Xstrain kindly provided by bori1986) studied was 2587.16 inD. melanogasterand 2472.16 J. Coyne); Europe (collected in 1993 in Montblanc, Spain, by inD. simulans. ForD. simulans su(s), we followed the GenBank M. Aguade´ and extracted in her laboratory using the attached- entry no. M57889 (D. melanogaster) for our annotation of this Xstrain); and Africa (collected about 1993 in Harare, Zim- gene, and accordingly 2832 noncoding bp were surveyed (ex-babwe, and extracted using the attached-Xstrain in the labora- cluding polymorphic gaps); this includes introns, a 5⬘-untrans-tory of C. H. Langley). We refer to these samples by their lated sequence, and a 5⬘-flanking sequence.
continent of origin.
Computer simulations:First, neutral coalescent simulations The same samples were used for both theewgandsu(s)studies.
(Hudson1990) were used to estimate confidence intervals for The study ofsu(s)inD. melanogasterwas reported byAguade´
Tajima’sD. We also ran these simulations (10,000 iterations) to et al. (1994) for North America and byLangleyet al. (2000)
estimate exactP-values for the observed Tajima’sD’s. Second, for Europe and Africa. Line numbers in the figures in those
the recurrent simulation method ofBravermanet al. (1995) publications are the same as those in supplementary Tables
was used to assess the probability of obtaining the observed S1–S9 at http://www.genetics.org/supplemental/. The
follow-Dvalues (Do) or greater under a model of recurrent, strong ing lines were not represented in all three studies. For the
directional selection at linked sites. That probability is labeled D. melanogastersample from Africa, lines 51, 52, and 53 were
Prob {DⱖDo|H.H.}, where H.H. stands for hitchhiking. Next present only in theewgstudy. For theD. melanogastersample
we followed the logic that background selection can be mod-from Europe, line 46 was absent mod-from thesu(s)study. For the
eled by a neutral coalescent simulation in which the effective D. melanogastersample from North America, line 13 was absent
population size is appropriately reduced (Charlesworth
from theewgstudy while lines 51 and 52 were absent from
1996;Stephanet al. 1998;Langleyet al. 2000). Those simula-thesu(s)study. For theD. simulans study of Europe, line 10
tions were used to calculate either Prob {DⱖDo|N.T. andDo⬎ was absent in thesu(s)study. The sample sizes are presented
0} or Prob {D ⬍ Do|N.T. and Do ⬍ 0}, where N.T. stands in Table 1.
for neutral theory. These simulations are conditioned on the SSCP and sequencing:The single-strand conformation
poly-observed number of segregating sites, and thus population morphism (SSCP) protocol ofAguade´et al. (1994) was used
size is not a factor. to bin sequence fragments (ranging in size from 136 to 345
The hitchhiking simulations require calibration. A rate of bp) into allelic classes. The protocol ofAguade´et al. (1994)
hitchhiking was chosen to produce, on average, the observed was modified in that the fragments were labeled with33P
in-reduction inˆ from a value from a region of normal crossing stead of being silver stained. The locations of the fragments
over. It is important to choose a value matching the population are depicted in Figures 1 and 2. Representative alleles of each
source and the type of sequence (e.g., silent sites). ForD. melano-SSCP class were sequenced to identify underlying nucleotide
gaster, we set the level of normal variation to be 0.023 in Africa polymorphisms. DNA sequencing was carried out on an ABI
were obtained from the DNA sequencing study of vermilion (0.00219vs. 0.00182), although the confidence intervals (BegunandAquadro1995a). overlap for thesu(s)comparison. The same trend
pre-ForD. simulans, we set the normal level of polymorphism to
sents itself forsu(s)of Europe and North America. The be 0.0347 for Africa, 0.0279 for Europe, and 0.0288 for North
opposite trend appears in ewg of Europe and North America. These were calculated from vermilion from
corre-sponding populations (BegunandAquadro1995a;Hamblin America. A simulation analysis was conducted to test andVeuille1999). In some cases, their data were reanalyzed for a difference in the levels of genetic hitchhiking in to obtain estimates ofˆ for silent sites. the two species (seeSimulation analysisbelow), but none
was detected.
Compared to other X-linked loci from regions with RESULTS
normal levels of crossing over, ewg andsu(s)have less variation. For this comparison, Langley et al. (2000)
Polymorphism:The results of the SSCP and
sequenc-ing study ofewgandsu(s)are presented in supplemen- used averages ofˆ values from thewhite andvermilion
regions, studied in the same populations with RFLP tary Tables S1–S9 at http://www.genetics.org/supple
mental/. A total of 34 variable sites were found in the (MiyashitaandLangley1988;BegunandAquadro 1993). The averages for Africa and North America are
ewg region of D. melanogaster. Of these, 15 were indel
polymorphisms of 1–34 bp long. The 17 variable sites 0.007 and 0.004, respectively. These numbers are well above all the values observed in this study. For example, found in D. simulans ewg include 5 indels, each 1 bp
long. TheD. simulans su(s)region was found to have 19 the Africanwhite-vermilionaverageˆ is 21 times greater than the Africanewgaverageˆ .
variable sites, including 7 insertion-deletion
polymor-phisms ranging from 1 to 8 bp. More recent data from DNA sequencing studies are available for such comparisons against genes from Hierarchical DNA sequencing of a subset of the SSCP
fragments identified the variants; the results are pre- X-linked regions of normal levels of crossing over. The
vermilion locus, for example, was studied using DNA sented in part (b) of supplementary Tables S1–S9 at
http://www.genetics.org/supplemental/. In a few cases, sequencing in a number of populations and in both
D. melanogasterandD. simulans (Begun andAquadro sequencing identified variants within SSCP classes. For
D. melanogaster ewg, sequencing found two single-nucleo- 1995a;HamblinandVeuille1999). Their data are an appropriate baseline for comparison because they did tide polymorphisms in one fragment not detected by
SSCP (in the exon of fragment 6 in the sample from not reject the neutral model according to the HKA
(Hudson et al. 1987) and Tajima (Tajima 1989) tests
North America).D. simulans ewghad eight instances (three
different single-nucleotide variants among three frag- for most of the cases. The study ofD. simulans vermilion
byHamblinand Veuille(1999) focused on a region
ments, only within Africa) of hidden variation. In
D. simulans su(s), there were five cases of the same hid- of the gene with the highest level of polymorphism. So its ˆ may not represent average levels in African and den variant in fragment 9 in the African and North
American samples. European populations. For comparison with our North American sample, we use the Begun and Aquadro A statistical analysis of polymorphism found by the
survey of ewg andsu(s)is located in Table 1. The two (1995a)vermiliondata from North Carolina. All of these data were reanalyzed to give values ofˆ for silent sites regions have different levels of polymorphism, with the
values ofˆ andˆ * forewgconsistently lower than those (noncoding and synonymous sites combined).
Comparison of ˆ fromvermilion with ˆ and ˆ *ewg
forsu(s). TheD. melanogaster ewgvariation in the African
sample, for example, was less than one-sixth that for andsu(s)withinD. melanogastershow remarkable reduc-tions in variation. For example, the African sample
(Ta-su(s) (Langley et al. 2000). According to coalescent
simulations, the probability of obtaining the observed ble 1) exhibits a 65-fold reduction in polymorphism at
ewgcompared tovermilion(ˆ *⫽0.00035 atewg vs.ˆ ⫽ number of segregating sites in the African ewg under
the neutral model and no intralocus recombination, 0.0023 for thevermilionsilent sites).D. melanogaster su(s)
polymorphism is also reduced (e.g.,⬎12-fold in the Afri-assuming it has the same value of 3Nasˆ forsu(s), is
⬍0.001 (Hudson1990). InD. simulans,variation atewg can sample; seeLangleyet al. 2000).
In D. simulans, ewg also has much less variation than is less than half that atsu(s). While values differ enough
that the bootstrap 95% confidence intervals do not over- vermilion. We recalculated the statistics for silent sites using the data collected byHamblinandVeuille(1999). The lap in this comparison, theewgandsu(s)regions do not
have significantly different estimates of 3Naccording value ofˆ forvermilionfrom Africa (in Zimbabwe, but a different collection date), for example, is 0.035 for to neutral simulations. The other populations also were
compared with simulations but power was too low to vermilion, butˆ * is only 0.00079 forewg(Table 1). The
su(s)locus has aˆ * of only 0.00219 in the African sam-reveal differences.
Comparing across species, two different trends ple. Again, this is a major decrease in variation (⬎ 40-fold).
emerge (Table 1). Within Africa, the level of
polymor-phism (ˆ and ˆ *) is higher in D. simulans than inD. Divergence: The interspecific divergences between
D. melanogasterand D. simulansat ewgand su(s)for all
TABLE 2 a significant value (⫺1.67; P ⫽ 0.0228), even though a few variants in the African sample have intermediate Divergence atewgandsu(s)
frequencies (e.g., site 29,790; supplementary Table S1 at http://www.genetics.org/supplemental/). Meanwhile, No. of sites No. of Jukes-Cantor
compared differences distance for the same sampled chromosomes from Africa, su(s)
and su(wa) have negative but not significant values of
ewg
Tajima’sD:⫺1.28 and⫺1.04, respectively (Langleyet
Total 3139 169 0.056
al. 2000).
Silent 2409.58 150 0.101
Regarding the EuropeanD. melanogaster sample, the
Nonsynonymous 721.42 19 0.029
su(s) values of Tajima’sDare also negative. They are
signifi-Silent 2794 318 0.123 cant in the case of Europe for both ewgandsu(s). For
the same collection,su(wa
)also exhibits a negative but “Silent” includes both synonymous and noncoding sites.
not significant Tajima’sD. The North AmericanD’s are negative forewgandsu(wa
)but notsu(s).
Turning to the results forD. simulans, Tajima’sDfor sites studied by SSCP are 0.056 and 0.123, respectively
(Table 2). When considering only silent sites,ewgdiver- the ewg region has negative but not significant values (Table 1) in the African sample for both single-nucleo-gence is 0.101. These are similar to the average value,
0.061, reported for noncoding regions by Moriyama tide and indel variation. Only one single-nucleotide vari-ant was found in North America. The lack of
polymor-and Powell (1996). At vermilion, silent divergence is
0.185 (BegunandAquadro1995a). The level of diver- phism in the European sample precluded this analysis. Thesu(s)region ofD. simulans, in contrast, did not have gence aty-ac-scranged between 0.0695 and 0.0558,
de-pending on the type of data (Martı´n-Campos et al. negative values at all, except for the indel variation; the North American sample actually had a significant 1992). The average of Jukes-Cantor divergences
re-ported byBegunandWhitley(2000) for 21X-linked positive value (⫹1.96;P⫽0.0258). Likewise, the North AmericanD. melanogaster su(s)had a large positive value. loci in regions of normal crossing over is 0.112. Our
divergence estimates forewg andsu(s)are comparable The European D. simulanssample has a large positive but not quite significantDatsu(s).
to these other values.
Polymorphism and divergence:We applied the HKA Simulation analysis:Simulations are a useful method
for distinguishing the hitchhiking and background-test (Hudsonet al.1987) to test the null hypothesis that
the level of polymorphism is proportional to divergence selection models. They can provide probabilities of ob-serving particular data sets under each model, which (data not shown). The ideal reference locus matches
the sequence type (here, silent) and the population can then be compared.
For D. melanogaster, the simulation results (Table 1) source. These criteria are met invermilion(Begunand
Aquadro1995a;HamblinandVeuille1999), except can be interpreted as follows. First, Tajima’sDfrom the
ewg African and European samples can be explained that a European sampling source was not available for
vermilionfromD. melanogaster, so that population sample better by the hitchhiking model than by the back-ground-selection model. This is evident in the negative was tested against North American data. The HKA using
ewg and su(s) individually against vermilion was either and significant values of Tajima’sD’s observed (⫺1.67 and⫺1.86). In particular, the hitchhiking simulations highly significant (P⬍ 0.01) or very highly significant
(P⬍0.001). The 5⬘-flanking region ofAdhwas also used showed relatively large P-values (0.2126 and 0.5177), while the background-selection (neutral) model is
sig-(KreitmanandHudson1991), although the sample is
a combination of 11 sequences from many global lo- nificantly inconsistent with the observed data (P ⫽
0.0228 and 0.0093). cales; the results were again always highly significant or
very highly significant. Finally, we conducted the test Second, the background-selection model seems to explain the value of Tajima’sD(⫺0.47) observed in the comparingewg andsu(s), the two loci from this study.
None of those tests was significant. These results (and D. melanogaster ewgNorth American sample better than the hitchhiking model (Table 1). The background-the normal level of divergence) can be interpreted as
strong evidence that the level of polymorphism is re- selectionP-value is 0.3825 while the hitchhikingP-value is only 0.0537.
duced at theewgandsu(s)loci. This reduction of
poly-morphism is not consistent with the neutral model of Third, forsu(s)fromD. melanogaster, we repeated the simulations presented in Figure 3 of Langley et al. molecular evolution.
Frequency spectrum: We used Tajima’s D (Tajima (2000) (Table 1). Again, the hitchhiking model explains
the observed D(⫺1.54; P ⫽0.0377) in Europe better 1989) to assess the deviations from a neutral expectation
of the frequency spectrum of segregating sites. The re- than the background-selection model does. However, because we used different data (see materials and sults are presented in Table 1. Theewgregion exhibits
new values of ˆ from vermilion are much larger than D. melanogaster ewgwith theD. simulanssample size and number of segregating sites and asked how often the the values used byLangleyet al. (2000). Thus the rate of
recurrent hitchhiking required to achieve the observed observed reduction, or a smaller one, in the total size of the coalescent tree was obtained. The size of the relative reduction inˆ is larger, and the simulated values
of Tajima’sDare smaller. Therefore, the observed value coalescent tree is proportional to the amount of varia-tion and an indicator of the strength of hitchhiking of Tajima’sD (⫺1.28), while negative, occurs less often
in the hitchhiking simulation runs. However,P⫽0.0583, (Bravermanet al. 1995). If, all other things being equal, the rate of hitchhiking were significantly greater in so the hitchhiking model is still not rejected. Meanwhile,
the background-selection model hasP⫽0.0823, which D. melanogaster, then the distribution of the relative re-duction would be well beneath the observed relative is also not a significant rejection. Thus, both the
hitch-hiking model and the background-selection model are reduction inD. simulans. The simulation results did not detect evidence of such a difference (P⫽0.8586). The marginally consistent with the data, although neither
produces a very good fit. converse simulations (usingD. simulansrate andD. mela-nogaster parameters) also did not detect a significant Fourth, the value ofDfrom theD. melanogaster su(s)from
Europe (⫺1.54), as suggested byLangleyet al. (2000), difference (P⫽0.6516).
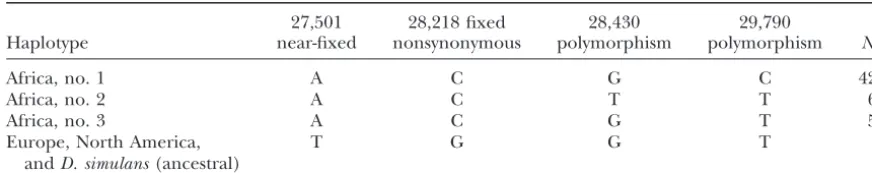
Population subdivision:There is one fixed difference
is explained better by hitchhiking, even with the new
parameters (Table 1). The hitchhikingP-value is 0.2340, among the populations: a nonsynonymous change at site 28,218, fixed in the AfricanD. melanogaster ewgsample while background selection is significantly rejected by
the data (P⫽ 0.0377). as GCG (Ala) and as GGG (Gly) elsewhere (Table 3). There is one nearly fixed difference at site 27,501. All Fifth, the value of Tajima’sDobserved in theD.
mela-nogaster su(s)sample from North America is explained lines except one (no. 50, which has a T) in the African sample have an A. The non-African samples also have better by the background-selection model. Because this
sample has a large positive value of Tajima’sD, we esti- a T at this site. TheD. simulans sequence at these two sites is the same as in the non-African populations, sug-mated the Prob {D ⱖ Do|N.T.} instead of Prob {D ⬍
Do|N.T.} (Table 1). The results indicate where the ob- gesting an African origin of the mutation subsequent to the species’ colonization of the other locations. served value falls in the upper half of the simulated
distribution under the neutral or background-selection Across species and genes, African populations stand out with the highest level of polymorphism (Table 1). models. The simulations show that this value could be
accounted for by the background-selection model, but The polymorphic sites in non-African D. melanogaster ewg populations are not a subset of those found in it is not very likely (P⫽0.0812). Just as the
background-selection model is not likely to produce strongly nega- Africa. The only exception is one indel polymorphism, at which the rarer form is found only twice in the African tive values of Tajima’sD, it is not likely to produce large
positive values. This positiveDis also inconsistent with sample, once in the European sample, and four times in the North American sample. Similarly, the polymor-the hitchhiking model (P⫽ 0.0012).
Turning to the D. simulansresults, Tajima’sDatewg phisms atD. simulans ewgin Africa are not found in the non-African populations, as the latter have nearly no from Africa has a negative value (⫺1.23; Table 1), but
neither the background-selection model nor the hitch- polymorphism.
ForD. simulans su(s), the variation is evenly distributed hiking model is rejected under these simulations. The
power to discriminate among models is reduced in this across the three population samples. Of 14 nonunique segregating sites, 8 segregate in all three populations, case due to the small number of segregating sites. Low
polymorphism precludes these analyses entirely in North many at high frequencies. Three are polymorphic only in the African sample. Three tightly linked indels segre-American and EuropeanD. simulans ewgsamples.
The remaining three cases are fromD. simulans su(s) gate only in the European and North American samples. Thus the European and North American variation can-(Table 1). All three had positive Tajima’sDs. The first
case,su(s)from Africa, is explained better by the back- not be said to be a subset of the African variation. To measure the level of differentiation among the three ground-selection model (P ⫽ 0.8592). The final two
cases had large positive values of Tajima’sD. Their asso- populations, we calculatedFSTaccording toHudsonet al.(1992b) and applied the permutation test to various ciatedP-values, interpreted as Prob {Dⱖ Do} for both
models, are very small. Consequently, neither the back- subdivision statistics (Hudson et al. 1992a; Hudson 2000). First, as a preliminary step, we calculatedFSTfor ground-selection model nor the hitchhiking model is
able to explain these cases very well. ewgfor comparisons of the three different locales from which the EuropeanD. melanogasterflies were collected; Hitchhiking simulations were used to test for a
differ-ence in the rate of hitchhiking in the two species. In the values were very low and not statistically significantly different from zero subdivision. Thus we pooled these the case of theewgsample from Africa, it appears that
the rate of hitchhiking is greater inD. melanogasterthan three groups. Second, we applied the same procedure to the two groups ofD. simulansNorth American lines inD. simulans, sinceˆ is smaller in the former species.
TABLE 3
The haplotypes ofD. melanogaster ewgfor nonunique single-nucleotide polymorphism
27,501 28,218 fixed 28,430 29,790
Haplotype near-fixed nonsynonymous polymorphism polymorphism N
Africa, no. 1 A C G C 42
Africa, no. 2 A C T T 6
Africa, no. 3 A C G T 5
Europe, North America, T G G T
andD. simulans(ancestral)
The indel polymorphism at 29,138 was excluded (see text). Ancestral states were inferred on the basis of aligned sites in the non-African populations and inD. simulans.
these populations with which to detect any subdivision). cal length where the impact of linked selection is most apparent. The evidence for skewed frequency spectra The value was also not significant. This also justifies
pooling these two locales. atewgin the African populations of bothD. melanogaster
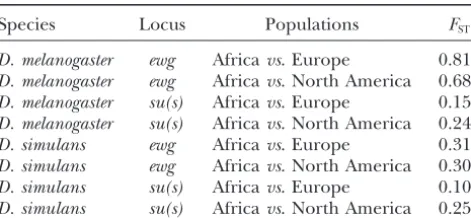
andD. simulanspoints toward strong positive selection Second, the estimates ofFSTfor comparisons between
Africa and North America and between Africa and Eu- shaping neutral (and more mildly selected) variation at the tip of theXchromosome in these two species. The rope are reported in Table 4. All the comparisons
ex-hibit statistically significant subdivision. The estimates remainder of this discussion considers other forces that may have shaped our data fromewgandsu(s). We forD. melanogasterrange from 0.153 to 0.811. The
subdi-vision atewgis greater than atsu(s). Subdivision is also also compare our data to previous publications.
Background selection:Several lines of reasoning
ar-present inD. simulans, withFSTvalues ranging from 0.100
to 0.312 (Table 4). They are slightly higher atewgthan gue against the background-selection model as an expla-nation for the data atewgandsu(s). First,Hudsonand atsu(s).
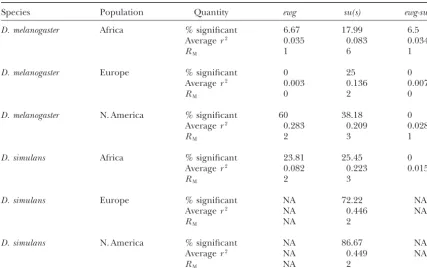
Linkage disequilibrium:We conducted Fisher’s exact Kaplan(1995) note that extremely high rates of
delete-rious mutation are required to obtain the large reduc-test on all pairs of polymorphisms present in at least
two lines (i.e., excluding unique polymorphisms) to test tions observed at genes such as those at the telomere. Second, background selection cannot account for sig-for nonrandom associations. Each population was
treated separately. Table 5 summarizes the percentage nificant negative values of Tajima’sDobserved in practi-cal sample sizes (Hudson and Kaplan 1994; Charles-of formally significant (P⬍0.05) linkage disequilibria
among polymorphic sites. Table 5 also presentsRM, the worth et al. 1995). Our data include several cases of significantly negative Tajima’sD’s. The case [D. simulans
inferred minimum number of recombination events in
a sample (HudsonandKaplan1985), and averager2, su(s)of North America] of Tajima’sDthat is large and
significantly positive also does not fit the background-the squared correlation coefficient. In most cases,RM⬎
0, evidence for occasional recombination in the history selection model. The large nonsignificant values of Taji-ma’s D (D. simulans of Europe and D. melanogaster of of these sampled alleles in both species. At the same
time, the proportions of “significant” tests and the aver- North America) are not easily explained by the back-ground-selection model according to our simulation age r2 indicate substantial linkage disequilibrium.
In-terlocus linkage disequilibrium estimates (average r2) analysis (Table 1). Third,KimandStephan(2000)
com-pared the two models and found that in general the in D. melanogasterin general are of the same order of
magnitude as intralocus estimates, except in the North hitchhiking model better explains polymorphism in re-gions of very restricted crossing over.
American sample, where both theewgandsu(s)
intralo-cus values are higher than the interlointralo-cus values and, Recombination: Another issue raised by our results is the unexpected evidence for recombination in our for su(s), in the European sample. In D. simulans, the
sample from Africa was the only one with enough poly- sample, indicated by RM ⬎ 0. It seems unlikely that
crossing over is responsible for these nonzero values of morphic sites in both genes for this analysis. The average
r2is the greatest withinsu(s)and is an order of magni- R
M because observed crossing over is very low in this
region. In addition, crossing over should reduce the tude lower inewgand between the two loci. Averager2is
even higher withinD. simulans su(s)from North America hitchhiking effect, yet polymorphism is in fact low. An-other process, gene conversion, could result inRM⬎0, and Europe.
which we observed in both genes and in both species (Table 5). Because the population genetic consequence DISCUSSION
of unbiased gene conversion is effectively short-range double exchange, its impact on linkage disequilibrium The data and analysis presented here consider the
TABLE 4 of the sampled alleles at bothewgandsu(s), the lack of any correlation with distance is consistent with gene Population structure atewgandsu(s)
conversion being the dominant form of recombination in this genomic region.
Species Locus Populations FST
In D. simulans, the pattern of linkage disequilibrium D. melanogaster ewg Africavs. Europe 0.811 is difficult to interpret. In AfricanD. simulans, the order D. melanogaster ewg Africavs. North America 0.688
of magnitude of ther2 is almost three times higher in
D. melanogaster su(s) Africavs. Europe 0.153
su(s) than in ewg (Table 5). This difference between D. melanogaster su(s) Africavs. North America 0.245
intralocus averager2and proportion of statistically
sig-D. simulans ewg Africavs. Europe 0.312
D. simulans ewg Africavs. North America 0.308 nificant associations may be ascribed to the strong skew D. simulans su(s) Africavs. Europe 0.100 in the frequency spectrum atewg. On the other hand, D. simulans su(s) Africavs. North America 0.256 the lack of significant interlocus associations between sites inewgandsu(s)suggests that the crossing over does FSTwas calculated according toHudsonet al.(1992b,
Equa-contribute to recombination in this genomic region in tion 3) using both the single-nucleotide and insertion-deletion
data. The permutation test of the null no-subdivision model D.simulans.
(1000 iterations) with all the statistics ofHudsonet al.(1992a) Little is known about the rate of gene conversion. applied to the new data is very highly significant (P⬍0.001),
Whether the few polymorphisms in these regions are except forD. simulans su(s)Africavs. Europe (P⬍0.05). The
those building up after a massive selective sweep or the permutation test analysis of Hudson’sSnn(2000) is always very
equilibrium variation under background selection, the highly significant (P⬍0.001). We did not adjustP-values for
multiple tests. The values fromD. melanogaster su(s)are from appearance of clear recombinants indicates that
recom-Langleyet al.(2000) and are included as a reference without bination (probably gene conversion) occurs at a rate statistical tests.
comparable to (or larger than) that of neutral mutation. As new neutral mutations accumulate, they are recom-bined. A gene conversion rate of, for example, 10⫺8/
(AndolfattoandNordborg1998;Frisseet al.2001). bp and a neutral mutation rate of 10⫺9may be sufficient
For pairs of polymorphic sites less than a gene conver- to accommodate the observations.
sion-track length apart, gene conversion augments the Our data are similar but not identical to those from decay of linkage disequilibrium with distance. In con- surveys of DNA sequence polymorphism on the fourth trast, for pairs of polymorphic sites that are more widely chromosome that found long-distance disequilibria as separated, gene conversion reduces nonrandom associ- well as evidence for some form of recombination on ation at a distance-independent rate. For example, respective regions of theD. melanogasterfourth
chromo-Langley et al. (2000) noted a lack of long-distance some (Jensen et al. 2002; Wang et al. 2002). Wanget
linkage disequilibria and the presence of short-distance al. (2002) found Tajima’sDto be⫺0.9745 (P⫽0.1739) disequilibria on the scale of gene conversion, and thus for all regions pooled, and Jensen et al. (2002) found they interpreted the inferred recombination in their Tajima’sDto be⫹0.47 inD. melanogasterand⫺0.68 in samples as gene conversion, not crossover, events. D. simulansfor single-nucleotide variation at theankyrin Before considering any linkage disequilibrium in our gene. To contrast, we had large positive values of Taji-data, it is important to note that not much power is ma’s D. They also found two haplotypes present over available to discern patterns. Not only is there low varia- long distances. Thus their results do not immediately tion, but also, when there is a skew toward rare variants, offer insight into our data.
the number of nonsingleton sites available for LD analy- Random-environment models:Linked selection mod-sis is even fewer. Hence it is best to focus on the African els such as those studied by Gillespie (1997) might sample, which has the highest amount of variation in explain some of our results. He investigated random-these regions, and because the African population is environment-selection models and observed negative probably closest to equilibrium. Two observations from values of Tajima’s Dwhen selection reduces polymor-the AfricanD. melanogaster data are relevant. First, the phism at linked neutral sites. However, relevant sample averager2is of the same order of magnitude within both
properties of this statistic and/or appropriate parameter
su(s)andewg (0.083 and 0.035, respectively; Table 5), estimates under these models with which to conduct a as well as between the loci in the intergenic comparisons statistical test on our data are not available.
[0.034 betweenewgandsu(s)]. Thus we did not detect Levels of polymorphism: A number of studies have a decrease in the magnitude of linkage disequilibrium measured polymorphism at other telomeric genes in over large genomic distances. Second, the proportion theD. melanogaster Xchromosome. A comparison of our of intralocus comparisons with nominally significant ewgandsu(s)data to previous results follows. Theyellow
linkage disequilibria (17.99% atsu(s)and 6.67% atewg; (y) gene (and its proximal neighbors ac and sc), for Table 5) is not greater at the more distalewg despite example, is important because it is located betweenewg
TABLE 5
Recombination and linkage disequilibrium
Species Population Quantity ewg su(s) ewg-su(s)
D. melanogaster Africa % significant 6.67 17.99 6.5
Averager2 0.035 0.083 0.034
RM 1 6 1
D. melanogaster Europe % significant 0 25 0
Averager2 0.003 0.136 0.007
RM 0 2 0
D. melanogaster N. America % significant 60 38.18 0
Averager2 0.283 0.209 0.028
RM 2 3 1
D. simulans Africa % significant 23.81 25.45 0
Averager2 0.082 0.223 0.0153
RM 2 3
D. simulans Europe % significant NA 72.22 NA
Averager2 NA 0.446 NA
RM NA 2
D. simulans N. America % significant NA 86.67 NA
Averager2 NA 0.449 NA
RM NA 2
“% significant” indicates the percentage of formally significant pairs; i.e., P-values were not adjusted for multiple tests.
affected. For Zimbabwe collections of theX-linkedyellow silent variation over two lines from Africa, two from North America, and one from the Seychelles Islands. and ac, the values of ˆ were estimated as 0.0017 and
0.0012 using RFLP data (Begunand Aquadro1993). While the species average is higher inD. simulansthan in D. melanogaster for regions of normal crossing over A DNA sequencing study of yellowfrom fly collections
from Africa (Zimbabwe) estimatedˆ as 0.0003 (Andol- (Moriyama and Powell 1996; Andolfatto 2001), these three studies andewg andsu(s)exhibit more
re-fattoandPrzeworski2001), and an expansion of that
survey’s sample size (n⫽49) in more base pairs (2017 duced variation inD. simulansthan inD. melanogasterat theXtelomere.
bp) yields a ˆ of 0.000658 (recalculated from data
re-ported by Andolfatto and Wall 2003). Meanwhile, In the region from the telomere toewgwhere there is presumably even less crossing over, Sheldahl et al. the value ofˆ reported forewgis 0.00035. This number
and its upper bootstrap confidence limit are lower than (2003) also surveyed three regions. In the African (Zim-babwe) collection (n⫽4), the values ofˆ (silent) were the last value reported foryellow. Aˆ value of 0.00182
for the su(s) D. melanogaster Africa population (Zim- 0, 0, and 0.00272, moving from the most distal to the most proximal. The trend stops just shy of the value babwe) lies above the yellow numbers (Langley et al.
2000). Thus the levels of polymorphism at these three reported in Table 1 for ewg Africa (Zimbabwe); thus these data from Sheldahl et al. (2003) are consistent loci in the African populations are consistent with their
relative distances from the telomere and presumed rela- with those from larger samples.
Demography:Our quantification of population
struc-tive rates of crossing over.
InD. simulans, there are only three published studies ture (Table 4) can be compared toFSTvalues from D. melanogaster su(wa), which had an Africa-EuropeFSTof
of DNA sequence variation near the telomere of theX
chromosome. Martı´n-Campos et al. (1992) found no 0.291 and an Africa-North AmericaFSTof 0.343 (L ang-leyet al. 2000). The values atsu(s)andsu(wa)are
compa-variation aty-acin a sample of 103 non-African samples.
Begun andAquadro(1991) found very low variation rable toFSTvalues forX-linked regions of normal
cross-ing over, which have been reported for Africa-North in non-African samples (ˆ ⫽0.0001 at the same genes
in a North American population; n ⫽ 36). Sheldahl AmericaD. melanogaster(e.g., on the basis of RFLP data:
white, 0.28;vermilion, 0.32;G6pd, 0.30;Pgd, 0.25;Begun et al. (2003) surveyed variation among five lines of D.
simulans at the same regions mentioned above for D. and Aquadro 1993). On the basis of DNA sequence data,vermilionhasFSTvalues of 0.370 for Africavs. North
America (Begun andAquadro 1995a). The values at et al. (2003). Fourth, we observed a fixed difference at one site (28,218) and a near-fixed difference at another
su(s)andsu(wa)are slightly lower than other values of
FSTfor regions of reduced recombination (Begunand site (27,501), and the ancestral forms of these differ-ences occur only in samples collected outside Africa. It
Aquadro 1993). For example, Begun and Aquadro
(1993) estimatedFSTas 0.56 foryellow and 0.54 forac. is unknown whether the first site is itself the target of selection, but the difference at this site is
nonsynony-Charlesworth(1998) showed that estimates ofFSTmay
be inflated when using low levels of polymorphism, mous, making it a more likely target than the remaining synonymous and noncoding sites. BeyondGlinkaet al. which was the case foryellow andac, so there may be
no real difference inFSTbetween the different regions. (2003),Andolfatto andPrzeworski(2001) studied many genes from an African sample and concluded that To contrast,ewghas an enormous value ofFST(0.811),
which was calculated using a larger number of polymor- hitchhiking is a better explanation than demographic explanations for that data.InnanandStephan(2003) phic sites than those for yellow and ac, although the
values ofˆ atewgare lower. The large geographic dif- applied a different method to the same data and also found hitchhiking to be the dominant force, although ferentiation atewgreflects the fixed difference and
near-fixed difference (Table 3), and it is consistent with a they were not considering demographic explanations. Regarding demography and selection in the other geographically localized hitchhiking event(s). A single
parameterization of a model of geographic differentia- cases of significant Tajima’sD’s from non-African popu-lations in this study, namely, EuropeanD. melanogaster
tion by genetic drift and migration would not
simultane-ously account for this observation and data from the ewgandsu(s), there is also reason to believe that hitch-hiking played a role. In D. melanogaster, the large FST
rest of the genome. Hitchhiking associated with strong
selection, genomically localized to theXtelomere and values and the greater variability in the African sample support a historical migration from Africa and subse-geographically differentiated, is proposed as anad hoc
explanation here but quantitatively documented else- quent restricted migration. This would indicate a demo-graphic influence on non-African polymorphism. How-where (e.g.,Baineset al. 2004).
Irvin et al. (1998) studied population substructure ever, both Glinka et al. (2003) and Orengo and
Aguade´ (2004) found evidence of selection in
Euro-inD. simulansusing microsatellites and found a much
lower level of substructure than that found inD. melano- pean populations.Orengo andAguade´(2004) point out that this is an expected process during colonization
gaster, similar to the trends seen in our data (Table 4).
These authors interpreted this trend as the result of a of new environments.
Our results forD. simulansincluded negative but not much less severe bottleneck in D. simulans than what
occurred inD. melanogasterand/or a more recent col- significant Tajima’sD’s for Africa. Again, we view those results as consistent with a study by Quesada et al. onization of non-African locales byD. simulans.
We now consider whether demographic forces can (2003), who surveyed a different African sample, mea-suring variation in regions with normal to high levels explain our results for the African sample ofD.
melano-gaster. The significantly negative Tajima’sDin the Afri- of crossing over and also finding evidence for hitchhik-ing inD. simulans. For non-African populations,Wall can sample (⫺1.67,P⫽0.0228; Table 1) could be the
result of bottleneck or expansion. For example,Glinka et al. (2002) reanalyzed the North AmericanD. simulans
polymorphism data fromBegunandWhitley(2000),
et al. (2003) interpret their data as evidence of
popula-tion expansion rather than hitchhiking. They studied and the patterns observed were found to be explainable by a simple bottleneck. However, their model fits the many X-linked loci from the same population
(Zim-babwe) and found many significantly negative Tajima’s data only if the ancestralX:autosome effective popula-tion sizes ratio is low and if the bottleneck is strong and
D’s yet no significant HKA test results and only a weak
correlation between recombination and polymorphism. recent. The authors did not know how reasonable those conditions were (Wallet al. 2002). Further, those inter-However, our study contrasts to theirs in several ways,
leading to a different conclusion. First, Glinka et al. pretations are from smaller sample sizes and genomic regions of normal crossing over per physical length and (2003) studied genes from regions of normal crossing
over, while the two genes in the present study are from so may not be applicable to our data.
Conclusion: The excess of rare variants at ewg, the
regions of highly restricted crossing over.Glinkaet al.
(2003) treat regions of reduced crossing over as excep- more distal of the two loci, and highFSTvalues indicate strong population subdivision among the three popula-tions, while to further understand such regions is
pre-cisely the goal of our study. Second, we observe that the tions atewg. These results indicate genetic hitchhiking atewgand perhaps geographically localized hitchhiking amount of polymorphism at ewg is lower than that at
su(s), which does suggest a correlation between crossing events within Africa. The reduction of polymorphism at su(s) combined with the excess of high-frequency over and polymorphism. A bottleneck or expansion
alone could not explain this correlation. Third, our variants inD. simulansis inconsistent with the hitchhik-ing and background-selection models. Although the HKA test results are positive, indicating an extreme
W. Stephan, 1995 The hitchhiking effect on the site frequency fromewg can be explained by hitchhiking in the
telo-spectrum of DNA polymorphisms. Genetics140:783–796. meric region of theXchromosomes of bothD. melano- Celniker, S. E., D. A. Wheeler, B. Kronmiller, J. W. Carlson, A.
Halpernet al., 2002 Finishing a whole-genome shotgun: release
gaster andD. simulans. While this mechanism may
rea-3 of theDrosophila melanogastereuchromatic genome sequence. sonably be extrapolated to other telomeres (and
per-Genome Biol.3:research0079.0071–0079.0014.
haps centromere-proximal euchromatic sequences), Charlesworth, B., 1996 Background selection and patterns of ge-netic diversity inDrosophila melanogaster.Genet. Res.68:131–149. the extremely reduced crossing over in these regions
Charlesworth, B., 1998 Measures of divergence between
popula-and the unique functional aspects of telomeres (e.g.,
tions and the effect of forces that reduce variability. Mol. Biol. telomere capping and the telomere’s role in mitotic Evol.15:538–543.
Charlesworth, B., M. T. MorganandD. Charlesworth, 1993
and meiotic segregation) restrict generalization to the
The effect of deleterious mutations on neutral molecular varia-entire genome.
tion. Genetics134:1289–1303.
Charlesworth, D., B. CharlesworthandM. T. Morgan, 1995
We are grateful to the following people for their assistance: Kalpana
The pattern of neutral molecular variation under the background White for providing a genomic DNA sequence of theerect winglocus;
selection model. Genetics141:1619–1632. Chip Aquadro for providing ZimbabweD. melanogasterandD. simulans
David, J. R., andP. Capy, 1988 Genetic variation ofDrosophila
melano-flies; Michael Turelli for collecting and providing the California
gasternatural populations. Trends Genet.4:106–111.
D. simulansflies; and Amanda Frank, Debbie Davis, Kristy Martinez,
Drysdale, R. A., M. A. Crosby, and The Flybase Consortium,
Marc Crepeau, Erja Heikkinen, and members of the Aguade´ and 2005 FlyBase: genes and gene models. Nucleic Acids Res.33: Langley laboratories. We thank two anonymous reviewers for improv- D390–D395 (http://flybase.org/).
ing the manuscript with their comments. Funding for this research Frisse, L., R. R. Hudson, A. Bartoszewicz, J. D. Wall, J. Donfack came from National Science Foundation (NSF) grant DEB 95-09548 et al., 2001 Gene conversion and different population histories may explain the contrast between polymorphism and linkage to C.H.L. and grants PB97-0918 and BMC2001-2909 from Comisio´n
disequilibrium levels. Am. J. Hum. Genet.69:831–843. Interdepartamental de Ciencia y Tecnologı´a, Spain, and
2001SGR-Geyer, P. K., A. J. Chien, V. G. CorcesandM. M. Green, 1991
Muta-101 from Comissio´ Interdepartamental de Recerca i Innovacio´
Tecno-tions in thesu(s)gene affect RNA processing inDrosophila
melano-lo`gica, Catalonia, Spain, to M.A. J.M.B. was supported by postdoctoral
gaster.Proc. Natl. Acad. Sci. USA88:7116–7120. fellowships from the NSF/Sloan Foundation and the Ministerio de
Gillespie, J. H., 1997 Junk ain’t what junk does: neutral alleles in
Educacio´n y Ciencia, Spain. a selected context. Gene205:291–299.
Gillespie, J. H., 2000 Genetic drift in an infinite population: the
pseudohitchhiking model. Genetics155:909–919.
Glinka, S., L. Ometto, S. Mousset, W. StephanandD. De Lorenzo,
LITERATURE CITED
2003 Demography and natural selection have shaped genetic variation inDrosophila melanogaster: a multi-locus approach.
Ge-Aguade´, M., N. MiyashitaandC. H. Langley, 1989 Reduced
varia-tion in theyellow-achaete-scute region in natural populations of netics165:1269–1278.
Hamblin, M. T., andM. Veuille, 1999 Population structure among
Drosophila melanogaster.Genetics122:607–615.
Aguade´, M., W. Meyers, A. D. LongandC. H. Langley, 1994 Single- African and derived populations ofDrosophila simulans: evidence
for ancient subdivision and recent admixture. Genetics153:305– strand conformation polymorphism analysis coupled with
strati-fied DNA sequencing reveals reduced sequence variation in the 317.
Hudson, R. R., 1990 Gene genealogies and the coalescent process.
su(s)andsu(wa)regions of theDrosophila melanogaster X
chromo-some. Proc. Natl. Acad. Sci. USA91:4658–4662. Oxf. Rev. Evol. Biol.7:1–44.
Hudson, R. R., 2000 A new statistic for detecting genetic
differentia-Andolfatto, P., 2001 Contrasting patterns of X-linked and
autoso-mal nucleotide variation inDrosophila melanogasterandDrosophila tion. Genetics155:2011–2014.
Hudson, R. R., andN. L. Kaplan, 1985 Statistical properties of the
simulans.Mol. Biol. Evol.18:279–290.
Andolfatto, P., andM. Nordborg, 1998 The effect of gene conver- number of recombination events in the history of a sample of
DNA sequences. Genetics111:147–164. sion on intralocus associations. Genetics148:1397–1399.
Andolfatto, P., andM. Przeworski, 2001 Regions of lower cross- Hudson, R. H., andN. L. Kaplan, 1994 Gene trees with background
selection, pp. 140–153 inNon-neutral Evolution: Theories and Data, ing over harbor more rare variants in African populations of
Drosophila melanogaster.Genetics158:657–665. edited by G. B.Golding. Chapman & Hall, New York.
Hudson, R. R., andN. L. Kaplan, 1995 Deleterious background
Andolfatto, P., andJ. D. Wall, 2003 Linkage disequilibrium
pat-terns across a recombination gradient in AfricanDrosophila mela- selection with recombination. Genetics141:1605–1617.
Hudson, R. R., M. KreitmanandM. Aguade´, 1987 A test of neutral
nogaster.Genetics165:1289–1305.
Aquadro, C. F., 1992 Why is the genome variable? Insights from molecular evolution based on nucleotide data. Genetics 116:
153–159. Drosophila. Trends Genet.8:355–362.
Baines, J. F., A. Das, S. MoussetandW. Stephan, 2004 The role Hudson, R. R., D. D. BoosandN. L. Kaplan, 1992a A statistical test
for detecting geographic subdivision. Mol. Biol. Evol.9:138–151. of natural selection in genetic differentiation of worldwide
popu-lations ofDrosophila ananassae.Genetics168:1987–1998. Hudson, R. R., M. SlatkinandW. P. Maddison, 1992b Estimation of levels of gene flow from DNA sequence data. Genetics132:
Begun, D. J., andC. F. Aquadro, 1991 Molecular population
genet-ics of the distal portion of theXchromosome in Drosophila: 583–589.
Innan, H., andW. Stephan, 2003 Distinguishing the hitchhiking
evidence for genetic hitchhiking of theyellow-achaeteregion.
Ge-netics129:1147–1158. and background selection models. Genetics165:2307–2312.
Irvin, S. D., K. A. Wetterstrand, C. M. HutterandC. F. Aquadro,
Begun, D. J., andC. F. Aquadro, 1993 African and North American
populations ofDrosophila melanogasterare very different at the 1998 Genetic variation and differentiation at microsatellite loci inDrosophila simulans: evidence for founder effects in New World DNA level. Nature365:548–550.
Begun, D. J., andC. F. Aquadro, 1995a Molecular variation at the populations. Genetics150:777–790.
Jensen, M. A., B. CharlesworthandM. Kreitman, 2002 Patterns
vermilionlocus in geographically diverse populations ofDrosophila
melanogasterandD. simulans.Genetics140:1019–1032. of genetic variation at a chromosome 4 locus ofDrosophila melano-gasterandD. simulans.Genetics160:493–507.
Begun, D. J., andC. F. Aquadro, 1995b Evolution at the tip and
base of theXchromosome in an African population ofDrosophila Kaplan, N. L., R. R. HudsonandC. H. Langley, 1989 The “hitch-hiking effect” revisited. Genetics123:887–899.
melanogaster.Mol. Biol. Evol.12:382–390.
Begun, D. J., andP. Whitley, 2000 ReducedX-linked nucleotide Kim, Y., andW. Stephan, 2000 Joint effects of genetic hitchhiking
and background selection on neutral variation. Genetics155:
polymorphism inDrosophila simulans.Proc. Natl. Acad. Sci. USA
97:5960–5965. 1415–1427.
Koushika, S. P., M. Soller and K. White, 2000 The