DOI: 10.1534/genetics.105.041723
Positive Assortative Mating With Family Size as a Function of Predicted
Parental Breeding Values
M. Lstibu˚rek,*
,1T. J. Mullin,*
,2T. F. C. Mackay,
†D. Huber
‡and B. Li*
*Department of Forestry and Environmental Resources, North Carolina State University, Raleigh, North Carolina 27695,†Department of Genetics, North Carolina State University, Raleigh, North Carolina 27695 and‡School of Forest Resources and Conservation,
University of Florida, Gainesville, Florida 32611 Manuscript received February 7, 2005 Accepted for publication May 31, 2005
ABSTRACT
While other investigations have described benefits of positive assortative mating (PAM) for forest tree breeding, the allocation of resources among mates in these studies was either equal or varied, using schemes corresponding only to parental rank (i.e., more resources invested in higher-ranking parents). In this simulation study, family sizes were proportional to predicted midparent BLUP values. The distri-bution of midparent BLUP values was standardized by a constant, which was varied to study the range of distributions of family size. Redistributing progenies from lower- to higher-ranking families to a point where an equal number of progenies were still selected out of each family to the next generation caused minimal change in group coancestry and inbreeding in the breeding population (BP), while the additive genetic response and variance in the BP were both greatly enhanced. This generated additional genetic gains for forest plantations by selecting more superior genotypes from the BP (compared to PAM with equal family sizes) for production of improved regeneration materials. These conclusions were verified for a range of heritability under a polygenic model and under a mixed-inheritance model with a QTL contributing to the trait variation.
E
ARLIER studies by computer simulation have dem-onstrated that positive assortative mating (PAM) applied in a long-term forest tree breeding program has the potential to generate extra genetic improvement in forest plantations (e.g., dissertations by Mahalovich1990; Rosvall1999). This is due to the enhancement
of the additive genetic response and variance in the breeding population (BP), enabling the selection of more extreme genotypes from the BP. These genotypes can be established in orchards to produce seeds for production of reforestation nursery stock or alternatively can be vegetatively propagated and directly planted as clones. When both genetic gain and diversity are con-sidered in a single selection criterion, PAM does not much alter the effective population size compared with that achieved under random mating, but increases the average inbreeding in the BP as a consequence of mating among more related individuals (Rosvalland Mullin
2003).
Ideally, the contribution of individuals in the BP to the next generation should correlate with their breed-ing values (Lindgren1986). Various weighting schemes
have been proposed to assign mating frequencies to individuals in the BP. These are built on different as-sumptions about the distribution of breeding values and the function used to assign the corresponding mating frequencies (Kangand Namkoong1988; Kang1989;
Weiand Lindgren1995). Two approaches for
control-ling parental contributions during PAM were investi-gated by Rosvallet al.(2003), using a stochastic model
of a forest-tree breeding program. In the first approach, balanced mating (each individual involved in an equal number of combinations) was followed by unbalanced se-lection (more progenies selected from higher-ranking families and fewer from lower-ranking families). In the second, unbalanced mating (individuals of higher rank mated more frequently than lower-ranking trees) was followed by balanced within-family selection. Even though the second approach led to less additive genetic response in the BP, this was overcompensated by a larger expansion of additive variance, resulting in greater genetic gains from the very best genotypes deployed in plantations. In the unbalanced mating scheme, individ-uals in the BP were ranked by breeding value and subdivided into three distinct hierarchical groups of equal size. The number of mating combinations per in-dividual within a group varied among groups: more in the best group and fewer in the lowest-ranking group.
Optimization of genetic contributions has received considerable attention among quantitative geneticists
1Present address:Faculty of Forestry and Environment, Czech University of Agriculture, Kamy´cka´ 1176, Praha 6-Suchdol, 165 21, Czech Republic. 2Corresponding author: Department of Forestry and Environmental Resources, North Carolina State University, Box 8002, Raleigh, NC 27695-8002. E-mail: [email protected]
and breeders. Algorithms have been developed to optimize genetic contributions in individual genera-tions with the goal to maximize genetic response in the breeding population over a total target number of generations. The optimization problem is often con-strained by the intended rate of inbreeding. Grundy
et al.(1998) subdivide these approaches asa priori(on the basis of deterministic predictions) and a posteriori
(dynamic selection algorithms) schemes. The latter could be used to optimize contributions with respect to only the next generation (Meuwissen 1997) or to
multiple generations (Woolliams and Thompson
1994). Tactical mate selection then integrates the theory of genetic contributions with technical, logical, and cost factors (Shepherdand Kinghorn1998).
Forest trees are characterized by long generation intervals. The particular breeding program that pro-vided the basis for the breeding strategy illustrated in this study is that for Norway spruce [Picea abies (L.) Karst.] in Sweden (Karlsonand Rosvall1993; Danell
1995). The current generation turnover time in this program is30 years. Further, only a selected subset of trees in the BP (i.e., not the whole population) in each generation contribute to new forest plantations. Seed orchards are established with a mixture of several trees selected across multiple breeding populations in given geographical area. Seeds harvested from these orchards are used for current reforestation. Apart from immedi-ate reforestation needs is the long-term management of the BP, where the goal is to achieve a sustainable supply of improved genetic material under uncertain eco-nomic and environmental conditions in both the short and the long term. The management of the BP in this particular program was therefore designed to minimize the reduction of gene diversity (or equivalently, effective population size). This is achieved by equal contribution of all individuals in the BP to future generations. A balanced mating scheme followed by balanced within-family selection is a key characteristic of the program. Clonal replication of progeny tests is used to enhance genetic progress in the BP from within-family selection. To enhance the selection response for current and fu-ture reforestation needs, Rosvalland Mullin(2003)
proposed the incorporation of PAM. The purpose is to enhance the additive variance in the BP, which provides additional genetic gain when selecting the seed or-chard, since only a few genotypes from the BP contrib-ute to the orchard.
In earlier investigations (Rosvall et al. 2003; Lstibu˚ reket al.2004), parental contributions did not
follow the actual distributional patterns of their pre-dicted breeding values. The number of mating combi-nations assigned to each individual followed its rank, rather than its predicted breeding value, which imposed an unrealistic assumption that the correlation between rank and breeding value was one. Furthermore, the number of combinations was constant within each
hierarchical group, such that the highest-ranking in-dividual was involved in the same number of combina-tions as the lowest-ranking member of the same group. The objective of this study was to dynamically control parental contributions, allowing the importance as-signed to each mate to be guided by a linear function of predicted BLUP values. In this study, we quantify the effect of this approach on genetic response and diversity in the BP and on the actual benefit to forest plantations derived from the BP. We also test the sensitivity of the approach with respect to a single major-gene locus con-tributing to variation in the quantitative trait of interest. In this study, we stress situations where parental con-tributions are balanced and where genetic progress is constrained by fixed resources for testing, as these are of greatest practical interest to forest tree breeders.
METHODS
The computer simulation program ‘‘POPSIM’’ (Mullin and Park 1995) was modified as described
below. The situation modeled represents a single breeding population managed over 12 discrete (non-overlapping) generations (Figure 1). The strategy is based on the actual breeding program implemented for Norway spruce in Sweden (discussed above), although some of the components were modified or eliminated to provide general recommendations over a wider range of forest tree breeding programs. In many such programs, the genetic component of observed variation in a quan-titative trait is attributable primarily to additive gene action, and the basic breeding strategy employed is based on ‘‘recurrent selection for general combining ability’’ (Namkoonget al.1988).
Genetic model: A single quantitative trait was de-scribed by the genetic model for a population of Figure1.—Schematic of the conceptual breeding strategy,
where the symbols are: 1, positive assortative mating and 2, selection. The addition of information on relatives for genetic evaluation is depicted by dotted lines, while dashed lines des-ignate the use of predicted BLUP values. Only the first two generations are depicted; subsequent generations follow an identical plan.
diploid, monoecious individuals, with an initial popu-lation mean of 100. The trait was influenced by a large number of loci, segregating independently, each with a small effect (polygenic model). In the polygenic model, the phenotypic value (P) of each individual was com-posed of an independent additive polygenic (AP) component and an environmental deviation (E), such thatP ¼AP1E. Correspondingly, the phenotypic vari-ance (VP) was VP¼VAP1VE. TheVAP was adjusted for
individual sets of simulation scenarios such that initial narrow-sense heritability h2 was 0.1, 0.3, or 0.5, while
initial VP remained constant at 500 (Rosvall et al. 1999).
Founder population: Forty-eight founder genotypes were sampled randomly from a population of unrelated, noninbred individuals. The additive effect was sampled from Normal(0,VAP) and the environmental deviation
was sampled from Normal(100,VE). Each founder was
progeny tested with a pollen mix (polycross test). To generate this test, each founder was mated at random to a common pool of 20 unique unrelated, noninbred individuals (representing the mixture of tester pollen). These individuals were sampled from the same distri-bution of effects as that of the founder population. One hundred fifty polycross-test progenies were generated for each founder. The additive effect for each test prog-eny was randomly sampled from Normal(aFS, 0.5VAP),
whereaFSis the midparent additive effect. The environ-mental effect for each progeny genotype was drawn randomly from Normal(100, VE). The best linear
un-biased prediction (BLUP) value of each founder was then calculated from the test, using the animal model (Mrode1996; Lynchand Walsh1998) implemented
in the ASReml software package (Gilmouret al.2002).
In this totally balanced case of unrelated founders, the initial breeding values could be as well calculated as simple deviations from family means. In later genera-tions (following the introduction of imbalance), found-ers must also be included in the genetic evaluation. Therefore, to simplify programming, we incorporated generalized BLUP analysis from the initial generation. In all situations prior to the BLUP analysis, ASReml was used to estimate variances from the supplied pheno-typic and pedigree data.
Assortment of mates:Founders were sorted by BLUP values and mated in a single-pair mating scheme (total number of familiesNf¼24) to generate progenies that are selection candidates for the breeding population in the next generation. For example, the founder with the highest BLUP value, 1, was mated with founder 2 having the second-highest BLUP value; the next mating was between founders 3 and 4, etc.; and eventually the last mating was between 23 and 24,i.e., between the second-lowest and the second-lowest-ranking founders, respectively. Thus, every tree was involved in only one mating. This form of assortment was performed among selected individuals in later generations prior to mating.
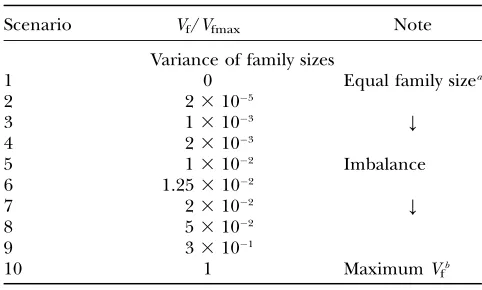
Derivation of family sizes: The number of full-sib progenies in each family (family size) was determined as a linear function of the midparent BLUP value (average of parental BLUP values). Midparent BLUP values were standardized to the arithmetic meanaA. Following this standardization, all negative values were converted to zero and all positive values were converted to a relative scale. Family sizes were then determined as a product of the recruitment population size NRP(total number of test progenies within each generation, equal to 720) and these relative values. The average family size was equal to 30,i.e., 720 progeny genotypes/24 families. The vari-ance in family sizes (Vf) can have two extremes: (1) all family sizes are equal to 30 (Vf ¼0), and (2) all prog-enies (720) are generated in the top-ranking family, and all remaining families have family size zero (Vfmax¼ 20;700). The desired proportion of variance in family sizes relative to the maximum varianceVf=Vfmaxis then bounded within the interval [0, 1]. This desired pro-portion was specified as a simulation input parameter and was varied in individual simulation scenarios to cover the entire interval (Table 1). Parameter aA was then determined iteratively fromVf=Vfmax within each generation, according to the actual distribution of midparent BLUP values.
Generation of recruitment progenies: The additive effect of each progeny was randomly sampled from NormalðaFS;0:5VAPð10:5ðFf1FmÞÞÞ, where Ff andFm
are inbreeding coefficients of female and male parents, respectively. Each progeny genotype was replicated by eight clonal copies (ramets), where the environmen-tal effect for each ramet was drawn randomly from
TABLE 1
Description of individual simulation scenarios (1–10)
Scenario Vf/Vfmax Note
Variance of family sizes
1 0 Equal family sizea
2 23105
3 13103 Y
4 23103
5 13102 Imbalance
6 1.253102
7 23102 Y
8 53102
9 33101
10 1 MaximumVfb
The particular values ofVf/Vfmax simulated were selected experimentally to cover the entire range of variation in family size. Each scenario corresponds to a specified variance in fam-ily sizes (Vf) relative to the maximum possible variance in fam-ily sizes (Vfmax). The total number of progenies (NRP) was 720 in all scenarios. The distribution of family sizes was varied, bounded by two extremes:
a
Size of each family was 30 (NRP/Nf). b
Normal(100, VE). A constant testing environment
was assumed throughout all generations, and the cause of all variability among ramets was assumed to be environmental.
Selection: After generation of the recruitment pop-ulation, input files for the ASReml software were up-dated (to include information on all individuals in the pedigree, including founders, their polycross proge-nies, and all selection candidates in all generations). ASReml was then run to predict BLUP values of selec-tion candidates (current recruitment populaselec-tion). Group-merit selection (Lindgrenand Mullin1997) was then
performed to select the next-generation breeding pop-ulation from the recruitment poppop-ulation. The selection algorithm maximized iteratively the population merit:
Bv¼gvcQv, whereBvis the group merit of a selected
setv;gvis the average BLUP value of the set;Qvis the
group coancestry of the set; andc is a weighting con-stant. Group coancestry is the average of all pairwise coancestries, including self-coancestry and reciprocals. It is the probability that two genes taken at random from the gene pool, with replacement, are identical by descent (Cockerham 1967). The weighting constant
was set to a very large value, forcing the group-merit selection algorithm to minimize group coancestry of the selected set of trees (next-generation BP). Under the majority of scenarios, this is equivalent to selecting exactly two individuals (with the highest BLUP values) from each full-sib family (balanced within-family selec-tion). At a higher degree of imbalance (when some family sizes are less than two), the algorithm would select additional individuals within the available families (some families contributing more than two), while minimizing the group coancestry of the selected group. Production population:Genetically improved plant-ing stock is commonly derived from a production population, such as a seed orchard, selected as a subset of the breeding population. The six trees with highest BLUP values irrespective of their coancestry were se-lected for the production population. The purpose was to test the ability of the breeding population to support a production population (the breeder’s target) and to determine the proportional gene diversity of these best clones.
Mixed-inheritance model:Additional simulation sce-narios were run using a ‘‘mixed-inheritance’’ model. The purpose of this model was to investigate whether the main conclusions of this study would be significantly altered by the presence of a single, biallelic, major-gene locus, contributing up to 10% of the additive genetic variance in the quantitative trait. The simulation was im-plemented as described by Gomez-Rayaand Klemetsdal
(1999). The phenotypic value (P) was composed of three independent componentsP ¼AM1AP1E, where AM is the additive effect of a major gene,APis the additive effect due to a large number of polygenic loci, each with a small effect (polygenic background), and E is the residual
deviation. The phenotypic variance (VP) can be expressed asVP¼VAM1VAP1VE, whereVAMandVAPare the additive
variances (referring to the base unselected population) due to the major-gene component (VAM¼2pð1pÞa
2)
and the polygene component, respectively (pis the initial gene frequency of allele M1 at the major-gene locus).
The effect of a major gene (ffiffiffiffiffiffiffiffiffiffiffiffiffiffiffiffiffiffiffiffiffiffiffiffiffiffiffiffiffiffiffiffiffiffiffi a) was calculated as a¼ lh2V
P=2pð1pÞ
p
, wherelis the proportion of the ad-ditive variance explained by the major-gene component [l¼VAM=ðVAM1VAPÞ], andh
2is the narrow-sense
herita-bility [h2 ¼ ðV
AM1VAPÞ=VP]. Simulation scenarios were
run atl¼0:1, where it was assumed thatlwas constant through all generations. VAP was calculated as VAP ¼ h2V
PVAM. To generate the founder population, alleles
at the major-gene locus were sampled randomly from the allelic pool with a frequency of theM1allelep¼0.1. The
additive effect of the major gene was thena forM1M1
and aforM2M2genotypes. To generate progenies,
al-leles at the major-gene locus were sampled from parental genotypes with the probability 0.5.
Simulation and evaluation of results: The process described above was repeated over 12 generations for each simulation scenario. Each scenario (unique vari-ance in family sizes, presented in Table 1) was replicated by 250 independent runs (iterations). Parametric means across all iterations were calculated for each scenario along with 95% confidence intervals. The random num-ber generator used in this simulation was ‘‘MRG32k3a’’ (L’Ecuyer et al. 2002). Parametric means for each
scenario (average additive response, variance, and in-breeding) were plotted as a function of the resulting group coancestry in both the breeding and production populations.
RESULTS AND DISCUSSION
In this study, the redistribution of test resources among families by varying their sizes under fixed total test resources magnified the effect of PAM, which by itself provides a large enhancement of VA(BP),
particu-larly under low-selection-intensity scenarios (Baker
1973; De Lange 1974; Jorjani 1995; Rosvall and
Mullin 2003). The enhancement of VA(BP) observed
in this study exceeds the magnitude reported earlier under unbalanced mating schemes (Rosvall et al.
2003; Lstibu˚ rek et al. 2004). This conclusion holds
under infinitesimal model assumptions, as well as under the mixed-inheritance model with a single major-gene locus, contributing 10% of the additive major-genetic variance.
Simulation showed that the use of clonal replication in progeny testing was the primary factor giving rise to more accurate assessment of breeding values, facili-tating high within-family selection differentials and a stronger effect by PAM on expansion of additive vari-ance. The effect of clonal testing was more important
than the inclusion of the multigeneration relationship data set to the genetic evaluation by BLUP. This sup-ports the benefits of clonal assessment in progeny test-ing for forest tree breedtest-ing programs described by other authors (e.g., Shawand Hood1985; Russelland Loo
-Dinkins1993; Mullin and Park1994; Danusevicius
and Lindgren2002; Isiket al.2003).
The average distribution of family sizes in the fifth generation for scenarios 1–10 (as presented in Table 1) is depicted in Figure 2. This general trend in the dis-tribution of family sizes was also observed in earlier and later generations. For clarity in further discussion, sce-narios 1–6 are referred to as ‘‘balanced’’ and all re-maining scenarios (7–10) as ‘‘unbalanced.’’ The term ‘‘balance’’ in this context refers to balanced within-family selection (equal number of individuals selected from each family), as opposed to balanced distribution of test resources. This distinction between the balanced and unbalanced sets of scenarios is not completely accurate, because scenarios were evaluated across
mul-tiple independent simulation iterations, where each was unique in terms of the actual distribution of parental BLUP values. Balanced within-family selection was fa-cilitated by a high weighting on group coancestry during selection.
The reallocation of test effort among families had a significant effect on the BP.QBPincreased as a result of redistributing more progenies to higher-ranking fami-lies (Figures 3–5). The marginal increase inQBPunder balanced scenarios (0.021# QBP#0.024 in generation 3, 0.035# QBP# 0.046 in generation 6, and 0.062#
QBP#0.092 in generation 12) agrees with the finding of Rosvall et al. (2003) that keeping equal parent
contributions by means of balanced mating and selec-tion maintained the lowest QBP. After this point was exceeded (typically in scenario 7), some parents did not contribute to the next generation (i.e., family size equal to 0), which resulted in more progenies being selected from the fewer remaining families and consequently in a more rapid increase ofQBP. Even in these unbalanced Figure2.—Distribution of family sizes
scenarios,QBPwas minimized during the group-merit selection. Balanced scenarios also resulted in a much lower increase inQBPat generation shifts, compared to more imbalanced scenarios.QBP was not significantly altered when a mixed-inheritance model was consid-ered (Figures 3 and 4, dotted lines).
The average additive effect in the BP (ABP) increased under balanced scenarios (25.0# ABP# 26.9 in gen-eration 3, 60.2 # ABP # 63.9 in generation 6, and 124.6#ABP#136.2 in generation 12) and even more under unbalanced scenarios (Figure 3). The general increase in genetic response due to PAM is expected from the theory, because PAM induces gametic-phase disequilibrium, i.e., expands additive variance (the among-family component), which creates opportunities
for additional genetic response to selection (e.g., Crow
1986). In this model, the added unbalance induces a positive correlation between the expected family value and corresponding family size. Thus, higher selection differentials are achieved within families of higher ex-pected (midparent additive) values. This induces fur-ther expansion of additive variance in generations that follow, but also more efficient conversion of variance into genetic gains. Interestingly, ABP in earlier gener-ations under unbalanced scenarios reached, and poten-tially exceeded, gains in later generations generated under more balanced scenarios. Thus, for example, in the fourth generation,ABP¼69.98 (scenario 9), exceed-ing ABP in the sixth generation (ABP ¼ 69.1654 in scenario 6). This, of course, assumes complete absence Figure3.—Average additive effect (ABP) and group
coan-cestry QBP in breeding population (BP) in generations 3, 6, and 12. Lines connect individual scenarios described in Table 1, such that the variation in family sizesVf increases (in individual scenarios) from the left to the right in the graph. The number of each scenario is presented at each point. Initial values ofh2¼0.3 andl¼0 are shown. Identical
scenarios but withl ¼0.1 are represented by dotted lines. Confidence intervals at the 95% level are presented around each average of 250 simulation iterations.
Figure4.—Additive varianceVA(BP)and group coancestry QBPin breeding populations (BP) in generations 3, 6, and 12. Lines connect individual scenarios described in Table 1, such that the variation in family sizesVfincreases (in individual sce-narios) from the left to the right in the graph. The number of each scenario is presented at each point. Initial values ofh2¼
0.3 andl¼0 are shown. Identical scenarios but withl¼0.1 are represented by dotted lines in the top part. Confidence intervals at the 95% level are presented around each average of 250 simulation iterations.
of inbreeding depression, which could adversely affect the additive response under unbalanced scenarios, de-pending upon the distribution and magnitude of the depression (Williams and Savolainen 1996). Since
generation intervals in forest trees are measured in decades, results for generations 3–6 are of greatest prac-tical importance. Results for generation 12 are pre-sented primarily from academic interest and should be interpreted with caution.
The additional expansion of additive variance in the
BP (VA(BP)) due to the redistribution of family sizes was
most pronounced under balanced scenarios (Figure 4). In generation 3, the maximum enhancement ofVA(BP) was observed in scenario 5 [VA(BP) ¼279.8, compared withVA(BP)¼202.3 in scenario 1]; the same was true also
in generation 6 [VA(BP)¼439.7, compared withVA(BP)¼ 273.8 in scenario 1]; and eventually, maximum en-hancement ofVA(BP) in generation 12 was observed in scenario 4 [VA(BP) ¼ 1007.9, compared withVA(BP) ¼ 566.7 in scenario 1]. This suggests that the point of maximum enhancement shifts slowly to more balanced scenarios over multiple generations. Added imbalance (higherVfin scenarios 7–10) caused a sharp reduction
inVA(BP). In these unbalanced scenarios, some parents
would not contribute to subsequent generations, and, therefore, the variation of expected family means sharply drops for each unit of increase inVf(Bulmer
1985). Larger variation inVA(BP)among individual simu-lation iterations (assessed by confidence intervals) was observed at lower values ofQBP, while greater run-to-run similarity was achieved at a higherQBP.
There was a significant effect from the major gene on bothABPandVA(BP)(Figures 3 and 4, dotted lines).ABP was up to 10% lower (the difference was similar in all scenarios), while VA(BP) was up to 20% higher in the mixed-inheritance model. Higher VA(BP)is due to the presence of a segregating major-gene locus with an ef-fect that is substantially higher than individual efef-fects of remaining polygenic loci. ElevatedVA(BP)under bal-anced scenarios is then due to the variation of allelic frequencies at this locus responding to selection and drift (Falconerand Mackay1996). The probability of
eventual fixation of the favorable allele was higher in scenarios with greater imbalance (Figure 5); thus the difference inVA(BP)due to the major gene locus almost disappeared with added unbalance. Since information on the major gene was not extracted (e.g., by genetic marker analysis) and incorporated into the genetic evaluation (which may actually happen in real breeding programs, particularly for QTL associated with smaller effects), and since there was zero correlation between the additive value due to a major-gene locus and the corresponding value due to polygenic loci, there was no additional genetic response due to the presence of a major gene.
The average inbreeding in the BP (FBP) in gener-ations 1 (founder population) and 2 was equal to 0. Following the mating of individuals in the second-generation breeding population, FBP reached a value of 0.05 in the third generation under balanced scenarios and of up to 0.25 in scenario 10 (Figure 5). Values of FBPin later generations varied from 0.18 to 0.88; however, FBP under balanced scenarios was still within a much narrower interval (0.18–0.22). The in-crease inFBPwhen progressing through generations was again more pronounced under imbalanced scenarios and minimal under balanced scenarios. An increase in
FBPwhen progressing through balanced scenarios (1–6) is a consequence of the assortment of mated individuals with no avoidance of mating among full-sibs, as per-formed in this study. The likelihood of mating among selected full-sibs depends to a certain extent on sizes of Figure5.—Average inbreeding coefficientF
(BP)and group coancestryQBPin breeding populations in generations 3, 6, and 12. Lines connect individual scenarios described in Table 1, such that the variation in family sizesVfincreases (in indi-vidual scenarios) from the left to the right in the graph. The number of each scenario is presented at each point. Initial val-ues ofh2¼0.3 andl¼0 are shown. Confidence intervals at
higher- and lower-ranking families and the variation among the top two selections (full-sibs) from these families. Although FBP was marginally higher in the mixed-inheritance model, the difference was not significant.
Narrow-sense heritability (h2) is one of the main
factors influencing the effectiveness of PAM (Falconer
and Mackay 1996; Lynch and Walsh 1998) and its
impact was further enhanced in this study by the use of clonal replication in progeny testing. Results described so far were obtained for scenarios where the initial value ofh2was set to 0.3. The maximum observed
enhance-ments ofVA(BP)whenh2¼0.3 were 138, 161, and 178% over that in the completely balanced scenario (scenario 1) in generations 3, 6, and 12, respectively. The cor-responding maximum enhancements in generation 6 were 135% whenh2¼0.1 and 177% whenh2¼0.5. As for
VA(BP),ABPalso increased withh2(ABP¼24.4 whenh2¼
0.1,ABP¼60.9 whenh2¼0.3, andABP¼89.6 whenh2¼ 0.5 in generation 6 of scenario 1). The increase inABP at the limit of balanced scenarios (scenario 6) was 104– 106% of that in scenario 1 in the studied range ofh2.F
BP presented in Figure 5 was not significantly altered by lower (h2¼0.1) or higher (h2¼0.5) initialh2values.
Given that only the effect of PAM on the enhance-ment ofVA(BP)would be of interest to the breeder, this variable-family-size approach would seem very straight-forward. Nevertheless, this extra enhancement of vari-ance in the BP influences the likelihood of mating among selected full-sibs, following the assortment of the BP. This may affect theFBP, reducing the within-family portion of the additive variance and thus reducing the intensity of within-family selection and eventual re-duction in additive response in the BP.
Similar to the BP,QPPwas only slightly influenced by variation in family sizes up to the limit of balanced scenarios (Figure 6).QPPincreased more progressively at higher levels of imbalance. The average additive effect (genetic gain) in the production population (PP)
(APP) responded greatly to the increase in variance in
family sizes. APP increased under balanced scenarios (46.4#APP#51.0 in generation 3, 84.6#APP#92.8 in generation 6, and 157.3# APP# 169.7 in generation 12). Although higher values of APP were observed in scenarios 7–10, these are of less practical interest due to the rapid increase of QBP and FBP. At h2 ¼ 0.1 and generation 6, there were 9.3 and 12.8% additionalAPP’s, in scenarios 6 and 7, respectively (Figure 7). Ath2¼0.5,
the additionalAPP’s were 9.9 and 13.1%, in scenarios 6 and 7, respectively. Thus, for the entire range of h2
studied, there were.9% extra APP in scenario 6 and .12% extraAPPin scenario 7 in generation 6, due to the reallocation of testing effort in the BP, with minimal increase ofQBPandFBP. These results hold also for the mixed-inheritance model (evaluated ath2¼0.3), where
the advantage inAPPdue to the added imbalance was .11% in scenario 6 and.13% in scenario 7.
Alternatively, other forms of deployment of superior genetic material selected from BP could be considered (e.g., deployment of full-sib families or clones). Our attempt, though, was to provide more general descrip-tion of the accumulated additive response and the average relatedness among these best clones, without imposing assumptions on the actual form of their deployment. In reality, a number of breeding tions could contribute to any given production popula-tion (McKeandand Beineke1980; Rosvallet al.1999;
Ruotsalainenand Lindgren2000), resulting in a
mix-ture of selections with a higher census number and with a lower level of relatedness than that presented in this study.
An additional comparison was performed with the unbalanced mating strategy with equal family sizes
Figure6.—Average additive effectA
PPand group coances-tryQPPin the production population (PP) in generations 3, 6, and 12. Lines connect individual scenarios described in Table 1, such that the variation in family sizes Vf increases (in individual scenarios) from the left to the right in the graph. The number of each scenario is presented at each point. Initial values ofh2¼0.3 andl¼0 are shown.
Confi-dence intervals at the 95% level are presented around each average of 250 simulation iterations.
(UM) proposed by Rosvallet al.(2003). The
variable-family-size approach presented in this study did not outperform the UM strategy. In the PP, bothAPPand
QPP were of a similar magnitude. We attribute this similarity primarily to a lower frequency of mating among selected full-sibs in the UM strategy (within the distinct hierarchical groups), as all families are of equal size, resulting in greater similarity among selected groups of full-sibs, and consequently greater dispersion of individuals, following their assortment. Thus, even though the enhancement ofVA(BP)was more efficient
using the variable-family-size approach and lower in the UM strategy, the lowerFBPin the latter led to a smaller reduction in the within-family portion of additive var-iance, resulting in4% extra additive response in the BP. On the other hand, the variable-family-size ap-proach led to a lower value ofQBP, by retaining a larger share of lower-ranking individuals in the BP contribut-ing to subsequent generations (Figure 2).
This study suggests that allocating resources during PAM according to midparent breeding values may greatly enhance genetic gains in forest plantations while causing a minimal increase ofQBPandFBP. To reach a reasonable point of balance betweenQBP,FBP, andAPPin the BP, we suggest minimizing the parameter aA (i.e., maximizing Vf) under a restriction where an equal number of progenies are selected from each family (balanced within-family selection; the size of the lowest-ranking family is at least two under single-pair mating). Reducing aA below this limit would provide an addi-tional boost ofAPP, but would also be accompanied by a much greater increase in QBP and FBPper unit of in-crease ofAPP. The findings of this study are of particular relevance to the breeding program of Norway spruce in
Sweden, which is characterized by equal parental con-tributions. Reallocating available resources in this pro-gram as proposed would provide additional genetic gain for newly established forest plantations, but would not reduce the potential for sustainable production in the long term.
The group-merit selection method used in this study was constrained to maximize gene diversity in the BP, and genetic progress was primarily a consequence of strong within-family selection, facilitated by clonal rep-lication of the recruitment population. Future research may demonstrate a larger genetic response per unit of gene diversity when this selection constraint on BP di-versity is slightly relaxed (Rodrı´guez2000).
We thank Dag Lindgren and Ola Rosvall for their valuable com-ments during the development of the study and Arthur Gilmour, Gary Hodge, and Salvador Gezan for their generous assistance with the ASReml software. We also thank the associate editor and two anon-ymous reviewers for their many recommendations and improvements to the article. We gratefully acknowledge financial support from the Fo¨reningen Skogstra¨dsfo¨ra¨dling (Swedish Tree Breeding Associa-tion), CellFor, and the North Carolina State University-Industry Coop-erative Tree Improvement Program.
LITERATURE CITED
Baker, R. J., 1973 Assortative mating and artificial selection. Heredity31:231–238.
Bulmer, M. G., 1985 The Mathematical Theory of Quantitative Genetics. Clarendon Press, Oxford.
Cockerham, C. C., 1967 Group inbreeding and coancestry. Genetics56:89–104.
Crow, J. F., 1986 Basic Concepts in Population, Quantitative, and
Evolutionary Genetics.W. H. Freeman, New York.
Danell, O¨ ., 1995 Breeding programs in Sweden. 1. General approach. SkogForsk. Arbetsrapport302:1–4.
Danusevicius, D., and D. Lindgren, 2002 Efficiency of selection based on phenotype, clone and progeny testing in long-term breeding. Silvae Genet.51:19–26.
DeLange, A. O., 1974 A simulation study of the effects of assortative mating on the response to selection.Proceedings of the 1st World Congress on Genetics Applied to Livestock Production, Vol. III, pp. 421–425. Editorial Garsi, Madrid.
Falconer, D. S., and T. F. C. Mackay, 1996 Introduction to
Quanti-tative Genetics.Longman, Harlow, UK.
Gilmour, A. R., B. J. Gogel, B. R. Cullis, S. J. Welham and R. Thompson, 2002 ASReml User Guide Release 1.0. VSN International, Hemel Hempstead, UK.
Gomez-Raya, L., and G. Klemetsdal, 1999 Two-stage selection strategies utilizing marker-quantitative trait locus information and individual performance. J. Anim. Sci.77:2008–2018. Grundy, B., B. Villanuevaand J. A. Woolliams, 1998 Dynamic
selection procedures for constrained inbreeding and their con-sequences for pedigree development. Genet. Res.72:159–168. Isik, F., B. Li, J. Framptonand B. Goldfarb, 2003 Efficiency of
seedlings and rooted cuttings for testing and selection in Pinus taeda. For. Sci.50:44–53.
Jorjani, H., 1995 Genetic studies of assortative mating in selected and unselected populations. Ph.D. Thesis, Swedish University of Agricultural Sciences, Uppsala, Sweden.
Kang, H., 1989 Inbreeding effective population size under some artificial selection schemes. II. Normal distribution of breeding values. For. Sci.35:303–318.
Kang, H., and G. Namkoong, 1988 Inbreeding effective population size under some artificial selection schemes. I. Linear distribu-tion of breeding values. Theor. Appl. Genet.75:333–339. Karlson, B., and O. Rosvall, 1993 Breeding programmes in
Sweden 3. Norway spruce, pp. 135–141 in Progeny Testing and
Figure 7.—Production population (PP) in generation 6.
Average additive effect (APP) as a function of group
coances-try (QPP) is shown. Lines connect individual scenarios de-scribed in Table 1, and the variation in family sizes Vf increases (in individual scenarios) from the left to the right in the graph. The number identifying each scenario is pre-sented at each point. Values of h2 ¼ 0.1, 0.3, and 0.5 at
l¼0 andh2¼0.3 atl¼0.1 are shown. Confidence intervals
Breeding Strategies: Proceedings of the Nordic Group of Tree Breeding, edited by S. J. Lee. Forestry Commission, Edinburgh.
L’Ecuyer, P., R. Simard, E. J. Chenand W. D. Kelton, 2002 An objected-oriented random-number package with many long streams and substreams. Oper. Res.50:1073–1075.
Lindgren, D., 1986 How should breeders respond to breeding values? Proceedings of the IUFRO Conference Joint Meeting: Working Parties on Breeding Theory, Progeny Testing, Seed Orchards, North Carolina State University-Industry Cooperative Tree Improvement Program, Raleigh, NC, pp. 361–371. Lindgren, D., and T. J. Mullin, 1997 Balancing gain and
related-ness in selection. Silvae Genet.46:124–129.
Lstibu˚ rek, M., T. J. Mullin, D. Lindgren and O. Rosvall, 2004 Open-nucleus breeding strategies compared to population-wide positive assortative mating. II. Unequal distribution of testing effort. Theor. Appl. Genet.109:1169–1177.
Lynch, M., and B. Walsh, 1998 Genetics and Analysis of Quantitative
Traits.Sinauer Associates, Sunderland, MA.
Mahalovich, M. F., 1990 Modelling positive assortative mating and elite populations in recurrent selection programs for general combining ability. Ph.D. Thesis, North Carolina State University, Raleigh, NC.
McKeand, S., and F. Beineke, 1980 Sublining for half-sib breeding populations of forest trees. Silvae Genet.29:14–17.
Meuwissen, T. H. E., 1997 Maximizing the response of selec-tion with a predefined rate of inbreeding. J. Anim. Sci.75:
934–940.
Mrode, R. A., 1996 Linear Models for the Prediction of Animal Breeding
Values.CAB International, Wallingford, Oxon, UK.
Mullin, T. J., and Y. S. Park, 1994 Genetic parameters and age to age correlations in clonally replicated test of black spruce. Can. J. For. Res.24:2330–2341.
Mullin, T. J., and Y. S. Park, 1995 Stochastic simulation of popula-tion management strategies for tree breeding: a new decision-support tool for personal computers. Silvae Genet.44:132–141. Namkoong, G., H. C. Kangand J. S. Brouard, 1988 Tree Breeding:
Principles and Strategies(Monographs on Theoretical and Applied Genetics 11). Springer-Verlag, New York.
Rodrı´guez, L. S., 2000 Balanced vs. slightly unbalanced selection. Heredity84:685–691.
Rosvall, O., 1999 Enhancing gain from long-term forest tree breeding while conserving genetic diversity. Ph.D. Thesis, Swedish University of Agricultural Sciences, Umea˚, Sweden. Rosvall, O., and T. J. Mullin, 2003 Positive assortative mating with
selection restrictions on group coancestry enhances gain while conserving genetic diversity in long-term forest tree breeding. Theor. Appl. Genet.107:629–642.
Rosvall, O., D. Lindgrenand T. J. Mullin, 1999 Sustainability ro-bustness and efficiency of a multi-generation breeding strategy based on within-family clonal selection. Silvae Genet.47:307–321. Rosvall, O., T. J. Mullinand D. Lindgren, 2003 Controlling par-ent contributions during positive assortative mating and selec-tion increases gain in long-term forest tree breeding. For. Genet.10:35–53.
Ruotsalainen, S., and D. Lindgren, 2000 Stratified sublining: a new option for structuring breeding populations. Can. J. For. Res.30:596–604.
Russell, J. H., and J. A. Loo-Dinkins, 1993 Distribution of testing effort in cloned genetic tests. Silvae Genet.42:98–104. Shaw, D. V., and J. V. Hood, 1985 Maximizing gain per effort by
using clonal replicates in genetic tests. Theor. Appl. Genet.71:
392–399.
Shepherd, R. K., and B. P. Kinghorn, 1998 A tactical approach to the design of crossbreeding programs. Proceedings of the 6th World Congress on Genetics Applied to Livestock Production, Armidale, Australia, Vol. 25, pp. 431–438.
Wei, R.-P., and D. Lindgren, 1995 Optimal family contributions and a linear approximation. Theor. Popul. Biol.48:318–332. Williams, C. G., and O. Savolainen, 1996 Inbreeding depression in
conifers: implications for breeding strategy. For. Sci.42:102–117. Woolliams, J. A., and R. Thompson, 1994 A theory of genetic
con-tributions. Proceedings of the 5th World Congress on Genetics Applied to Livestock Production, Guelph, Ontario, Canada, Vol. 19, pp. 127–134.