Analysis of a Microgrid with Solar and Wind
Energy Systems
J.Vijaychandra1, Dr.D.Vijaya Kumar2, B.Trinatha3
P.G. Student, Department of EEE, AITAM Engineering College (Autonomous), Andhra Pradesh, India1
Professor, Department of EEE, AITAM Engineering College (Autonomous), Andhra Pradesh, India2
Asst. Professor, Department of EEE, AITAM Engineering College (Autonomous), Andhra Pradesh, India3
ABSTRACT:This paper presents the analysis and operation strategies for a microgrid by using the hybrid systems. A hybrid system includes the combination of different systems such as wind-diesel, solar-diesel, solar-wind etc., but in this paper a solar-wind system was used for the analysis of a microgrid. A current source interface cuk converter is used to integrate the renewable energy sources to the main DC bus. In this paper, a direct driven PMSG is used with a variable speed control method whose strategy is to capture the maximum wind energy below the rated wind speed. Incremental conductance method has been implemented to track the maximum power in case of solar panels.As a case study, a 30 kw wind-solar hybrid power system model was examined and the analysis was carried out using MATLAB/SIMULINK.
KEYWORDS:Pv system, wind system, cuk converter
I. INTRODUCTION
Looking at sustainable energy solutions to preserve the earth for the future generations ,Other than hydro power, wind and photovoltaic energy holds the most potential to meet our energy demands. Alone, wind energy is capable of supplying large amounts of power but its presence is highly unpredictable as it can be here one moment and gone in another. Similarly, solar energy is present throughout the day but the solar irradiation levels vary due to sun intensity and unpredictable shadows cast by clouds, birds, trees, etc. The common inherent drawback of wind and photovoltaic systems are their intermittent natures that make them unreliable. However, by combining these two intermittent sources and by incorporating maximum power point tracking (MPPT) algorithms, the system’s power transfer efficiency and reliability can be improved significantly. The proposed microgrid is also equipped with energy storage devices such as batteries. The hybrid system, unlike conventional systems, considers the stability and dispatch-ability of its power injection into the grid. The hybrid system can operate in three different modes, which include normal operation without use of battery, dispatch operation, and averaging operation. A wind turbine system model was developed and compared with a real system. Using MPPT we can obtain maximum power from wind source. Maximum Power Point Trackers utilize some type of control circuit or logic to search for this point and thus to allow the converter circuit to extract the maximum power available circuit. Due to the similarities of the shape of the wind and PV array power curves, a similar maximum power point tracking scheme known as Incremental conductance method strategy is often applied to these energy sources to extract maximum power.
II. RELATED WORK
applications and fewer constraints in terms of location. The output of wind systems is very dependent on wind speeds. Places with low or medium wind speeds will produce expensive electricity. Besides, wind systems aren’t used in urban and suburban environments (due to reasons related with safety, obstructions and aesthetics).Onshore wind energy represents more than 10% of the electricity consumed in some regions of Denmark, Spain, German or Sweden. Its growth over the last decade has been spectacular. Most of this electricity is produced by large turbines. Trends point to a growing importance of the offshore wind energy segment. Most of the highest goals on renewable energy production are based on offshore.
SOLAR AND WIND ENERGIES:
Solar energy has been the greatest potential of all the sources of all the sources of renewable energy and if only small amount of this form of energy can be used. Solar energy can be a major source of power. Its potential is 178 billion MW which is about 20,000 times the world’s demand. Solar energy could not be developed on a large scale. Sun’s energy can be utilized as thermal and PV’s. The former is currently being used for steam and hot water production.Electricity can be produced from the solar energy by photovoltaic solar cells, which convert solar energy directly to electricity. The heat from the solar energy can be used for buildings, using the absorption cooling principle operative in gas-fired refrigerators. Energy of wind can be economically used for the generation of electrical energy. In wind energy we get kinetic energy and wind energy converts the mechanical energy to electrical energy. Winds are caused from two main reasons:
Heating and cooling of the atmosphere which generates convection currents. Heating is caused by the absorption of solar energy on the earth’s surface and in the atmosphere.
The rotation of the earth with respect to atmosphere, and its motion around the sun.
EQUIVALENT CIRCUIT OF PV CELL:
The above figure shows the equivalent circuit of a PV cell. The open-circuit voltage Voc of the cell is obtained when the load current is zero, i.e., when I = 0, and is given by Voc=V+IRsh.
The shunt resistance (Rsh) is very large and the series resistance (Rs) is very small. Therefore, it is common to neglect these resistances in order to simplify the solar cell model. The resultant ideal voltage-current characteristic of a photovoltaic cell is given by the relation below.
ShSB S R I R V T Ak I R V q ph
I
I
I
0exp
1
It can be seen from the characteristics, that there is a unique point on the characteristics at which the photovoltaic power is maximum. This point is termed as the maximum Power Point (MPP). The power corresponding to this point is termed as power at maximum Power point (Pmpp) and the voltage as voltage at maximum power point (Vmpp). Due to high Cost of solar cells, it must be ensured that the photovoltaic array operates at all time to Provide maximum power output. Hence a maximum power point tracker must be used to track the maximum power of the system. This is commonly known as maximum power point tracking (MPPT).
INCREMENTAL CONDUCTANCE METHOD:
This method consists in using the slope of the derivative of the current with respect to thevoltage in order to reach the maximum power point. What advantage does MPPT give in the real world that depends on the array, their climate, and their seasonal load pattern It gives us an effective current boost only when the Vpp is more than about 1V higher than the battery voltage. In hot weather, this may not be the case unless the batteries are low in charge. In cold weather however, the Vpp can rise to energy use is greatest in the winter (typical in most homes) and they have cold winter weather, then the can gain a substantial boost in energy when the need it the most.
Fig: Incremental conductance Alogorithm
III. CONFIGURATION OF THE PROPOSED MICROGRID
Fig: Configuration of the proposed Microgrid
The above figure shows the configuration of entire proposed system used. It consists of Wind turbine and its controller along with PV module and its controller. A PMSG has been placed in the circuit and a three phase rectifier was placed as shown in the figure. A CUK converter is placed and the energy system storage block is placed for the storage purpose. A PWM inverter is placed in the system for the conversion purpose and an LC filter is used to make the system ripple free.
The model is based on the steady-state power characteristics of the turbine. The stiffness of the drive train is infinite and the friction factor and the inertia of the turbine must be combined with those of the generator coupled to the turbine. The output power of the turbine is given by the following equation.
wind
V
c
P
m
p(
,
)
2A 3Permanent Magnet Synchronous Generator is a type of Synchronous Generator which its excitation field is a permanent magnet instead of a coil. Synchronous Generators are the primary source of all electrical energy and commonly used to convert the mechanical power output of steam turbines, gas turbines, reciprocating engines, hydro turbines and wind turbines into electrical power for the grid. They are known as synchronous generators because they operate at synchronous speed. The speed of the rotor always matches supply frequency.
ĆUK Converter:
In a CUK converter, there is an inductor at the input side and it will acts as a filter for the input dc supply and reduces the harmonic content. In a buck-boost converter, the energy transfer is associated with the Inductor but in CUK converter, energy transfer is associated with the capacitor.
Fig: CUK converter
Storage system model:
The ESS in this microgrid is controlled to regulate the main dc bus voltage both when there is not sufficient power production from the wind generator and PV modules and when there is excess local power production to charge the batteries.
PWM Inverter Control:
The primary goal of a PWM inverter controller is to regulate three-phase local ac bus voltage and frequency in this microgrid and to dispatch target active power to the distributiongrid, which may be set by users or grid operators. For these purpose,
based current control is used in the PWM inverter.
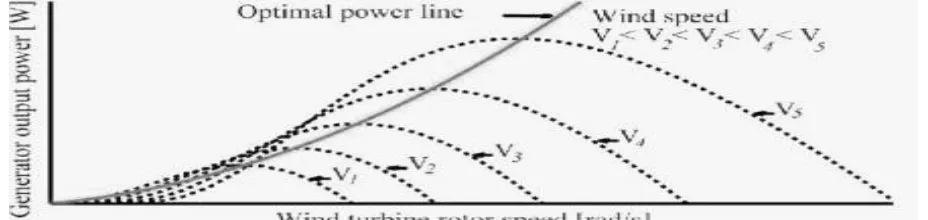
Wind Turbine: Variable Speed Control:
The maximum wind energy below the variable rated wind speeds will be captured by using this control strategy. The below figure shows the mechanical power captured by the wind turbine blades at each rotor speed of the wind turbine and the various wind speeds.
The optimal power line which was shown will be obtained by connecting MPPs at each wind speed. Hence the operation of the wind turbine at the optimal rotor speed on the optimal power curve ensures that the wind turbine captures the maximum wind energy below the rated wind speeds.
IV. SIMULATION RESULTS
Figure shows the Power generation in the system when connected to the grid.Lp represents Load Power,Bp represents Battery Power,Wp represents Wind Power and Sp represents Solar Power.
Figure shows the relative variation curve of actual wind current and the reference current.It starts from the starting point and attains a constant value at one instant.
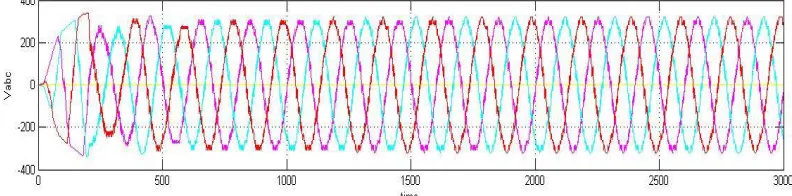
Figure shows the output Voltage at the load side inverter in volts. The voltage output which is obtained by the solar and wind energy systems is DC and hence an inverter is placed to convert this DC into AC output.
V. CONCLUSIONS
REFERENCES
[1] Litos Strategic Communication, “The smart grid: An introduction 2008, pp. 1–43, Prepared for the U.S. Department of Energy.
[2] C. Yaow-Ming, L. Yuan-Chuan, H. Shih-Chieh, and C. Chung-Sheng, “Multi-input inverter for grid-connected hybrid PV/Wind power system,”
IEEE Trans. Power Electron., vol. 22, no. 3, pp. 1070–1077, May 2007.
[3] Athimulam Kalirasu and Subharensu Sekar Dash (2010) “Simulation ofClosed Loop Controlled Boost Converter for Solar Installation,”
SERBIANJOURNAL OF ELECTRICAL ENGINEERING, Vol. 7, No. 1.
[4] Azadeh Safari and Saad Mekhilef (2011) “Simulation and HardwareImplementation of Incremental Conductance MPPT with Direct Control
Method Using Cuk Converter”, IEEE Transaction on Industrial Electronics,Vol.58, no.4.
[5] C. Liu, K. T. Chau, and Z. Xiaodong, “An efficient wind-photovoltaic hybrid generation system using doubly excited permanent-magnet
brushless machine,” IEEE Trans. Ind. Electron., vol. 57, no. 3, pp. 831–839, Mar. 2010.
[6] S.-K. Kim, J.-H. Jeon, C.-H. Cho, J.-B. Ahn, and S.-H. Kwon, “Dy-namic modeling and control of a grid-connected hybrid generation
system with versatile power transfer,” IEEE Trans. Ind. Electron., vol. 55, no. 4, pp. 1677–1688, Apr. 2008.
[7] S. Bae and A. Kwasinski, “Maximum power point tracker for a mul-tiple-input Ćuk dc-dc converter,” Proc. IEEE 31st INTELEC, vol. 20,
no. 2, pp. 398–405, Jun. 2005.
[8] B. G. Dobbs and P. L. Chapman, “A multiple-input DC-DC converter topology,” IEEE Power Electron. Lett., vol. 1, no. 1, pp. 6–9, Mar.
2003.
[9] A. Khaligh, C. Jian, and L. Young-Joo, “A multiple-input DC-DC converter topology,” IEEE Trans. Power Electron., vol. 24, no. 3, pp.
862–868, Mar. 2009.
[10] A. Kwasinski, “Identification of feasible topologies for multiple-input DC-DC converters,” IEEE Trans. Power Electron., vol. 24, no. 3, pp.
856–861, Mar. 2009.
[11] F. Valenciaga and P. F. Puleston, “Supervisor control for a stand-alone hybrid generation system using wind and photovoltaic energy,”
IEEETrans. Energy Convers., vol. 20, no. 2, pp. 398–405, Jun. 2005.
[12] S. Bae and A. Kwasinski, “Maximum power point tracker for a mul-tiple-input Ćuk dc-dc converter,” Proc. IEEE 31st INTELEC, vol. 20,
no. 2, pp. 398–405, Jun. 2005.
[13] B. G. Dobbs and P. L. Chapman, “A multiple-input DC-DC converter topology,” IEEE Power Electron. Lett., vol. 1, no. 1, pp. 6–9, Mar.
2003.
[14] A. Khaligh, C. Jian, and L. Young-Joo, “A multiple-input DC-DC converter topology,” IEEE Trans. Power Electron., vol. 24, no. 3, pp.
862–868, Mar. 2009.
[15] A. Kwasinski, “Identification of feasible topologies for multiple-input DC-DC converters,” IEEE Trans. Power Electron., vol. 24, no. 3, pp.
856–861, Mar. 2009.
[16] H. Matsuo, L. Wenzhong, F. Kurokawa, T. Shigemizu, and N. Watanabe, “Characteristics of the multiple-input DC-DC converter,” IEEE
Trans. Ind. Electron., vol. 51, no. 3, pp. 625–631, Jun. 2004.
BIOGRAPHY
Mr.J.Vijaychandra received his B.Tech Degree in Electrical and Electronics Engineering from Aditya Institute of Technology and Management, Tekkali, Andhra Pradesh, India in
2014. Currently pursuing M.Tech in Aditya Institute of Technology and
Management,(Autonomous), Tekkali, Andhra Pradesh, India. His paper was selected in a conference “IEEE scopes 2016” conducted in CUTM, Orissa, India. His research interests include Renewable energy systems and power electronics.