General Statistics of Stochastic Process of Gene Expression in Eukaryotic Cells
V. A. Kuznetsov*
,1G. D. Knott
†and R. F. Bonner*
*Laboratory of Integrative and Medical Biophysics, National Institute of Child Health and Human Development, National Institutes of Health, Bethesda, Maryland 20892-5772 and†Civilized Software, Silver Spring, Maryland 20906
Manuscript received January 5, 2002 Accepted for publication March 31, 2002
ABSTRACT
Thousands of genes are expressed at such very low levels (ⱕ1 copy per cell) that global gene expression analysis of rarer transcripts remains problematic. Ambiguity in identification of rarer transcripts creates considerable uncertainty in fundamental questions such as the total number of genes expressed in an organism and the biological significance of rarer transcripts. Knowing the distribution of the true number of genes expressed at each level and the corresponding gene expression level probability function (GELPF) could help resolve these uncertainties. We found that all observed large-scale gene expression data sets in yeast, mouse, and human cells follow a Pareto-like distribution model skewed by many low-abundance transcripts. A novel stochastic model of the gene expression process predicts the universality of the GELPF both across different cell types within a multicellular organism and across different organisms. This model allows us to predict the frequency distribution of all gene expression levels within a single cell and to estimate the number of expressed genes in a single cell and in a population of cells. A random “basal” transcription mechanism for protein-coding genes in all or almost all eukaryotic cell types is predicted. This fundamental mechanism might enhance the expression of rarely expressed genes and, thus, provide a basic level of phenotypic diversity, adaptability, and random monoallelic expression in cell populations.
G
ENE expression within a cell is a complex process lem (Bishopet al. 1974; Velculescu et al.1999). An involving chromatin remodeling, transcription, important current issue for gene identification is de-and export of RNA from the nucleus to the cytoplasm termining the true statistical distributions of the number where mRNA molecules are translated into proteins. of genes expressed atallpossible expression levels, both The physiological activity and cell differentiation of a ina single celland ina population of cells.Identification mammalian cell is controlled by 10,000 or more protein- of such distributions can provide a theoretical basis for coding genes associated withⵑ300,000–500,000 mRNA accurately counting the number of expressed genes and transcripts (Bishopet al.1974). Thecompletegene expres- the total number of genes in a given cell type and for sion profile for a given set of cells is the list of all ex- better understanding the mechanism(s) governing the pressed genes, together with each gene’s expression level expression of thousands of genes at very low levels. The defined as the average number of cytoplasmic mRNA similar problem of estimating the distribution of species transcripts per cell. Currently, gene expression profiling in a population or different alleles in a population has methods (e.g., serial analysis of gene expression (SAGE; been intensively discussed (see for references Huang Velculescuet al.1995, 1999), cDNA, or oligonucleo- andWeir2001).tide microarrays (Holstege et al.1998; Jelinsky and The statistics of expressed genes can be partially speci-Samson1999) measure gene transcripts from large num- fied by the proportions of expressed genes that have bers of cells (i.e., not a single cell) and cannot reliably one, two, etc. transcripts present in an associated mRNA detect the thousands of genes that are expressed at very sample (i.e., a normalized histogram of gene expression low copy numbers (less than two per cell). Many of these levels). Analysis of such empirical histograms using lower-level transcripts may be essential for determining large-scale gene expression databases leads to models normal and pathological cell phenotypes (Chenet al. of the underlying gene expression level probability
func-2000; Ohlsson et al. 2001). However, a rationale for tions (GELPF) in a cell and in a population of cells. an extreme number of rare transcripts has remained Interestingly, similar gene expression “patterns” in
dif-unresolved. ferent cells were observed⬎25 years ago by RNA-DNA
Determination of biologically significant expressed hybridization (Bishopet al.1974). These and more re-genes in eukaryotic cells is a challenging biological prob- cent gene expression data sets have demonstrated very broad ranges of gene transcript levels (i.e., from 0.1 to 20,000 transcripts per human cell; Bishop et al. 1974; 1Corresponding author:Laboratory of Integrative and Medical
Bio-Velculescuet al.1999). However, a suitable theoretical
physics, National Institute of Child Health and Human Development,
model of the distribution of gene expression levels in
NIH, Bldg. 13, Rm. 3W16, Bethesda, MD 20892-5772.
E-mail: [email protected] a cell has not been previously identified due to
sampling, unreliable detection of many low abundance to quantify their relative abundance in the cell sample. For each data set, we define its library as the list of transcripts, experimental errors, and ambiguities in the
identification of many transcripts. sequenced tags that match mRNAs associated with genes, together with the number of occurrences of each A large body of experimental and theoretical
litera-ture on molecular mechanisms of gene expression con- specific tag. Let M denote the size of the library, i.e., the total number of tags in it, and letn(m,M) denote trol makes it increasingly evident that stochastic
pro-cesses in transcription and translation machinery (as the number ofdistincttags that have the expression level
m (occurring m times) in the given library of size M.
well as within signaling pathways and cross talk between
different pathways) need to be considered to fully un- The observed value n˜(m, M) only approximates the number of expressed genes with expression levelmin derstand basic processes of gene expression. In
particu-lar, several experimental systems indicate that initiation the cell sample due to experimental errors, nonunique tag-gene matching, and incorrect annotation of genes of gene transcription is a discrete process in which many
individual protein-coding genes existing in an off state (see below). LetJdenote the observed expression level for the most abundant tag in the library;Jincreases with can be stochastically switched to an on state resulting
in the production of mRNAs in sporadic pulses (Ko the library sizeM.Then兺J
m⫽1n˜(m,M)⫽ Nis the num-ber of distinct tags in the library. The points (m,g(m)) 1992;Rosset al.1994;Newlandset al.1998;McAdams
andArkin1999;Hume2000;Sutherlandet al.2000; for m ⫽ 1, . . . J, where g(m) ⫽ n˜(m, M)/N, form the histogram corresponding to the empirical relative Ohlssonet al.2001;Sanoet al.2001).
In this study we present evidence that the functional frequency distribution of expressed genes. This is a size-frequency form of the empirical GELPF and it repre-form of the GELPF is invariant among eukaryotic cell
types. Stochastic and probabilistic mechanisms of the sents an estimate of the GELPF in the cell sample. We found that the empirical GELPF histograms, con-initiation of the gene expression process can help
ex-plain the observed universality of the GELPF across dif- structed for analyzed yeast SAGE libraries, mouse and human SAGE or cDNA libraries (Velculescuet al.1995, ferent cell types in a multicellular organism and across
different organisms. We describe a new distribution 1999;Lalet al.1999;Strausberget al.2000), as well as Affymetrix microarray samples for yeast cells (Jelinsky function and derive from it a probabilistic model of
the growth of a population (e.g., the number of all andSamson1999;Jelinskyet al.2000), exhibited simi-lar monotonically skewed shapes with a greater abun-transcripts) with many distinct classes (e.g., distinct
ex-pressed genes) in a complex system (e.g., observed SAGE dance of rarer transcripts and more gaps among the higher-occurrence expression levels (Figures 1 and 2). transcriptome for a population of homogeneous cells)
as sampling increases. This model allows us to predict Several classes of skewed probability functions [Pois-son, exponential, logarithmic series, simple power law, the frequency distribution of gene expression levels for
all genes and the total number of genes expressed in Pareto-like, and mixture of log-series and exponential (Johnsonet al.1993)] were fit (seemethods) to empiri-a representempiri-ative cell empiri-averempiri-aged over time. The model
exhibits predictive power even when the sequencing cal gene expression level histograms for ⬎50 human, mouse, and yeast SAGE libraries; 30 human cDNA librar-database is incomplete and contains ambiguity in
se-quence to gene assignments. ies in Cancer Genome Anatomy Project (CGAP) data-bases (http://www.ncbinlm.nih.gov/CGAP; http://www. ncbinlm.nih.gov/SAGE); and 30 microarrays of normal RESULTS
and treated yeast cells (http://www.hsph.harvard/gene expression;Holstegeet al.1998).
Distribution of the gene expression levels:We have
analyzed diverse large-scale gene expression databases The best fit by our criteria was obtained using the discrete Pareto-like probability function,
for different human tissues and cell lines (http://www. ncbi.nlm.nih.gov/UniLib; http://www.ncbi.nlm.nih.gov/
f(m)⫽z⫺1/(m⫹ b)k⫹1, (1)
UNIGENE; http://www.ncbi.nlm.nih.gov/CGAP/ncicgap;
http://www.ncbi.nlm.nih.gov/SAGE), mouse tissues where thef(m) is the probability that a randomly chosen distinct tag (representing a gene) occursmtimes in the (http://www.ncbi.nlm.nih.gov/UniLib), and yeast cells
(ftp://genome-ftp.stanford.edu.pub/yeast/tables/SAGE_ library. The functionf involves two unknown parame-ters,kandb, wherek⬎0 andb⬎ ⫺1; the normalization
Data; http://www.sagenet.org; http://www.hsph.harvard/
geneexpression) to identify the GELPF for eukaryotic factorzis the generalized Riemann zeta-function value,
z⫽ 兺J
j⫽11/(j⫹ b)k⫹1. We call Equation 1 the general-cells. These data sets have been created by three
dif-ferent technologies: sequencing of clones in comple- ized discrete Pareto (GDP) model. Note thatJ, the maxi-mum observed expression level, is a sample-size-depen-mentary DNA (cDNA) and SAGE libraries and
oligo-nucleotide microarray hybridization methods. These dent quantity J ⫽ J(M). The parameter k reflects the skewness of the probability function; the parameter b
techniques involve making cDNA sequences of the less
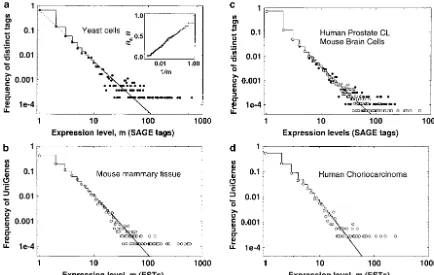
Figure1.—Empirical relative frequency distributions of the gene expression levels. Log-log plots are shown. (a)䊉, log-phase yeast cell growth library with 20,096 SAGE tags; solid step-function line, GDP model withk⫽ 0.974 ⫾0.004,b⫽ ⫺0.173 ⫾ 0.004; dotted line, simple power law withk⫽1.03⫾0.005. Inset plot:䊉, empirical cumulative fraction functionRevalues [Re⫽ (兺m
j⫽1j·n˜(j,M))/(N·M)]for the䊉histogram (main plot); the solid line is the corresponding theoretical modelR[R(m)⫽ (兺m
j⫽1j·f(j))/兺Jj⫽1j·f(j)] computed by the GDP model (main plot). (Cumulative data reduce the apparent “noise” in the histogram data.) (b)䊊, mouse mammary cells cDNA library 341 of size 36,675 ESTs; solid step-function line, GDP model with k⫽1.44⫾0.006,b⫽1.34⫾0.002. (c)䊉, human colon cancer cells SAGE library 2892.2 of size 22,637 tags; solid step-function line, GDP model for䊉data atk⫽1.08 ⫾0.030,b⫽ ⫺0.28 ⫾0.010;䊐, mouse brain (primary meduloblastoma) cells SAGE library 3871 of size 43,274 tags. (d)䊊, human choriocarcinoma cells cDNA library 2427 of size 10,087 ESTs; solid step-function line, GDP model withk⫽1.88⫾0.044,b⫽1.34⫾0.005.
line in Figure 1a). The inset plot in Figure 1a demon- allowed us to suggest that at least 45% of the known 6200 genes/ORFs are present but at⬍1 copy per cell. strates that the fitted GDP model predicts the empirical
cumulative fraction functionRe(m) (for the definition Table 1 clearly shows that the skewed GELPFs from such filtered Affymetrix data for yeast cells at different phases ofResee the Figure 1 legend); this demonstrates that
our model fits well over the entire range of experimental of cell life are all very similar and are all fitted by the GDP model down to 0.5 transcripts per cell.
values.
Figure 2 shows the frequency of the numbers of dis- Regardless of either the method used to generate the gene expression profile (SAGE, cDNA library sequenc-tinct open reading frames (ORFs)/genesvs.
hybridiza-tion signal intensity values for Affymetrix microarray ing, or oligonucleotide microarray hybridization) or the species studied, we have observed that the GDP func-hybridization data obtained for normal yeast cell
tran-scriptome (http://www.hsph.harvard/geneexpression; tional form fits the observed GELPFs. The parameters of the fitted GDP, however, show a significant depen-JelinskyandSamson1999). After subtraction of
back-ground noise, the total (digital) hybridization signal dence on sample size, specific eukaryote species, and methods used to generate the library (Table 1). intensity, s, was normalized to the typical number of
mRNA molecules per yeast cell (JelinskyandSamson Effect of library size on gene expression level
distri-bution:Similarly sized libraries made using the same
1999). The window plot in Figure 2 is the empirical
frequency distribution of the number of genes ex- method from many different human tissues and cell lines have similar numbers of distinct gene tags and are pressed atscopies per cell. It has a skewed form with
a long right-side tail and with a left-side tail down to characterized by empirical GELPFs with nearly equiva-lent parameters in their best-fit GDP models (see Table threshold levels of reliable detection of at least ⵑ0.5
copies per cell. The cooccurrence of the low-expressed 1). As the size of a library increases, the shape of the empirical GELPF changes systematically: (1)p1, the frac-genes/ORFs in three or more of the six analyzed
be-Figure 2.—The empirical fre-quency distribution of the hybrid-ization signal intensity values for Affymetrix microarray hybridiza-tion data for normal yeast cell genes/ORFs (Jelinskyand Sam-son 1999). We checked that the background noise intensity signals (䉭) were distributed with an ap-proximately normal distribution function with mean zero and stan-dard deviation 0.054. Intensity sig-nal distribution before (䊊) and after (䊉) subtraction of the back-ground noise from the signal val-ues is shown. The total hybridiza-tion signal intensity has been normalized (by Jelinsky and Samson1999) with respect to the mean number of mRNA mole-cules per yeast cell. A point (s, f(s)) on the major plot shows the number of genes/ORFs,f, which have the signal intensity value,s. The vertical discontinuous line in-dicates the lower bound of the “re-liably” detectable intensity signal values (the lower bound corre-sponds to 0.5 transcripts per cell). The window plot (log-log plot) shows the signal intensity distributions before and after subtraction of noise, shown over the full range of the positive signal intensity values.
comes smaller; (2)J increases in proportion toM; (3) or libraries 154 and 154.1 in Table 1 and Figure 3a). In the case of SAGE libraries for different human cell the parameterbbecomes larger; and (4) the parameter
kincreases and then slowly decreases (Figure 3; Table types, the Pearson correlation coefficient between the library sizes and the values of parameter b equals 0.9. 1). Despite significant variation in human tissue types
studied, the number of distinct tags, N, appears to be We observed that the values of parameter bapproach 0 as M increases at relatively small sample sizes (for essentially invariant for the similar-size SAGE libraries
(Figure 3b). Although the yeast genome is less complex, example,ⵑ10,000 SAGE tags, Table 1).
Although the Pareto-like models appear to fit empiri-yeast SAGE libraries behave similarly (Table 1; Figure
4a). We also found that for yeast, mouse, and human cal GELPFs down to the least transcript abundance ob-served (ⵑ0.2–0.5 copies per cell in yeast microarray SAGE and cDNA libraries, all values of the scaling
pa-rametera(a⫽J/M, which represents the frequency of experiments, Figure 2), theoretically these models dem-onstrate an unlimited increase in the number of species occurrence of the most common transcript within the
library or cell population) fall within narrow ranges (i.e., different expressed genes) as the sample size ap-proaches infinity. This contradicts the fact that there is a (Table 1). These observations suggest that all studied
cell types have a common skewed underlying probability finite number of different mRNAs (different expressed gene products). Thus these models must be considered function form.
Importantly, in so-called “scale-free” (or self-similar, at best empirical approximations of an underlying prob-ability. We have developed a construction model (see
i.e., any part of the system is statistically similar to the
whole) biological and physical systems, described by a methodsandappendix) for the underlying probability distribution. When this distribution is finitely sampled, simple power law (b ⫽ 0;j ⫽ ∞; k, z are the positive
constants), the parameterb⫽0 and the parameterkis the results fit by Pareto-like GELPFs. The model explic-itly exhibits the observed sample size dependence but assumed to be independent of the size of the system
(Stanley et al. 1999; Jeong et al. 2000; Gomez et al. retains a finite limit to the number of different classes as the sample size increases. Importantly, this model 2001). We did not observe such properties in the
GELPFs; they display a nonlinear, rather than linear assumes that eachexpressedgene has a positive probabil-ity of being observed in any given sample and also that trend in log-log coordinates and a sample-size
depen-dence. For example, Table 1 shows that the parameter the expression level for this gene is statistically indepen-dent of the expression levels for other genes. The
ex-bin the GDP model is significantly different from 0 for
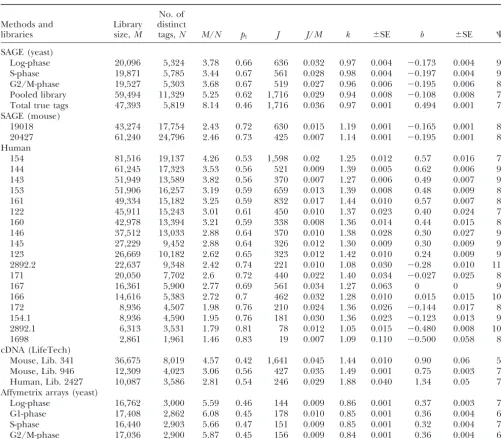
TABLE 1
Fitting of the empirical frequency distributions of the gene expression levels
No. of Methods and Library distinct
libraries size,M tags,N M/N p1 J J/M k ⫾SE b ⫾SE ⌿
SAGE (yeast)
Log-phase 20,096 5,324 3.78 0.66 636 0.032 0.97 0.004 ⫺0.173 0.004 9.3 S-phase 19,871 5,785 3.44 0.67 561 0.028 0.98 0.004 ⫺0.197 0.004 9.8 G2/M-phase 19,527 5,303 3.68 0.67 519 0.027 0.96 0.006 ⫺0.195 0.006 8.8 Pooled library 59,494 11,329 5.25 0.62 1,716 0.029 0.94 0.008 ⫺0.108 0.008 7.7 Total true tags 47,393 5,819 8.14 0.46 1,716 0.036 0.97 0.001 0.494 0.001 7.7 SAGE (mouse)
19018 43,274 17,754 2.43 0.72 630 0.015 1.19 0.001 ⫺0.165 0.001 8.6 20427 61,240 24,796 2.46 0.73 425 0.007 1.14 0.001 ⫺0.195 0.001 8.0 Human
154 81,516 19,137 4.26 0.53 1,598 0.02 1.25 0.012 0.57 0.016 7.1 144 61,245 17,323 3.53 0.56 521 0.009 1.39 0.005 0.62 0.006 9.8 143 51,949 13,589 3.82 0.56 370 0.007 1.27 0.006 0.49 0.007 9.5 153 51,906 16,257 3.19 0.59 659 0.013 1.39 0.008 0.48 0.009 8.9 161 49,334 15,182 3.25 0.59 832 0.017 1.44 0.010 0.57 0.007 8.3 122 45,911 15,243 3.01 0.61 450 0.010 1.37 0.023 0.40 0.024 7.1 160 42,978 13,394 3.21 0.59 338 0.008 1.36 0.014 0.44 0.015 8.2 146 37,512 13,033 2.88 0.64 370 0.010 1.38 0.028 0.30 0.027 9.3 145 27,229 9,452 2.88 0.64 326 0.012 1.30 0.009 0.30 0.009 9.3 123 26,669 10,182 2.62 0.65 323 0.012 1.42 0.010 0.24 0.009 9.3 2892.2 22,637 9,348 2.42 0.74 221 0.010 1.08 0.030 ⫺0.28 0.010 11 171 20,050 7,702 2.6 0.72 440 0.022 1.40 0.034 ⫺0.027 0.025 8.3
167 16,361 5,900 2.77 0.69 561 0.034 1.27 0.063 0 0 9.1
166 14,616 5,383 2.72 0.7 462 0.032 1.28 0.010 0.015 0.015 10 172 8,936 4,507 1.98 0.76 210 0.024 1.36 0.026 ⫺0.144 0.017 8.5 154.1 8,936 4,590 1.95 0.76 181 0.030 1.36 0.023 ⫺0.123 0.013 9.2 2892.1 6,313 3,531 1.79 0.81 78 0.012 1.05 0.015 ⫺0.480 0.008 10 1698 2,861 1,961 1.46 0.83 19 0.007 1.09 0.110 ⫺0.500 0.058 8.3 cDNA (LifeTech)
Mouse, Lib. 341 36,675 8,019 4.57 0.42 1,641 0.045 1.44 0.010 0.90 0.06 5 Mouse, Lib. 946 12,309 4,023 3.06 0.56 427 0.035 1.49 0.001 0.75 0.003 7.8 Human, Lib. 2427 10,087 3,586 2.81 0.54 246 0.029 1.88 0.040 1.34 0.05 7.1 Affymetrix arrays (yeast)
Log-phase 16,762 3,000 5.59 0.46 144 0.009 0.86 0.001 0.37 0.003 7.4 G1-phase 17,408 2,862 6.08 0.45 178 0.010 0.85 0.001 0.36 0.004 6.7 S-phase 16,440 2,903 5.66 0.47 151 0.009 0.85 0.001 0.32 0.004 7.0 G2/M-phase 17,036 2,900 5.87 0.45 156 0.009 0.84 0.001 0.36 0.004 6.9
Characterization of the empirical frequency distributions of the gene expression levels for yeast, mouse, and human cell-type libraries and goodness-of-fit analysis using the generalized discrete Pareto (GDP) model.Mis the number of tags (a size of the library);Nis the number of distinct tags.p1is the fraction of distinct tags represented by one copy in the library.Jis the maximum observed gene expression level in the library.kandbare the parameters of the GDP model.⌿is the goodness-of-fit criterion (seemethods).⌿ranges between excellent (11–8), very good (8–6), and satisfactory (6–4). Yeast SAGE libraries: cells on G2/ M-, S-, and log-phase stages of cell life; a pool of these three libraries; and a true tags library. Mouse SAGE libraries (Unilib IDs): 19018 (brain, meduloblastoma), 20427 (brain, normal, purified granular cell precursors). Human SAGE libraries (Unilib IDs): 154 (normal brain cells,⬎95% white matter), 144 [H1110, glioblastoma (GBM)], 143 [H392, GBM cell line (CL)], 153 (pooled GBMs), 161 (pooled normal brain), 122 (HCTT116, colon cancer CL), 160 (NHA, normal astrocyte CL), 146 (RKO, colon cancer CL), 145 (SW837, colon cancer CL), 123 (Caco2, colon cancer CL), 2892.2 (LNCaP, the prostate cancer CL library 2892 after 1 year), 171 (primary colon cancer), 167 (normal colon), 166 (normal colon), 172 (primary colon cancer), 154.1 (normal brain tissue, sublibrary taken from library 154), 2892.1 (LNCaP, initial library 2892), and 1698 (ovary carcinoma). cDNA libraries (Life Technologies method): mouse mammary cell library 341, mouse normal kidney library 496, and human choriocarcinoma cell library 2427. Affymetrix microarrays: normal yeast cells on log-, G1-, S-, and G2/M-phases of cell life (data from database http://www.hsph.harvard/geneexpression).
expected to show correlations within any given cell. expressed genes would likely be statistically insignifi-cant. Furthermore, since expression profiles are ob-However, the average correlation between expression
events driven by the same transcription factors would SAGE libraries (Velculescuet al.1997) of normal yeast have weaker correlations due to temporal and spatial cell samples show that at least 2000 yeast genes/ORFs fluctuations (e.g., chromatin dynamics) within a given are expressed, but at⬍0.5 copies per cell on average cell and certainly when averaged over a large population (see, for example, Figures 2 and 4b). At the level of the of cells. This assumption of essentially statistical inde- individual cell, these rare transcription events can be pendence among all transcription events in a popula- treated as stochastic events. A mathematical description tion of cells is consistent with experimental observations of our model of the GELPF is presented in methods (Chellyet al. 1989; Ko 1992; Ross et al. 1994; New- and theappendix.
landset al.1998;Fieringet al.2000;Sanoet al.2001). Analysis of the empirical GELPF using SAGE
data-Even for synchronized yeast cells arrested in G1-, S-, bases: Using the LG model (see Equations 3 and 4 and G2/M-phases of cell life, the empirical GELPFs in andmethodsfor a definition of the LG model) to fit microarray experiments were very similar to each other empirical population growth curves like those presented and to the GELPF observed for yeast cells in log-phase in Figure 3b, we can predict the frequencies of the gene of cell growth (see Table 1). These results suggest that expression levelsp1,p2, . . . , for a given cDNA or SAGE the shape of the empirical GELPFs is relatively robust library size (Figure 3c);pi is the probability that a ran-to different correlations between expressed genes at dom gene hasitranscripts. Application of the LG model least in normal yeast cells at different phases of cell to human SAGE databases results in extremely large life. In addition, our analyses of the seven microarray estimates (138,000 distinct tags expressed in brain and (JelinskyandSamson1999;Jelinskyet al.2000) data 127,000 expressed in a “typical” human tissue) com-sets for normal yeast cell samples and pooled three pared to the total number of genes in the genome (30,000–40,000 genes;International Human Genome Sequencing Consortium 2001; Venter et al. 2001; Kuznetsov 2002). This demonstrates the well-known discrepancy between the numbers of different ex-pressed sequences in SAGE or Unigene libraries and the number of human genes. This large discrepancy can be attributed to a variety of sources including se-quencing errors, multiple restriction sites on the same transcripts leading to multiple tags per gene, and alter-native splicing (Lalet al.1999;Velculescuet al.1999;
Chenet al. 2000;Stollberg et al.2000; Caron et al.
2001).
Analysis of errors in SAGE cell libraries and predic-tion of the number of expressed genes in a populapredic-tion
of cells:Without removing experimental errors in SAGE
libraries one cannot obtain an accurate estimate of the number of expressed genes,Nt, and the GELPF. Using our probabilistic model (Equations 2–5,methods), we developed a computational methodology to estimate the true GELPF for a SAGE library, even when the SAGE library is incomplete (contains only a fraction of all expressed genes for the sample cell type). Our method-ology is as follows.
1. We selected only tags whose location on the yeast chromosome map coincided with protein-coding gene or ORF regions (called here “true tags”). 2. We constructed population growth curves for the
numbers of different genes/ORFs found in the tag location database.
3. We fitted the growth curve for the numbers of dis-tinct genes/ORFs by Equations 3 and 4.
4. We calculatedNt, using Equation 5, and, finally, cal-culated the true underlining GELPF, using Equa-tion 2.
To validate this approach, we analyzed 11,329 yeast cell distinct SAGE tags representing 59,494 SAGE tags of the three yeast cell SAGE libraries (Velculescuet al.
1997, Table 1). Since almost all yeast protein-coding genes/ORFs and their location on chromosomes are known, we can obtain the true distinct tags and their expression levels in a yeast SAGE library by eliminating erroneous tags that fail to match known 3⬘NLaIII genes/ ORFs regions and adjacent 3⬘end regions presented in the chromosome tag location database (http: genome-http://www.stanford.edu/Saccharomyces). This database was generated byVelculescuet al.(1997) and currently Figure4.—Correction of the empirical histogram for yeast
cell SAGE library, the population growth curves, and the GELPF for a single yeast cell. (a) Log-log plot.䊐, number of
follows. For each ORF/gene, the scaled hybridization intensity distinct tags of 5303 distinct tags represented by 19,527 tags
in a G2/M phase-arrested cell library; dashed step-function signal value, I, in the yeast GeneChip database (http:// www.hsph.harvard/geneexpression,Jelinskyet al.2000), was line, the GDP model withb⫽ ⫺0.195 ⫾0.005,k⫽0.96 ⫾
0.006 for䊐data;䊏, number of true tags of the same library converted to a transcript count per cell using the empirical formulam⫽(I⫺20)/165, rounded to the nearest integer after removing erroneous tags; solid step-function line, GDP
model withb⫽0.207⫾0.013,k⫽0.991⫾0.011 for䊏data. ([0.5, 1.5), [1.5, 2.5), . . . ). The correction factor 20 is the average background intensity signal; the scaling factor 165 (b) Population growth curves.䊊, number of true distinct tags
of sublibraries from pooled yeast library of 47,393 true tags; was estimated by comparing the hybridization signal intensity values with expression levels of 18 genes, whose absolute dashed line, LG model withd⫽20,000⫾1946,c⫽0.356⫾
0.02 for䊊data;䊉, number of genes/ORFs observed in these mRNA levels were reliably determined by quantitative hybrid-ization experiments (IyerandStuhl1996) and observed in sublibraries; LG model withd ⫽6575 ⫾185, c⫽ 0.579 ⫾
0.01 for䊉data. (c) Log-log plot. Solid step-function line, the several normalized microarray hybridization data sets (Hols-tegeet al.1998; Jelinskyand Samson1999). These genes fraction of genes/ORFs estimated by the BD model for a
single yeast cellvs.expression level;䊉, relative frequencyvs. are RPS4BA, GCN4, SPT15, RAS2, RPO21, FAR1, DED1, HIS3, CDC28, TRP3, GAL11, HAT1, POL12, NUP157, PRP4, PRP3, expression level generated from the fitted GDP model (with
k⫽1.56,b⫽2.17) after 3000 random generations of occur- PEX14, and RAD52. Dashed line, the fitted GDP model graph withk ⫽0.86 ⫾0.01,b⫽0.37 ⫾0.003 for䊊 data. In this rence number valuem(seeSimulation of theoretical histograms
inmethods); 䊊, relative frequency of 3000 genes/ORFsvs. analysis, we excluded the genes/ORFs whose expression levels (after subtraction of the noise and normalization of the signal expression level in a single log-phase yeast cell, estimated from
Affymetrix microarray hybridization data (http://www.hsph. intensity to transcript count per cell) were⬍0.5 copy per cell (see Figure 2).
contains 8480 distinct tags, matching 4735 of ⵑ6200 also determined the GELPF on the basis of Affymetrix microarray data sets (JelinskyandSamson1999; Jelin-known yeast genes/ORFs. We found that 25% (2849
distinct tags) of the 11,329 analyzed distinct tags failed skyet al.2000). Figure 4c shows a histogram constructed for the microarray hybridization experiment (Jelinsky to match the yeast genome and these tags were
associ-ated with sequencing errors, 23.5% (2661 distinct tags) et al. 2000) for normal yeast cells. We converted the hybridization intensity signal values to gene expression failed to match ORFs and adjacent 3⬘end regions, and
51.4% (5819 distinct tags) were classified as the true values with 0.5 transcripts per cell chosen as a reasonable low-limit cutoff point (see also Figure 2). In this case, distinct tags. Also, we found that 1689 distinct tag
se-quences of the 2661 distinct failed tags matched anti- 3000 more highly expressed genes/ORFs representing
ⵑ16,000 transcripts per cell were found. Figure 4c shows sense sequences within 1504 genes/ORFs.
Figure 4a shows empirical GELPF for distinct SAGE that the GELPF for the Affymetrix microarray data fol-lows the GDP model (k⫽ 0.86 ⫾ 0.001, b ⫽ 0.37 ⫾ tags in the G2/M phase-arrested yeast cell library
con-tains 19,527 tags with 5303 distinct tags. By filtering 0.003) and is consistent with the GELPF for corrected SAGE data. Similar skewed frequency distributions were these tags by matching in the tag location database, we
discovered 3239 erroneous tags (16.6% of the 19,527 also observed (see examples in Table 1) in 30 other microarray experiments using normal and stressed yeast tags in the library) corresponded to 2103 distinct tags.
Most of the 2103 distinct erroneous sequences found cells (Holstegeet al.1998;JelinskyandSamson1999; Jelinskyet al.2000).
in the set of 3239 erroneous tags occur only one or two times. The remaining 16,288 tags corresponded to 3200 distinct tags with matched 2936 genes/ORFs in the tag
METHODS location database.
By sampling randomly from a pooled library con- Binomial differential distribution and an estimator taining all the observed true tags from the three SAGE of the total number of expressed genes:LetMdenote libraries, we constructed population growth curves for the total number of transcripts in a given “error-free” both the number of distinct tags chosen and the corre- library and let N denote the number of distinct gene sponding number of different genes/ORFs found in tags (or tag/signals converting to genes) for that library. the tag location database (Figure 4b). Sample size- Let p
m denote the probability that a randomly chosen dependent LG model (Equations 3 and 4) fits detected gene is represented by
massociated transcripts in the numbers of both distinct true tags and different genes/ library form⫽1, 2 , . . . . On the basis of a multinomial ORFs. In the case of distinct true tags (䊊, Figure 4b), distribution model for sampled transcripts, whenM is our estimator (Equation 5) once again predicts a very large enough, we obtain the discrete probability func-large value of 25,103⫾2000 distinct true tags compared tionpm, in terms of MandN, as
to the total number of known yeast genes. For genes/ ORFs (䊉, Figure 4b), a more reasonable estimate of
pm⫽(⫺1)m⫹1 1
N
M!
m!(M⫺ m)!
dmN
dMm (2)
the total number of expressed genes,Nt⫽7025⫾200, was obtained. After minor corrections (see Accuracy of
(see theappendix), wherem⫽1, 2, . . . . Note thatN an estimate of the number of expressed genes for yeast cellsin
is treated as a function ofM, sopmis a function ofM. methods), this estimate is consistent withCantorand
We call this function the binomial differential (BD) Smith(1999) andJohnson(2000) estimates. Thus, we
function. Taking m⫽ 1 in Equation 2, we obtain the can suggest that all or almost all yeast genes are
ex-differential equation pressed in a growing normal yeast cell population,i.e.,
Nt⬇ G, where G is the total number of genes in the dN/dM⫽p
1N/M, (3)
entire yeast genome.
Using the estimated parametersc ⫽ 0.579 and d ⫽ with N(1) ⫽ 1. Equation 3 defines the “logarithmic growth” (LG) functionN(M).p1is a decreasing function 6580 in the LG function (Equations 3 and 4,methods)
and an estimateMcell⫽15,000 of the number of mRNAs ofM(see Figure 3c). We use the empirical approxima-tion (Kuznetsov2001)
per yeast cell (Velculescu et al. 1997), Equation 5 (methods) predicts 3009 genes/ORFs/cell. This
esti-mate is consistent with our estiesti-mate for a single yeast p1⫽ 1⫹ 1/dc
1⫹(M/d)c, (4) cell in the G2/M phase-arrested state (2936 genes/ORFs
by SAGE data) and with our estimates for yeast cells by wherec anddare positive constants. Using an explicit Affymetrix microarray data (Table 1). specification ofp
1allows us to fit the BD and LG models
The GELPF in a single yeast cell:The GELPF for a to empirical histograms. With p
1 defined by Equation single yeast cell was estimated for corrected data (Figure 4, Equation 3 has an exact solution for N(M) in the 4a), using both the BD and GDP models (seemethods); limit asM→∞:
the results are presented in Figure 4b. To validate our
mathematical models used to analyze SAGE data, we N(∞)⫽Nt⫽(1⫹ dc)(1⫹1/d
c)/c
Ntis an estimator of the number of expressed genes in valueN.Note the corresponding value Mis randomly determined by our sampling (see Figure 4c).
a large population of cells. Using Equation 2 with fitted
values of the parameters d and c provides a mean of Goodness-of-fit analysis methods, numerical
calcula-tions, and software: Parameters in models were
esti-computingp1,p2, . . . at a given library sizeM.
Estimation of the GELPF for a single cell: First, we mated MLAB mathematical modeling software
(Civi-lized Software, Silver Spring, MD, www.civi(Civi-lized.com). use the BD model (Equation 3) with fitted parameters
candd inp1(M) to compute the probability valuesp1, For goodness-of-fit analysis, we used the modified Akaike information criterion [or model selection
crite-p2, . . . ,p6 for 3009 yeast genes/ORFs corresponding
to the library size 15,000 transcripts. Because the GDP rion (MSC)], model is a good approximation of BD distribution at
⌿ ⫽log
冢
兺
Jm⫽1
(g(m)⫺E(g))2/
兺
Jm⫽1
(g(m)⫺f(m))2
冣
⫺2v/J, fixedM (see Figure 3, Figure 4c, andmethods), it isacceptable to use the GDP model to estimate pm for
wherem⫽1, 2, . . . ,J.In our casemis the expression larger m. (This use of the GDP model was necessary
level value andJis the maximum observed gene expres-because there are no readily available numerical
algo-sion level in the library;gis the empirical relative fre-rithms that do not accurately compute values of
high-quency distribution,fis the theoretical probability dis-order derivatives.) We fit the GDP model (Equation
tribution function with v unknown parameters, and 1) to the six points predicted by the BD probability
E(g) is the mean value of observed data. Note, the ⌿ distribution at constraintsM⬇15,000,J⬇0.028*Mand
is independent of the scaling of data points.⌿ ranges extrapolate the fitted GDP model to estimate values of
between excellent (11–8), very good (8–6), satisfactory
pmfor m⬎ 6 (solid step line in Figure 4c). To check
(6–4), and poor (4–1). the self-consistency of our predictions, we estimated the
We also used the cumulative fraction functionR(see total number of transcripts, M, from the fitted GDP
Figure 1), as well as several regular goodness-of-fit crite-model and noted that the result was 15,000.
ria (sum of squares for deviations, the Wilcoxon
two-Accuracy of the estimated number of expressed genes
sample rank-order test).
for yeast cells:Our estimate, Nt ⫽ 7024 genes/ORFs,
By our goodness-of-fit criteria, the GDP model is supe-isⵑ4–10% higher than current estimates of the total
rior to simple power law, as well as many other skew number of distinct ORFs in the yeast genome (6200–
probability functions (Poisson, log-series, and exponen-6760 genes/ORFs;CantorandSmith1999;Johnson
tial) and mixed logarithmic series⫹exponential distri-2000). This relatively small difference could be due to
bution. For example, for library sizes ⬎40,000 SAGE the existence of erroneous and redundant tags that
tags, the values of the⌿ranged between 3 and 6 (satis-nevertheless match genes/ORFs and their adjacent
ge-factory or poor); however,⌿values ranged in (11–7) for nomic regions. Our analysis does not take into account
the GDP model. Similar superiority of the GDP model nonannotated ORFs and overlapping ORFs that match
(measured by theRand⌿criteria) was observed after the same tag. Additionally,ⵑ1–3% of transcripts would
goodness-of-fit analysis of the distribution models to be expected to lack anNlaIII site and would therefore
microarray data. be missing in the database.
Symbolic differentiation and subsampling were per-In the case of yeast,ⵑ5% of the genes show alternative
formed using MLAB. Monte Carlo experiments were splicing. Furthermore, splice variants might have the
performed using MLAB and programs written in For-same primary tag, alternative tags, or become SAGE
tran-90. Data-mining tools of the Cancer Research Anat-silent, depending on the restriction sites remaining. We
omy Project including X profiling and SAGE/map (Lal summed all SAGE tags that matched ORFs to obtain
et al. 1999; http://www.ncbi.nlm.nih.gov/SAGE) were
the GELPF, so the only effect would be to miss the small
also used. number of splice variants lacking a NLaIII restriction
site. We do not know the frequency distribution of alter-native splicing transcripts in yeast and human cells. With
DISCUSSION respect to our model of GELPF, we might assume that
splice variants for yeast cells will have a skewed form of Even with their large differences in genome organi-zation yeast, mouse, and human cells all demonstrate the probability distribution and not have a significant
effect on our estimate of the true GELPF. similar skewed long-tail Pareto-like gene-expression level distributions. The observed distributions have the
Simulation of theoretical histograms:Given the
num-ber of expressed genes,N, and the best-fit parameters following characteristics in common:There are few
redun-dant and many rare transcripts. The universality of the
kandb of the GDP distribution, we sample the values
ofmat random on the basis of the functionf(m) (Equa- empirical GELPF form for different eukaryotic cells sug-gests a common underlyingprobabilisticmechanism asso-tion 1)Ntimes (once for each gene). Then we count
the occurrence numbers of generated valuesmin the ciated with the gene expression process conserved in eukaryote evolution. Similar distributions have been ob-intervals (0–1], (1, 2], . . . and construct the simulated
net-works (Jeonget al.2000), for the rates of protein synthe- the majority of genes are thought to be transcribed over a short period of time (4–7 min per transcript) and sis of prokaryotic organisms (RamsdenandVohradsky
1998), in different DNA-related phenomena (see Li infrequently, less than once per hour (Jackson et al.
2000). On the basis of a similar methodological ap-1999;Stanleyet al.1999;Gomezet al.2001 for
refer-ences), and in many models of the self-organized sys- proach for estimating the GELPFs for a SAGE tran-scriptome, which we used in this article for yeast SAGE tems (http://linkage.rockfeller.edu/wli/zipf). All such
systems exhibit a strong stochastic component. data sets, the analysis of a large (ⵑ600,000 SAGE tags) human transcriptome data set (Velculescuet al.1999) Both oligonucleotide microarray hybridization and
construction of SAGE libraries allow large-scale charac- indicated thatⵑ70% of all protein-coding human genes are expressed with less than one transcript per cell on terization of gene expression profiles including
low-abundance transcripts. However, in both technologies, average (Kuznetsov 2002). Such low numbers of tran-scripts in a cell population may be due to the action the determination of expression levels at one or fewer
transcripts per cell is limited by issues of limited sensitiv- of a random transcription process in individual cells (McAdamsandArkin1999;Fieringet al.2000;Hume ity and erroneous measurements. These limitations
be-come more severe with increasing size of the tran- 2000;Sutherlandet al.2000).
Initiation of transcription has been observed to occur scriptome. We developed a comprehensive statistical
approach to analyzing the empirical distribution of ex- sporadically and randomly both in time and location on chromosomes in a variety of cell systems (Ko1992; pressed genes for large transcriptomes obtained by the
SAGE method by first removing sequence errors using Rosset al.1994;Newlandset al.1998;Sanoet al.2001). In this study, we present additional data and arguments chromosome location maps for SAGE tags and then
applying statistical modeling and the BD model (Equa- supporting our hypothesis that at the level of the individ-ual cell the transcription events for a given gene at an tions 2–5) to filtered data (Figure 4). Our resulting
SAGE data were similar to the GELPF data that we instant appear to be statistically independent of expres-sion levels for thousands of other genes. The existence obtained for normalized oligonucletide microarray
hy-bridization data sets for yeast cells. Our methodology of such a random transcription process would imply that all or almost all protein-coding genes in a genome of construction of the correct underlying probability
distribution could be used to analyze large SAGE tran- should have a small but positive probability to be tran-scribed in any given cell during any fixed time interval. scriptomes for different mammalian cells and cell types,
including human transcriptomes, and for evaluation of This suggestion is consistent with the observation that small transcript copy numbers occur even for various the new modifications of the SAGE method using, for
example, 21-mer tags. tissue-specific genes in human cells of different type, such as fibroblasts, lymphocytes, etc. (Chelly et al.
Our statistical modeling approach provides a
justifi-able way to compare the GELPFs using samples (cDNA 1989). Although not all cells of a population would have a copy of a specific transcript at a given moment, we or SAGE libraries) with different sizes. This approach
also can be used to permit the use of exact statistical would expect to see all these genes expressed, at least at a low level, in a sufficiently large cell population at tests for different transcriptomes (i.e., obtained for
nor-mal and cancerous cell tissues). Our novel numerical any point in time. That is,ergodicityholds. This point is supported by the yeast expression data in the microarray estimator of the number of species (i.e., expressed
genes; Equation 5) can be used to estimate the number database (Jelinskyet al.2000): We observed that only 250 ORFs (ⵑ150 of them are “questionable” or “hypo-of expressed genes in a single cell and in a population
of the cells by SAGE or cDNA data sets, even if data are thetical” ORFs) of ⵑ6200 genes/ORFs were not ex-pressed in any of six presented microarray samples from incomplete and exhibit severe experimental errors.
On the basis of our analysis of the GELPF in the normal growing yeast cells.
In mammalian cells, a significant fraction of genes normalized yeast microarray databases (Jelinsky and
Samson1999;Jelinsky et al.2000) 1330⫾ 45 genes/ are silenced (transcripts are not observed); the silent state of a gene can be inherited, but later reactivated ORFs are represented on average by a single mRNA
molecule per cell, at least 2000 genes/ORFs are ex- involving the stochastic, all-or-none mechanism at the level of a single cell (Sutherland et al. 2000). Low-pressed at 0.1–0.5 molecules per cell on average, and
ⵑ47% (2917) of all yeast genes are expressed at less probability transcription events for many genes in a cell could be regulated by its own specific transcripts. than one transcript per cell. Our estimate for yeast cell
SAGE data is consistent with these estimates. Approxi- Sporadic initiation of the transcription process for rarely expressed genes could also be under dynamical control mately 1200 genes/ORFs are represented on average
by a single mRNA molecule per yeast cell (Figure 4b). of some non-protein-coding genes associated with stress-response control (Eddy2001). Many RNAs transcribed The population growth curve for genes/ORFs (Figure
4b) predicts that 3800 additional genes/ORFs (ⵑ55% from these genes represent anti-sense RNA transcripts that overlap protein-coding genes on the other genomic of all yeast genes) are expressed at less than one
environ-mental changes, various stress conditions, and local of different transcripts. For example, the multivariate multinomial distribution model can be constructed (see fluctuation of molecular composition, the initiation of
transcription events for many rarely expressed genes in Johnsonet al.1997). Such a distribution model would be suitable, in particular, for analysis of gene-regulating each cell could be under dynamical control of these
noncoding genes. Such autoregulation might tend to network data representing gene expression profiles for individual cells sampled with replicates from an “iso-keep the low-expressed gene “one-half on,” thus
sporadi-cally providing the mechanism of low expression for genic” cell population at several periods of observation. Identification of such a multivariate multinomial distri-many genes in a cell population.
Physically, random “basal” transcription of genes bution model may help to estimate the biologically sig-nificant correlations between genes and evaluate the might reflect nonlinear responses of the independent
“gene transcription complexes” to internal or external stochastic component in dynamics of gene expression clusters at low expression levels.
fluctuations including thermal molecular motion. Noise
in nonlinear dynamical systems can play a constructive The authors thank V. Velculescu for providing the supplementary role: It can, for example, improve a system’s sensitivity information on the yeast cell SAGE database. We thank J. Berzofsky, I. Belyakov, K. Chumakov, R. Nossal, R. Strausberg, A. Strunnikov, T.
to weak signals (Wiesenfeldand Jaramillo1998). If
Tatusov, and two reviewers for critical comments on the manuscript.
it is so, noise in the gene-expression machinery could enhance weak transcription signals. This amplification mechanism for gene expression in eukaryotic cell types
might provide a basic level of phenotypic diversity within LITERATURE CITED
a cell population and thus could facilitate adaptation Bishop, J. O., J. G. Morton, M. RosbashandM. Richardson,1974
Three classes in Hela cell messenger RNA. Nature250:199–204.
of a population of cells. The stochastic variability in
Cantor, C. R.,andC. L. Smith,1999 Genomics.John Wiley & Sons,
the case of rarely transcribed genes could also lead to
New York.
changes in the genotype in which lineage commitment Caron, H., B. van Schaik, M. van der Mee, F. Baas, G. Rigginset
al., 2001 The human transcriptome map: clustering of highly
results from a selective rather than an instructive
mecha-expressed genes in chromosomal domains. Science291:1289–
nism in cells (Ko1992;Hume2000;Sutherlandet al.
1292.
2000;Ohlssonet al.2001;Sanoet al.2001). Random Chelly, J., J.-P. Concordet, J.-C. KaplanandA. Kahn,1989
Illegit-imate transcription: transcription of any gene in cell type. Proc.
initiation of gene transcription in a given cell would
Natl. Acad. Sci. USA86:2617–2621.
allow the “essential” rarely transcribed gene to provide
Chen, J.-J., J. D. Rowleyand S. M. Wang, 2000 Generation of
the random switch between active and inactive states longer cDNA fragments from serial analysis of gene expression
tags for gene identification. Proc. Natl. Acad. Sci. USA97:349–
during the formation of daughter cells and thus to
pro-353.
vide genotype diversity in the cell population. Because
Eddy, S. R.,2001 Non-coding RNA genes and the modern RNA
the distribution of the lifetimes of “switch-on” and world. Nat. Rev. Genet.2:919–928.
Fiering, S., E. Whitelaw, D. I. K. Martin, 2000 To be or not to
“switch-off ” states for genes in a single cell has a long
be active: the stochastic nature of enhancer action. BioEssays22: right tail (McAdamsandArkin1999), one of the two
381–387.
alleles of the same locus for a given low-expressed gene Gomez, S. M., S.-H. LoandA. Rzhetsky,2001 Probabilistic
predic-tion of unknown metabolic and signal-transducpredic-tion networks.
might be present in the same state for a long period of
Genetics159:1291–1298.
time. In this case, a natural clonal selection process in
Holstege, F. C. P., E. G. Jennings, J. J. Wyrick, T. I. Lee, C. J.
a population of the cells could select the clone(s) with Hengartneret al., 1998 Dissecting the regulatory circuitry of
a eukaryotic genome. Cell95:717–728.
a monoallelic gene expression,i.e., a phenomenon in
Huang, S.-P.,andB. S. Weir,2001 Estimating the total number of
which only a single copy, or allele, of a given gene
alleles using a sample coverage method. Genetics159:1365–1373.
of diploid organisms appears (Ohlsson et al. 2001). Hume, D. A.,2000 Probability in transcriptional regulation and
im-plications for leukocyte differentiation and inducible gene
ex-Further statistical analysis and modeling of the
large-pression. Blood96:2323–2328.
scale gene expression data could help us to understand
International Human Genome Sequencing Consortium, 2001
how the stochastic variability of gene expression in a Initial sequencing and analysis of the human genome. Nature 409:860–921.
single cell might lead to changes of the genotype
reper-Iyer, V.,andK. Struhl,1996 Absolute mRNA levels and
transcrip-toire in developing tissues and in an entire organism.
tional initiation rates inSaccharomyces cerevisiae.Proc. Natl. Acad.
In this study, we have analyzed only “snapshot” gene Sci. USA93:5208–5212.
Jackson, D. A., A. PomboandF. Iborra,2000 The balance sheet
expression profiles, which are based on an “averaging”
for transcription: an analysis of nuclear RNA metabolism in
mam-of the many thousands mam-of cells in various states and
malian cells. FASEB J.14:242–254.
which by themselves do not provide us direct informa- Jelinsky, S. A.,andL. D. Samson,1999 Global response of
Saccharo-myces cerevisiaeto alkylating agent. Proc. Natl. Acad. Sci. USA96: tion about regulatory relationships between expressed
1486–1491.
genes. Taking multiple times the samples of transcripts
Jelinsky, S. A., P. Estep, G. M. ChurchandL. D. Samson,2000
from homogenous cell populations or from single cells Regulatory networks revealed by transcriptional profiling of
dam-agedSaccharomyces cerevisiaecells: Rpn4 links base excision repair
of this population, we could study the correlation
be-with proteasomes. Mol. Cell. Biol.20:8157–8167.
tween expression levels of genes. In this case, it would
Jeong, H., B. Tombor, R. Albert, Z. N. OttvaiandA.-L. Barabasi,
be interesting to construct a distribution model that 2000 The large-scale organization of metabolic networks.
Na-ture407:651–654.
Johnson, M.,2000 The yeast genome: on the road to the gold age. corresponds to genei)⫽qi. Let the random variables
i
Curr. Opin. Genet. Dev.10:617–623.
denote the number of transcripts for geneiin a random
Johnson, N. L., S. KotzandA. W. Kemp,1993 Univariate Discrete
Distributions.John Wiley & Sons, New York. library of sizeM.Note兺Nt
i⫽1si⫽M. WhenMⰆMt,
sam-Johnson, N. L., S. KotzandN. Balakrishnan,1997 Discrete Multi- pling with replacement is an acceptable model of library variate Distributions.John Wiley & Sons, New York.
construction; this is described by a multinomial
distribu-Ko, M. S. H.,1992 Induction mechanism of a single gene molecule:
stochastic or deterministic. BioEssays14:341–346. tion. The joint probability of observings1 ⫽ y1mRNA
Kuznetsov, V. A.,2001 Distribution associated with stochastic pro- transcripts of gene 1, . . . , s
Nt⫽ yNt mRNA transcripts
cesses of gene expression in a single eukaryotic cell. EURASIP
of gene Ntin a given library with sizeM is defined by
J. Appl. Signal Proc.4:285–296.
Kuznetsov, V. A.,2002 Statistics of the numbers of transcripts and the probability function,f(y1, . . . ,yNt;M) :⫽Pr[s1⫽y1,
protein sequences encoded in the genome, pp. 125–171 inCompu- . . . ,s
Nt⫽yNt], where
tational and Statistical Approaches to Genomics, edited byW. Zhang
andI. Shmulevich. Kluwer, Boston.
Lal, A., A. E. Lash, S. F. Altschul, V. Velculescu, L. Zhanget al., f(y1, . . . ,yN
t;M)⫽
M!
兿
Nt j⫽1yj!兿
Nt
j⫽1
qyj
j. (A1)
1999 A public database for gene expression in human cancers. Cancer Res.59:5403–5407.
Li, W.,1999 Statistical properties of open reading frames in com- The functionfhas the unknown parametersq
1,q2, . . .
plete genome sequences. Comput. Chem.23:283–301.
qNtandNt, together with the constraints兺Nj⫽t1qj⫽1 and
McAdams, H. H.,andA. Arkin,1999 It’s a noisy business! Genetic
regulation at the nanomolar scale. Trends Genet.15:65–69. 兺Nt
j⫽1yj ⫽ M. The marginal probability function fi (m,
Newlands, S., L. K. Levitt, C. S. Robinson, A. B. Karpf, V. R. M) :⫽Pr(s
i⫽m) is the probability that the unique tag
Hodgsonet al., 1998 Transcription occurs in pulses in muscle
for geneioccurs exactlymtimes in a library of sizeM: fibers. Genes Dev.12:2748–2758.
Ohlsson, R., A. PaldiandJ. A. Marshall Graves,2001 Did geno-mic imprinting and X chromosome inactivation arise from
sto-fi(m,M)⫽ M!
m!(M⫺m)!q m
i(1⫺qi)M⫺m.
chastic expression? Trends Genet.17:136–141.
Ramsden, J. J.,andJ. Vohradsky,1998 Zipf-like behavior in prokary-otic protein expression. Phys. Rev. E58:7777–7780.
We can estimate the expected number of distinct genes,
Ross, I. L., C. M. BrowneandD. A. Hume,1994 Transcription of
n(m,M), which havemtranscripts in our library of size
individual genes in eukaryotic cells occurs randomly and
infre-quently. Immunol. Cell. Biol.72:177–185. M.Let ␦ij ⫽1 wheni ⫽jand 0 otherwise. Now,
Sano, Y., T. Shimada, H. Nakashima, R. H. Nicholson, J. F. Eliason
et al., 2001 Random monoallelic expression of three genes
clus-n(m,M) :⫽
兺
Nii⫽1
E(␦s,m)⫽
兺
Nt
i⫽1
fi(m,M).
tered within 60 kb of mouse t complex genomic DNA. Genome Res.11:1833–1841.
Stanley, H. E., S. V. Buldyrev, A. L. Goldberger, S. Havlin, C. K.
Let the random variable GM ⫽ #{i|si ⬎ 0}; GM is the
Penget al., 1999 Scaling features of noncoding DNA. Physica
A 273:1–18. number of distinct genes represented in the library of
Stollberg, J., J. Urschitz, Z. Urban andC. D. Boyd, 2000 A sizeM.We can estimate the expected number of genes quantitative evaluation of SAGE. Genome Res.10:1241–1248.
N(M) in a given library asE[G] :⫽N(M), where
Strausberg, R., K. H. Buetow, M. R. Emmert-Buck and R. D. Klausner,2000 The Cancer Genome Anatomy Project:
build-ing an annotated gene index. Trends Genet.16:103–106. N(M) :⫽
兺
M
m⫽1
n(m,M)⫽
兺
Ntj⫽1
(1⫺(1⫺qj)M)⫽Nt⫺n(0,M),
Sutherland, H. G., M. Kearns, H. D. Morgan, A. P. Headley,
C. Morriset al., 2000 Reactivation of heritably silenced gene (A2)
expression in mice. Mamm. Genome11:347–355.
Velculescu, V. E., L. Zhang, B. Vogelstein andK. W. Kinzler, wheren(0,M) denotes the expected number of distinct
1995 Serial analysis of gene expression. Science270:484–487.
genes that escaped detection in the given library; n(0,
Velculescu, V. E., L. Zhang, W. Zhou, J. Vogelstein, M. A. Basrai
et al., 1997 Characterization of the yeast transcriptome. Cell88: M) is given asn(0,M)⫽ 兺Nt
j⫽1(1⫺ qj)M.
243–251.
Using the formulas forfi(m,M),n(m,M), andN(M)
Velculescu, V. E., S. L. Madden, L. Zhang, A. E. Lash, J. Yu et
we can derive the recursion formula (Kuznetsov2001)
al., 1999 Analysis of human transcriptomes. Nat. Genet.23:
387–388.
Venter, J. C., M. D. Adams, E. W. Myers, P. W. Li, R. Mural et
n(m,M)⫽(⫺1)m⫹1 M!
m!(M⫺m)!(ⵜ
mN(M)), (A3)
al., 2001 The sequence of the human genome. Science291:
1304–1351.
Wiesenfeld, K.,andF. Jaramillo,1998 Mini-review of stochastic
where m僆{1, . . . ,M}. Also,n(m,M)⫽ 0, ifm⬎ M. resonance. Chaos3:539–548.
ⵜ is the backward difference operator ⵜN(M) ⫽
Communicating editor:G. A. Churchill
N(M)⫺N(M⫺1), . . . ,ⵜmN(M) :⫽ ⵜm⫺1N(M)⫺ ⵜm⫺1N (M ⫺ 1). These results allow us to compute n(m, M) for any given values ofmandM.Recall we letpm⫽n(m, APPENDIX: A STOCHASTIC MODEL OF M)/N.Then, for largeMwe may approximatep
mwith its GENE EXPRESSION
continuous analog and obtain the probability function called the binomial differential model (Equation 2, Let us assume thatNtgenes 1, 2, . . . ,Ntare expressed
methods). This function has a skewed form and is ap-independently with Mt associated transcripts in total
proximated for large enough M and m by the power in the cells of a large cell population with respective