DOI: 10.1534/genetics.108.089623
Evolution of Primate Gene Expression: Drift and Corrective Sweeps?
R. Chaix,*
,†M. Somel,
‡,§D. P. Kreil,** P. Khaitovich
‡,§and G. A. Lunter
††,1*Department of Statistics, University of Oxford, Oxford OX1 3TG, United Kingdom,†Unite´ d’Eco-Anthropologie, CNRS UMR 5145, Muse´e de l’Homme, 75116 Paris, France,‡Institute for Computational Biology, Shanghai Institutes for Biological Sciences,
Chinese Academy of Sciences, Shanghai, 200031, China,§Max-Planck-Institute for Evolutionary Anthropology, D-04103 Leipzig, Germany,**Chair of Bioinformatics, Boku University, AT-1190 Vienna, Austria
and††MRC Functional Genomics Unit, Department of Physiology, Anatomy and Genetics, University of Oxford, Oxford OX1 3QX, United Kingdom
Manuscript received March 28, 2008 Accepted for publication August 21, 2008
ABSTRACT
Changes in gene expression play an important role in species’ evolution. Earlier studies uncovered evidence that the effect of mutations on expression levels within the primate order is skewed, with many small downregulations balanced by fewer but larger upregulations. In addition, brain-expressed genes appeared to show an increased rate of evolution on the branch leading to human. However, the lack of a mathematical model adequately describing the evolution of gene expression precluded the rigorous establishment of these observations. Here, we develop mathematical tools that allow us to revisit these earlier observations in a model-testing and inference framework. We introduce a model for skewed gene-expression evolution within a phylogenetic tree and use a separate model to account for biological or experimental outliers. A Bayesian Markov chain Monte Carlo inference procedure allows us to infer the phylogeny and other evolutionary parameters, while quantifying the confidence in these inferences. Our results support previous observations; in particular, we find strong evidence for a sustained positive skew in the distribution of gene-expression changes in primate evolution. We propose a ‘‘corrective sweep’’ scenario to explain this phenomenon.
T
HE genetic mechanisms underlying the pheno-typic evolution of species are still poorly under-stood. More than 30 years ago, it was proposed that regulatory changes may have played a major role in the evolution of species and in particular in the rapid emergence of human-specific traits (Kingand Wilson1975). It appears likely that in general, gene-expression levels are more closely related to the phenotypes upon which selection acts than the DNA sequence itself, mo-tivating the study of their evolution. With the advent of microarray technology, the measurement of transcript levels on a genomewide scale and across species and individuals is now economical, opening the way for a systematic study of gene-expression evolution.
Quantitative traits such as transcript expression levels pose specific challenges. In contrast to sequence data, the variance of quantitative traits includes components of experimental error, and environmental and genetic variation, besides the evolutionary component of in-terest here. Separating these components is problem-atic, making it difficult to establish in particular cases whether or not the expression level of a gene has under-gone a mutation. This difficulty may have contributed to the fact that previous studies have arrived at different
conclusions as to the major modes of evolution of gene expression, ranging from neutral evolution (Khaitovich et al.2004; DeMeauxet al.2005; Keightleyet al.2005),
to stabilizing selection (Denveret al.2005; Giladet al.
2005; Lemoset al.2005), to directional selection (Gilad et al.2006).
Most recent studies of expression-level evolution have compared variances within and between species and clas-sified genes as either differentially expressed or un-changed on the basis of thresholds ofP-values obtained from multifactorial linear modeling of fluorescent probe log-intensity readings (Hsieh et al. 2003; Rifkin et al.
2003; Nuzhdin et al. 2004; Denver et al.2005; Gilad et al.2006; Oshlacket al.2007). The loss of information
inherent in such a dichotomous classification reduces the power of this approach. In addition, the environ-mental and genetic within-population components of the variance of these log-intensity readings may differ between species or experiments. These variance com-ponents can be difficult to measure (Giladet al.2006),
but affect the power of the statistical tests and therefore weaken the conclusions reached by these studies.
A more principled approach to study quantitative traits is to explicitly model their evolution. In primates and flies, it was observed that the squared deviation of expression phenotypes increases linearly with diver-gence time (Rifkinet al.2003; Khaitovichet al.2004,
2005b). This observation is compatible with neutral
1Corresponding author:MRC Functional Genetics Unit, Department of
Physiology, Anatomy and Genetics, University of Oxford, Oxford OX1 3QX, United Kingdom. E-mail: [email protected]
diffusion-type models for quantitative trait evolution (Edwards and Cavalli-Sforza 1964; Felsenstein
1973; Lande 1976; Lynch and Hill 1986; Turelli et al.1988; Lemoset al.2005) as well as with directional
and stabilizing selection over sufficiently short time-scales (Felsenstein 2004; Khaitovich et al. 2004;
Lemos et al. 2005). However, two aspects of
gene-expression evolution are not very well captured by these diffusion-type models. First, while the traits themselves are continuous, their heritable component is encoded in DNA, and mutations may therefore be supposed to occur as discrete events rather than as a continuous diffusion. Although a continuous approximation is justifiable over long times, for evolution over short time intervals the granularity of the process might conceiv-ably have an impact on observables. Second, the spectrum of expression-level changes exhibits a skew, so that while expression levels remain constant in expectation, this appears to be brought about by many small downregulations combined with fewer upregula-tions of a larger average magnitude (Khaitovichet al.
2005b), a feature not accounted for in existing diffusion-type models.
Here we introduce a new probabilistic model of gene-expression evolution that incorporates these character-istics. While probabilistic approaches have been used extensively to study nucleotide and amino acid sequences in an evolutionary perspective (methods reviewed in Durbin et al. 1998; Felsenstein 2004), relatively few
authors have considered analogous methods, and in particular likelihood models, to investigate the evolu-tion of expression data, the characteristics of which render the standard discrete-state models for nucleo-tide evolution inadequate (Felsenstein1973; Oakley et al. 2005). Advantages of a probabilistic approach include the ability to do parameter inference with con-fidence intervals, to test the goodness-of-fit of alterna-tive models, and to test hypotheses such as the existence of a phylogenetic signal.
We are particularly interested in investigating whether in recent evolution, more expression-level mutations have occurred in the human or in the chimpanzee branch. An analysis of gene-expression levels from hu-man, chimpanzee, orangutan, and rhesus macaque samples previously suggested that more changes have occurred on the lineage leading up to humans (Enard et al.2002b; Khaitovichet al.2005b, 2006; Lemoset al.
2005). Here, we revisit these original observations, both the skew in the expression-mutation process and the excess of mutations in the human branch.
Our model has a number of features that distinguish it from previous approaches. One often-made assumption is that mutations cause changes in the relative transcript abundance, independent of the absolute level of expres-sion. This would imply that the spectrum of expression changes on a logarithmic scale is independent of the absolute expression; however, we do not observe such
independence. Here, instead of making this assumption, we replace the log transformation with a variance-stabilizing transformation that explicitly accounts for any level dependence of the interspecific variance, ex-tending an approach introduced by Huberet al.(2002).
In addition, we account for intraspecific variance and measurement errors by modeling the observed expres-sion by a Gaussian distribution.
A second feature of our model is that we explicitly model outliers. Since the evolutionary model is rela-tively constrained, this outlier model ensures that nucleotide mutations resulting in mismatching probes, annotation errors, or indeed genes that have under-gone strong directional selection do not dominate the final likelihood and thereby unduly influence parame-ter estimates. The proportion of genes that are deemed to be outliers is estimated alongside the other model parameters and provides an indication of the model fit and data quality. We chose the infinite-variance Cauchy distribution on a star-tree topology to model outliers, as this heavy-tailed distribution allows wide outliers to have relatively little effect on the likelihood.
To model the evolution along branches of the phylogenetic tree, we use the compound Poisson model introduced by Khaitovichet al.(2005b). In this model,
mutations are modeled as discrete events that occur at a constant rate, and each mutation changes the intensity by a random amount that is drawn from a specified ‘‘jump-size’’ distribution. This distribution, which has mean 0, has two parameters determining its variance and skewness. A nonzero skewness confers a direction to the evolutionary process, and this time irreversibility allows us to infer rooted phylogenies without reference to an outgroup, even when expression profiles for only two species are available. We compute the likelihood of the data given the model and its parameters using an ex-tension of Felsenstein’s pruning algorithm (Felsenstein
1981). The fast Fourier transform algorithm allows an implementation that is efficient enough to use the Bayesian Markov chain Monte Carlo approach to infer parameters and credible intervals.
rather to provide an initial, broad view of gene-expres-sion evolution. Nevertheless, the variation of mutations rates and other evolutionary parameters across gene type is a topic that clearly warrants further investigation. Here, we test the ability of our method to estimate branch lengths of two-species and three-species trees in a simulation study. We find that our model is indeed able to infer the correct phylogeny and branch lengths within their confidence intervals. We then apply our method to published sets of expression-profile data on the brain of humans and related primates, to infer the characteristics of the evolutionary process and the branch lengths of the phylogenetic tree relating these primates.
MATERIALS AND METHODS
Interspecies variance-stabilizing transformation:The model defined below describes the evolution of a gene’s ‘‘trans-formed expression,’’E, rather than of the observed normal-ized intensityI. This transformed expressionEis related to the observed intensityIthrough a transformation (unique up to a linear change of scale) that renders the interspecific variance vEindependent of the expression level. If the transformation from normalized intensity isE¼E(I), thenvE¼vIð@E=@IÞ2
, so thatvEis constant ifEðIÞ ¼cÐI0I vI1=2dI, withcandI0 arbi-trary constants. For convenience, we first applied a log trans-formation to reduce the range of vand fitted a piecewise analytic function to the interspecific variance in log-transformed coordinates to compute E(I); this is where we depart from Huberet al.(2002), who use a two-parameter family for fitting.
To simplify comparisons, we chose c so that the range of transformed expression levels roughly coincided with the range of log-transformed raw intensities (1–45). The same transformation was used for all species, and we ensured that no systematic across-species deviations remained by equalizing the within-species medians.
Expression evolution along a branch: The evolution of expression levels along a branch of the phylogenetic tree is described by a compound Poisson process, with the rate parameter fixed to 1 so that branch lengths are measured in units of expected number of mutation events. This model was proposed by Khaitovichet al.(2005b); however, rather than
using an extreme-value distribution to describe the changes of expression due to a single mutation (the jump-size distribu-tion), we here use a two-parameter distribution consisting of an exponential distribution with densitypE(x)¼(1/a)e(x1a)/a (x.aifa.0;x,aifa,0) convoluted with a Gauss kernel with densitypGðxÞ ¼ ð1=pffiffiffiffiffiffiffiffiffiffiffi2ps2Þex2=2s2
. The resulting distributionpD¼pE*pG, which has mean 0, variances21a2, and skewness 2a3(a21s2)3/2, has properties similar to the extreme value distribution (in particular, it has a one-sided heavy tail) but allows a better control of the skewness and simplifies the application of the Fourier transform.
Starting from an initial expression of 0, the distribution of expression levelspY,tafter the compound Poisson process Y has been allowed to run for a timet is calculated aspY,t¼ F1{exp[t(F(pD)1)]}, whereF and F1 are the Fourier and inverse-Fourier operators defined by FðpÞ ¼Ð‘‘ eiuxpðxÞdx andF1ðqÞ ¼ ð2pÞ1Б
‘eiuxqðuÞdu. To derive this, note that the probability thatnmutations occur in the time interval [0, t] isettn/n!, and the sum ofnindependent expression changes drawn fromDis distributed aspD*. . .*pD(ntimes), where * is the convolution operator. Using F(f*g) ¼ F(f)F(g), the
distribution pY,t may be written as pY;t¼F1fet P‘
n¼0tn ðFðpDÞÞn
=n!g ¼F1fexp½tðFðpDÞ 1Þg. Evaluating the Four-ier transform, we obtain
pY;t¼F1 etexp
t 1iaue
iauu2s2=2
h i
: ð1Þ
Expression evolution in a phylogeny: To calculate the likelihood of a configuration of expression levels on a binary phylogenetic tree, we use a reverse traversal algorithm anal-ogous to Felsenstein’s peeling algorithm. The algorithm com-putes partial-likelihood densities La(xa) representing the likelihood density of the observed transformed expressions at the collection of nodea’s descendant leaf nodes, conditional on its expression levelxa. To compute these, we denote the immediate descendants ofabybandc. LetLi9ðxaÞ;i¼b;c, be
the ‘‘pulled-back’’ partial-likelihood densities of the expres-sion ati(or its descendants ifiis not a leaf node) conditional on the expression atabeingxa. Integrating out all possible mutations yields L9iðxaÞ ¼Ð‘‘ pY;tðiÞðzÞLiðxa1zÞdz¼ ðpY;tðiÞ * LiÞðxaÞ, where zdenotes the increase of expression due to mutations along the branch fromatoi,t(i) is the length of the branch connecting nodesianda, andpðxÞ ¼ pðxÞ. In terms
of these pulled-back likelihoods, the partial-likelihood density ataisLaðxaÞ ¼L9bðxaÞL9cðxaÞ(note that this density lives on a
space with as many dimensions asahas descendant leaves). This computation is potentially slow, since to compute this integral numerically, the x and z variables need to be dis-cretized, and a naive implementation of the convolution is quadratic in the number of discretization bins. However, it can be computed in log-linear time by the fast Fourier transform algorithm, using the relation f*g¼ F1{F(f)F(g)}. A further simplification is obtained by a direct computation of the kernel,
Fðp Y;tÞ ¼e
texp t
11iaue iauu2s2=2
: ð2Þ
The recursion ends with the computation of the likelihood density at the root. The full likelihood under the evolutionary model is obtained by integrating out the initial expression level with a suitable prior distribution Pr(x), which we chose to be uniform,
LðtreeÞ ¼ ð‘
‘
PrðxÞLrootðxÞdx¼
1 2A
ðA
A
LrootðxÞdx; ð3Þ
whereAis a suitably large bound.
Intraspecific variance, measurement error, and random physiological fluctuations were modeled for each gene in each species by initializing the partial-likelihood densities at the leaf nodes by a Gaussian distribution, with mean equal to the observed transformed expression, and variance equal to the observed variance.
Outlier model:The outlier model, which allows for broad changes of expression level, makes the full model less sus-ceptible to evolutionary and experimental outliers. The likeli-hood of the outlier model is independent of the phylogeny and is given by a product of Cauchy distributions,
Lout¼ ð‘
‘ Y
a
a pða21ðyx
aÞ2Þ
dy; ð4Þ
Lfull¼pLout1ð1pÞLðtreeÞ: ð5Þ
Gene-expression levels are assumed to evolve independently, so that the compound likelihood for a set of genes is the product of the per-gene likelihoods. Finally, the full model P(u,x), whereurepresents parameters andx transformed expression levels, is obtained by multiplying the likelihood with a prior P(u), which we chose to be uniform in all parameters. The algorithm to compute the likelihood under this model was implemented as an R module (available on request), using the FFTW package for computing fast Fourier transforms (Frigoand Johnson2005). Discretization bins of
size 0.1 were used across the range 1–45.
MCMC inference:We implemented a Markov chain Monte Carlo (MCMC) scheme to sample the model parametersa,s, andp, as well as the branch lengths (denoted by,e.g.,t1,t2,t3,t4 for the three-species tree in Figure 1) from the posterior distribution defined by the model and the observed expres-sion levels. Proposals consisted of the following types: (1) a normally distributed additive change to one of the branch lengths or one of the parametersa,s, andp; (2) a translation of one of the internal nodes (including the root); (3) a change of sign of a; (4) swapping two neighboring branch lengths combined with a change of sign ofa; (5) a rescaling of the branch lengthsaands, leaving the total variance in the tree unchanged, but scaling the expected number of mutations; and (6) a rotation ina–sspace, changing the shape of the jump-size distribution, but leaving the total variance un-changed. These proposals were assigned different probabili-ties to optimize mixing, and each proposal (apart from types 3 and 4) had a scale parameter that was adjusted, during burn-in, to bring the acceptance ratio within the range 10–25%.
Bayes factors were computed using models, by comput-ing the ratio of posteriors P(x), themselves computed as 1=Eð1=Pðu;xÞÞ, where the expectation was taken over the posterior, using the samples fromP(ujx) generated in the MCMC run. Finally, we used our procedure to do approximate maximum-likelihood-ratio tests, by taking the maximum of the likelihood density across samples from runs on two nested models, accounting for the prior, and performing a standard likelihood-ratio test on the resulting two maxima.
Simulation study:We generated expression data for samples of size 100, 1000, and 10,000 for (A) three different species under a given phylogeny (t1¼2,t2¼0.5,t3¼1,t4¼0.5; see Figure 1) and for (B) two different species under the phylogenyt1¼2, t2¼0.5. The intraspecific variancemwas fixed to 0.4. Samples were simulated for different values of parametersa(0.1 and0.5),s(0.1 and 0.5), andp(0 and 0.01), corresponding in total to eight variations of the evolutionary model (see Figure 2 for an illustration of these variations). The expression level for the proportion p of outliers was drawn from a Gaussian distribution with standard deviation 10pffiffiffiffiffiffiffiffiffiffiffiffiffiffiffiffim21s2.
To test the sensitivity of the method to a lack of indepen-dence within the set of expression profiles, we generated additional sets of interdependent expression profiles for two species, takinga¼ 0.5,s¼0.1, andp¼0 or 0.01. We first simulated expression profiles for 100, 1000, and 10,000 tran-scripts using the same protocol as above. We then replicated each transcriptxtimes, wherexwas drawn from a geometric distribution with mean 6, to simulate sets of probes that refer to the same transcript or several coregulated genes. Finally, within each such set of probes, we added an error term drawn from a Gaussian distribution of mean 0 and standard deviation 1.8, similar to the distribution of residuals observed in real data, to simulate technical effects such as variation of hybrid-ization efficiency as well as differences in expression between coregulated genes and alternative transcripts.
We generated 20 replicates for each combination of parameters (54 combinations, 1080 data sets). Each data set was analyzed using a 200,000-sample MCMC chain, including a burn-in period of 10,000 samples. Parameters were logged every 25 samples. After conservatively discarding the samples corresponding to the first half of each chain to allow for convergence, we estimated, for each parameter, the median of its posterior and its 95% credible interval, as well as the median and quartiles over 20 runs.
Normalization of primate expression array data:We used our method to analyze a data set of expression profiles in brain for seven human (H), six chimpanzee (C), three orangutan (O), and six rhesus macaque (R) samples produced using Affymetrix U133plus2 arrays. On these arrays, 25mer oligonu-cleotide probes were designed to hybridize to specific tran-script targets. Typically, 11 probes were designed per human target transcript, allowing both a reduction of noise and a removal of probe sequence-specific effects (Wuet al.2004). We
used the latest available human gene annotation (Ensembl r42, December 2006) to assign probes to target genes as described elsewhere (Daiet al. 2005). To minimize artifacts
that result from hybridizing chimpanzee, orangutan, and macaque samples to arrays designed to assay human tran-scripts, prior to the analysis, we masked all oligonucleotide array probes that did not match perfectly the human (build March 2006), the chimpanzee (build March 2006), and the macaque genomes (build January 2006) as described else-where (Khaitovichet al.2004). The resulting consensus set of
probes contained on average 6 probes per target transcript (probe-set size distributions are shown in supplemental Figure 1). It must be noted that sequence differences specific to the orangutan genome were not masked by this procedure due to lack of the orangutan genome sequence information.
For all data sets, probe level data were normalized, adjusting for different backgrounds and overall hybridization intensities of individual arrays. This conservatively normalized data set withno secondarynormalization (‘‘nn’’) was used in the sub-sequent analysis. In addition, to assess whether results were sensitive to further potential systematic differences between measurements that were not explicitly included in our model of expression evolution, probe-level data were quantile nor-malized across all samples, resulting in the quantile-nornor-malized
Figure1.—Branch-length parameters for the two-, three-,
and four-species phylogenies considered. H, human; C, chim-panzee; R, rhesus macaque; O, orangutan.
Figure2.—Examples of four distributions of change
(‘‘QQ’’) data set. Transcript expression estimates for both data sets were obtained by robust fits of linear multichip probe-level intensity models (Bolstad2004). See supplemental
informa-tion for low-level analysis Q/C plots.
Our evolution model was then either (1) directly applied to probe-expression levels (86,818 probes) or (2) used for an analysis of gene-expression estimates from probe sets (11,309 probe sets). We performed analyses using no outgroup infor-mation (HC data sets), using inforinfor-mation from one outgroup (HCR and HCO data sets), or using two outgroups (HCRO data sets). In total 16 data sets were analyzed, each labeled by the normalizing procedure and the included species, plus the letter ‘‘p’’ when probe rather than probe-set intensities were considered; for example, QQ-HCRp refers to the QQ data set of probe (p) intensities in H, C, and R.
Major assumptions of the model were tested by exploring intra- and interspecific variances as well as the distribution skewness of the expression differences, in relation to tran-script expression level. After QQ normalization, we variance stabilized each data set to decouple the interspecies variance from the mean intensity, according to the method described above. Figure 3 shows the relationship of these variances with mean intensity before and after this transformation for the QQ-HCR data set (plots based on other data sets were very similar). We checked that the skewness coefficient was con-stant across the variance-stabilized expression scale (supple-mental Figure 2), as assumed by our evolutionary model. For low levels of expression, the intraspecies variance reaches levels comparable to the interspecies variance, most probably because of an increased influence of experimental noise (see Figure 4). In this range, the signal contains virtually no infor-mation, and to reduce computation time we removed these data before applying the model (overall, 44.9% of probes and 16.4% of probe sets were removed). Finally, we summarized the observed expression levels for each transcript and species by the median of the expression levels across independent samples (and within the probe set, when appropriate) and by the standard deviation of the median of these expression levels as estimated from a bootstrap procedure.
Supplemental information: Supplemental information is available on the Geneticswebsite. Data sets and low level analysis
are provided at http://bioinf.boku.ac.at/pub/Chaix2008/.
RESULTS
Simulation study: We evaluated the performance of our inference procedure on sets of simulated data, us-ing parameters comparable to those estimated from our primate data set. Our primary interest is in the inference
of the distribution of expression changes parameterized bya ands(see Figure 2) and the ratio of the branch lengths of human to chimpanzee log2(t1/t2).
Conse-quently, we focused mainly on their inference. Table 1 provides a representative sample of the simulation results; the full set of parameter inferences is given in supplemental Tables 1–3.
Using a two-species tree witht1¼2 andt2¼0.5, we
performed simulations for various sets of evolutionary
Figure3.—Relationship between the
intraspe-cific (solid lines) and interspeintraspe-cific (dashed lines) standard deviation (y-axes) and the mean expres-sion level (x-axes) before (a) and after (b) the in-terspecific variance-stabilizing transformation, in the QQ-HCR data set. The intraspecific variance is not stabilized and is accounted for explicitly on a probe-by-probe or a probe-set-by-probe-set basis in the model.
Figure 4.—Phylogenetic trees inferred for QQ data sets.
parameters and gene counts. The branch-length ratio log2(t1/t2) and the parameters of the evolutionary
model a and s can be estimated accurately for a sufficient number of transcripts (typically .100) and moderate to large skewness (jaj$ s), making the model sufficiently time irreversible. With insufficient skewness, the model becomes nearly reversible, resulting in conservative (near-zero) estimates of the log branch-length ratio. As expected, confidence intervals decrease with increasing number of genes and are reasonably small forn$1000 genes; for instance, fora¼0.5,s¼
0.1,p¼1% outliers, andn¼1000 genes, we estimate in the first of our 20 replicatesa ¼0.48 (95% C.I. 0.40– 0.56) ands¼0.13 (0.05–0.26). Replicating the simula-tion 20 times for 36 sets of parameters, we found that true parameters were outside estimated 95% C.I.’s in 5% of the cases for log2(t1/t2), 8% for a, and 6% for s,
suggesting no systematic biases in the parameter or confidence estimates (supplemental Table 1).
As for the three-species data sets, evolutionary param-eters could be inferred with good accuracy even for as little asn ¼100 genes when the model exhibits mod-erate to strong skew (jaj$ s) (supplemental Table 2). When the skewness is small (jaj , s), the number of mutation events (i.e., the total branch length) and the per-mutation variancea21s2become confounded: for instance, fora¼0.1,s¼0.5,n¼1000 transcripts, and 1% of outliers, the total number of events inferred on the tree is overestimated (4.38 instead of 4) but the per-mutation variance is underestimated (0.20 instead of 0.26). However, the total variance along branches (num-ber of events times per-mutation variance), and conse-quently the branch length ratio, can still be accurately determined, showing that the presence of outgroup data makes the procedure less reliant on the time irreversibility of the model. Replicating the simulation 20 times, we found that true parameters were outside estimated 95% C.I.’s in 9% of the cases for log2(t1/t2),
in 12% of the cases fora, and in 8% of the cases fors. We conclude that (i) when skewness is moderate to large (jaj$ s), parameters and branch lengths can be
consistently estimated for three-species and two-spe-cies data sets, and (ii) for small skewness, the model shows no evidence for nonzero skew and tends to equilibrate the branch lengths in the absence of an outgroup.
Finally, we evaluated the sensitivity of the method to the occurrence of interdependent expression profiles. This is obviously relevant when probe rather than probe-set intensities are analyzed, in which case each transcript is represented several times in the data set. Moreover, both technical limitations of the arrays (like cross-hybridization) and biologically related coregulated genes are likely to contribute to correlation in expres-sion data. We simulated data sets in which each in-dependent expression measure is representedxtimes, wherexfollowed a geometric distribution with mean 6. We assumed that the within-probe-set measurement error followed a Gaussian distribution of mean 0 and standard deviation 1.8, corresponding to our observa-tions in the data sets. For a substantially skewed jump-size distribution (a¼0.5 ands¼0.1), we found that the method was able to accurately estimate log2(t1/t2) while
the estimate forawas fairly accurate; the parameters
was, however, somewhat overestimated (supplemental Table 3). For example, for a simulation of 6000 probes witha¼0.5,s¼0.1,t1¼2,t2¼0.5, and 1% outliers,
log2(t1/t2) was 2.00 (1.49–2.51),a¼0.43 (0.33–0.49),
ands¼0.30 (0.22–0.35). Replicating the simulation 20 times for six sets of parameters, we found that true parameters were outside estimated 95% C.I.’s in 2.5% of cases for log2(t1/t2), 22% fora, and 20% fors.
Application to primate expression profiles: We ap-plied our method to sets of expression intensities in the brain for H, C, O, and R samples, removing probes that showed mismatches in either the chimpanzee or the rhesus macaque genomes (in comparison to the human genome) from all four data sets, and considered all possible combinations of data sets that included human and chimpanzee. Because the lack of genome sequence meant that probes that did not match the orangutan genome could not be masked (leading to notable
TABLE 1
A representative sample of simulation results
Outgroup Probe
sets t1 t2 log2(t1/t2) a s p
No No 1.91 (1.72–2.08) 0.36 (0.27–0.52) 2.45 (1.83–2.75) 0.50 (0.48–0.54) 0.18 (0.12–0.18) 0.00 (0.00–0.01) Yes No 2.02 (1.86–2.16) 0.49 (0.43–0.56) 2.00 (1.83–2.24) 0.50 (0.47–0.53) 0.12 (0.10–0.14) 0.01 (0.01–0.01) No Yes 2.01 (1.39–2.40) 0.50 (0.37–0.64) 2.00 (1.49–2.51) 0.43 (0.33–0.49) 0.30 (0.22–0.35) 0.00 (0.00–0.00)
True parameters 2.00 0.50 2.00 0.50 0.10 0.01
differences in the distribution of intensities of orangu-tan in comparison to other species; see supplemental Figures 3 and 4), we first focus our presentation of the results on the HC and HCR sets and discuss the HCO and HCRO data sets later.
We first tested whether the data contained a signifi-cant phylogenetic signal, by running the MCMC pro-cedure on all possible rooted phylogenies of human, chimpanzee, and macaque and comparing the statistical support for the true phylogeny to that for the alternative phylogenies. Indeed, we found strong support for the true phylogeny [Bayes factor 73 bits between true and next-best phylogeny, that is, chimpanzee closer to ma-caque than to human, ‘‘strong evidence’’ ( Jeffreyset al.
2005); approximate maximum-likelihood test, 2Dlog(L)¼
96,P,105].
We next considered whether our data set exhibited a significant skew in the expression-mutation distribution or could be sufficiently well described with a zero-skew model (a ¼ 0), which closely approximates a diffu-sion model. We found that the skewed compound Poisson model fit the data significantly better [Bayes factor 262 bits, ‘‘decisive evidence’’; approximate maximum-likelihood test, 2Dlog(L)¼342,P,105; both using the HCR set]. To illustrate the data, Figure 5 shows the inferred jump-size distribution from the HC set and histograms of simulated and observed expression differences.
To investigate whether the expression-mutation distri-bution shows a skew of the type observed by Khaitovich et al.(2005a), namely, many small downregulations com-bined with relatively fewer but larger upregulations (positive skew;a.0), we estimated parameters for all four species sets considered. For the two-species phy-logeny, the model has a mathematical symmetry involv-ing swappinvolv-ing the branches and changinvolv-ing the sign ofa, and we consequently fixed the sign ofafor the HC set, but not for the other sets. The estimates foraon the HC and HCR sets were 0.58 (95% C.I. 0.53–0.62) and 0.44 (0.41–0.46), respectively (see Table 2). We also applied our inference procedure directly on the probes (86,818 probes from 11,309 probe sets) to test the robustness of our results against errors in gene or chip annotations, resulting in similar estimates [HC,a¼0.53 (0.50–0.55);
HCR,a¼0.31 (0.29–0.33); Table 3] and confirming the skew previously reported. The s-parameter was esti-mated to be comparatively low at 0.07 (0.05–0.12) for HC and 0.08 (0.05–0.11) for HCR, and similar estimates were obtained on raw probe data [HC, 0.06 (0.05–0.1); HCR, 0.24 (0.22–0.26)]. To test whether different normalization procedures influenced these results, we also applied the inference procedure on the data set without interspecies QQ normalization (nn). Inferen-ces on both the HC and the HCR sets were similar to those obtained on the QQ set (supplemental Tables 4 and 5).
Estimates of the branch lengths from human (t1) and
chimpanzee (t2) to their most recent common ancestor
of human and chimp were consistent between the data sets, both fort1[HC, 1.42 (1.25–1.65); HCR, 1.19 (1.1–
1.31)] and for t2 [HC, 0.42 (0.33–0.52); HCR, 0.42
(0.36–0.48)], as expected since our simulations showed that in these parameter ranges (jaj.s), the evolution-ary parameters and branch lengths can be accurately estimated even for just two species. The ratiot1/t2was
estimated separately at 3.38 (2.66–4.43) for HC and 2.87 (2.43–3.42) for HCR. Similar estimates were obtained for raw probe data [HC, 3.07 (2.76–3.5); HCR, 2.14 (1.99–2.32)], suggesting that more gene-expression changes have occurred on the human than on the chim-panzee branch since the split with their most recent common ancestor.
Finally, we analyzed the data sets that include orang-utan. On the HCO set, estimates foraandswere 0.45 (0.42–0.47) and 0.08 (0.05–0.13), respectively, consis-tent with those on HCR and HC. The branch length estimatest1andt2are also consistent (Tables 2 and 3);
however, the estimated branch length from the root to the human/chimpanzee ancestor is very large [t4¼2.34
(2.09–2.62)], while the orangutan branch is very short at t3¼0.28 (0.16–0.41). Analyzing all four species together
(HCOR), we find that the inferred value ofachanged sign [0.43 (0.45–0.41)], and the branch to orang-utan is now the longest in the tree [t3¼1.77 (1.66–1.88)]
(Figure 4). In addition, the estimate for the outlier model parameterpon this data set is 0.49 with a wide confidence interval (0.03–0.97); in contrast, in all other cases the upper 95% confidence limit forpdid not exceed 0.02.
Figure5.—(a) Jump-size distribution
We propose an interpretation of these results in the
discussion.
DISCUSSION
We have introduced a model and an algorithm that allowed us to calculate the likelihood of gene-expression
data evolving along a phylogenetic tree. The model, which is a departure from the diffusion or Brownian motion models often used for describing the evolu-tion of quantitative traits, was specifically adapted for the study of gene-expression levels. Under the model, expression levels evolve along the branches of a phylo-genetic tree by discrete mutation events, which occur stochastically at a certain rate. Each event modifies the
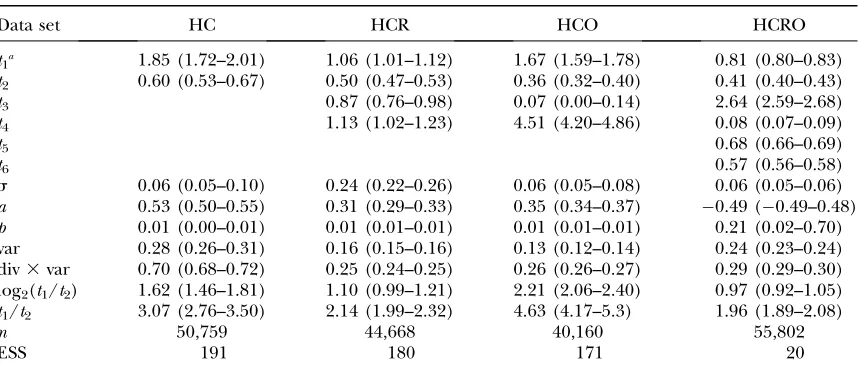
TABLE 3
Inferred human–chimp expression evolution parameters from probe data
Data set HC HCR HCO HCRO
t1a 1.85 (1.72–2.01) 1.06 (1.01–1.12) 1.67 (1.59–1.78) 0.81 (0.80–0.83) t2 0.60 (0.53–0.67) 0.50 (0.47–0.53) 0.36 (0.32–0.40) 0.41 (0.40–0.43)
t3 0.87 (0.76–0.98) 0.07 (0.00–0.14) 2.64 (2.59–2.68)
t4 1.13 (1.02–1.23) 4.51 (4.20–4.86) 0.08 (0.07–0.09)
t5 0.68 (0.66–0.69)
t6 0.57 (0.56–0.58)
s 0.06 (0.05–0.10) 0.24 (0.22–0.26) 0.06 (0.05–0.08) 0.06 (0.05–0.06) a 0.53 (0.50–0.55) 0.31 (0.29–0.33) 0.35 (0.34–0.37) 0.49 (0.49–0.48) p 0.01 (0.00–0.01) 0.01 (0.01–0.01) 0.01 (0.01–0.01) 0.21 (0.02–0.70) var 0.28 (0.26–0.31) 0.16 (0.15–0.16) 0.13 (0.12–0.14) 0.24 (0.23–0.24) div3var 0.70 (0.68–0.72) 0.25 (0.24–0.25) 0.26 (0.26–0.27) 0.29 (0.29–0.30) log2(t1/t2) 1.62 (1.46–1.81) 1.10 (0.99–1.21) 2.21 (2.06–2.40) 0.97 (0.92–1.05) t1/t2 3.07 (2.76–3.50) 2.14 (1.99–2.32) 4.63 (4.17–5.3) 1.96 (1.89–2.08)
n 50,759 44,668 40,160 55,802
ESS 191 180 171 20
Estimates (posterior medians and 95% credible intervals) of branch lengths and model parameters from probe level data are shown, using various choices of outgroups. For inferences on data without quantile–quantile normalization see supplemental Table 5.
a
Parameters are as in Table 2.
TABLE 2
Inferred human–chimp expression evolution parameters from probe-set data
Data set HC HCR HCO HCRO
t1a 1.42 (1.25–1.65) 1.19 (1.10–1.31) 1.20 (1.11–1.33) 0.82 (0.77–0.88) t2 0.42 (0.33–0.52) 0.42 (0.36–0.48) 0.28 (0.23–0.33) 0.32 (0.29–0.35)
t3 0.95 (0.81–1.08) 0.28 (0.16–0.41) 1.77 (1.66–1.88)
t4 1.31 (1.15–1.48) 2.34 (2.09–2.62) 0.15 (0.10–0.19)
t5 1.0 (0.9–1.1)
t6 0.34 (0.26–0.41)
s 0.07 (0.05–0.12) 0.08 (0.05–0.11) 0.08 (0.05–0.13) 0.27 (0.25–0.30) a 0.58 (0.53–0.62) 0.44 (0.41–0.46) 0.45 (0.42–0.47) 0.43 (0.45–0.41) p 0.01 (0–0.01) 0.01 (0.01–0.01) 0.01 (0.00–0.01) 0.49 (0.03–0.97) var 0.34 (0.29–0.40) 0.20 (0.18–0.22) 0.21 (0.19–0.23) 0.26 (0.25–0.28) div3var 0.63 (0.59–0.67) 0.32 (0.30–0.34) 0.31 (0.29–0.33) 0.30 (0.29–0.31) log2(t1/t2) 1.8 (1.4–2.2) 1.5 (1.3–1.8) 2.1 (1.8–2.4) 1.4 (1.2–1.6)
t1/t2 3.4 (2.7–4.4) 2.9 (2.4–3.4) 4.3 (3.5–5.4) 2.6 (2.3–3.0)
n 9,806 8,303 9,273 10,427
ESS 951 536 334 354
Estimates (posterior medians and 95% credible intervals) of branch lengths and model parameters from probe-set level data, using various choices of outgroups: none (HC, human–chimp), one outgroup (rhesus macaque, HCR; or orangutan, HCO), or two outgroup species (HCRO). For inferences from data without quantile–quantile normalization see supplemental Table 4.
a
expression intensity on an additive scale, by an amount drawn from a jump-size distribution that may exhibit a nonzero skewness. Using this model, we implemented a Bayesian MCMC procedure for the inference of param-eters and branch lengths and for hypothesis testing.
The existence of a positively skewed mutation spec-trum for expression levels was suggested previously by Khaitovichet al. (2005b), on the basis of the
observa-tion that the distribuobserva-tions of expression differences be-tween human and chimpanzee were skewed. Assuming this positively skewed mutation spectrum, Khaitovich et al. (2005b) inferred that genes expressed in the brain have undergone more expression mutations in the hu-man lineage than in the chimpanzee lineage. However, this conclusion depends crucially on the premise of a positively (rather than negatively) skewed mutation spectrum. Since the expression data in these studies were obtained using expression arrays designed for hu-man samples, and mismatching probes for orangutan samples could not be reliably identified because of the lack of genome sequence, some doubt remained about these conclusions.
Here we revisit these observations. We developed an algorithm to calculate the likelihood of expression data under the skewed mutation model, enabling the in-ference of the phylogeny, evolutionary parameters, and confidence intervals using MCMC. We adjoined an outlier model allowing a proportion of data points to evolve essentially without constraint, to ensure that a small proportion of spurious data would not unduly bias the inferred parameters of the main model. Another innovation is the use of a variance-stabilizing trans-formation, which decouples the interspecies variance from the intensity, allowing the same evolutionary model to be applied to all transcripts whatever their intensity of expression. Finally, we accounted explicitly for intraspecific variation due to experimental error, as well as environmental and genetic variances. We applied the model to various combinations of H, C, O, and R data, each obtained using human microarrays. Probes that showed mismatches in homologous position in chimp or macaque were removed from the analysis. Because the same could not be done for orangutan, we separately analyzed data sets that included this primate. We found clear evidence for the existence of a positive skew in the mutation spectrum of gene-expression levels in our analyses of the HC and HCR data sets, confirming the original observation by Khaitovichet al.(2005b).
The inferred parameters remain essentially the same when all probes are used individually, rather than grouped per gene, and were also robust against changes to the normalization procedure. The simulation study showed that inferences in these parameter ranges are reliable, for both the two-species and the three-species case.
What could have caused the observed skew? A non-zero skewness in the mutation spectrum confers a direction to the evolutionary ‘‘arrow of time.’’ This does
not necessarily imply that the underlying process in-volves selection (as opposed to purely mutational forces); for example, the high mammalian mutation rate of CpG dinucleotides results in a mutation bias directed away from CpGs, while an equivalent reverse bias does not exist, conferring a directionality to this process without involving selection (Lunterand Hein2004).
Neverthe-less, it seems difficult to construct a plausible, purely mutational mechanism that would lead to a skewed spectrum of expression-level changes. Alternatively, we might consider a scenario involving selection to maintain expression levels at roughly constant values. Since tran-scription initiation involves many genomic sites, nucleo-tide mutations that influence its efficiency are likely to be relatively frequent. For example, our results suggest that between human and chimpanzee there have been on average 1.5 mutations per gene that affected expres-sion levels. According to Kimura’s neutral theory, nega-tive (purifying) selection and drift will remove the majority of mutations, and those that become fixed and are observed as substitutions in interspecies comparisons will either be neutral or slightly deleterious (Ohta1973).
This process has a hidden directionality: random muta-tions increase entropy; in particular, they tend to de-crease, rather than inde-crease, the affinity of transcription factor binding sites. Thus, a succession of random (un-selected) mutations may be expected to lead to a diminished expression of the transcript, building up an associated ‘‘fitness deficit.’’ This creates an opportunity for less frequent, ‘‘corrective’’ mutations that increase the efficiency of transcription by a relatively large amount to sweep to fixation, after which the process starts anew. Although the last step will of course have all the population-genetic characteristics of a selective sweep, it would be quite false to think of it as ‘‘positive selection’’ as it is generally understood, since no adaptation to a favored phenotype is involved. Rather, the conservation of a fixed desired phenotype (a particular expression level) is achieved as a dynamic equilibrium involving a combination of continuous deterioration by slightly dele-terious mutations, counterbalanced by occasional cor-rective sweeps. The whole cycle would result in precisely the observed positive skew of the mutational spectrum and indeed appears a plausible model for the observed high turnover of transcription factor binding sites in mammals (Dermitzakis and Clark 2002) and flies
(Moseset al.2006).
and the asymptotics of the actual jump-size distribution might be different.
True positive selection acting upon expression-level mutations is also likely to have contributed to some extent and may also have influenced the observed spectrum. However, it appears implausible that adaptive changes would follow any systematic pattern (i.e., many small downregulations, fewer large upregulations), which would be necessary for it to leave its fingerprint on a genomewide analysis. We therefore propose the dynamic equilibrium of slightly deleterious mutations and occa-sional corrective sweeps, together acting to conserve the expression phenotype, as an explanation for the skewed mutation spectrum of gene-expression levels.
The pronounced skewness allowed us to infer the branch lengths of the human (t1) and chimp (t2)
lineages separately, both with and without macaque as an outgroup. The inferred ratiot1/t2ranges from 2.0 to
4.4, depending on whether macaque was included and whether probes or probe sets were used. This ratio is in the same order of magnitude as previous estimates: analyzing a different data set with a moment approach, Khaitovich et al. (2005a) found that for
brain-ex-pressed genes, the human branch was 3.3 times longer than the chimpanzee branch. Similarly, analyzing brain-expressed genes and restricting the analysis to those 5% exhibiting the highest divergence between human and chimpanzee, Enardet al. (2002a) inferred a phylogeny
in which the human branch was 3.8-fold longer than the chimpanzee branch. Accepting dynamic stabilizing selection as the dominant mode of expression evolu-tion, these observations could be explained by more efficient selection against slightly deleterious mutations affecting transcription factor binding sites in chimpan-zees than in humans, as a result of a larger effective ancestral population size of chimpanzees (Harding
and McVean2004). Interestingly, such strong
acceler-ation of expression changes on the human lineage is not observed in liver, heart, or kidney (Enardet al.2002b;
Khaitovichet al.2005b, 2006; Lemoset al.2005). At the
same time, the skewed distribution of expression changes on the human and on the chimpanzee lineage is ob-served in other tissues, such as liver (Khaitovichet al.
2005b). Thus, the skew appears to be a general feature of expression evolutionary dynamics in primates. In con-trast, the accelerated expression evolution on the human lineage may represent a special case, possibly reflecting an excess of positive selection on the gene-expression changes in the brain along the human lineage. Still, given the imperfections of microarray expression data and the paucity of human and chimpanzee samples analyzed thus far, more effort will be required to uncover the cause of this phenomenon with certainty.
The data sets that included orangutan (HCO and HCOR) gave various discordant results. For the HCO set, we found a highly skewed tree, with a very short branch leading to orangutan, while for HCOR, we
in-ferred negative skewness, as well as a very large contri-bution of the outlier model (49%), while all other data sets support a very small outlier contribution (,2%). The orangutan data are the only set for which we were unable to remove mismatching probes because of the current lack of a genome sequence. The deviations of the overall distribution of orangutan expression levels compared to human, chimp, or macaque (supplemen-tal Figure 3) indeed suggest that this data set is tainted by a small admixture of such mismatching probes, and the discordant inferences are all consistent with this explanation. Indeed, mismatching probes would cause an admixture of genes with apparently much reduced orangutan expression levels, favoring a model that allows occasional very large downregulations. This ex-plains the aberrant tree inferred for the HCO set, since the positioning of the root near the orangutan effec-tively changes the direction of time along much of the branch toward orangutan. Adding the macaque to the phylogeny restricts the root position and forces the large downregulations to be modeled by changing the direction of the mutational skew.
It is satisfying that these data problems, which are nonobvious particularly after QQ normalization, were correctly diagnosed by the outlier model. It also serves to reemphasize the need for aggressive cleanup of expression data obtained using expression arrays, espe-cially for cross-species experiments. In this study, the loss of affinity due to random mutations on probe targets within the orangutan genome appears sufficient, in number or effect, to overwhelm the phylogenetic patterns we observe in the other data sets.
The proposed evolutionary model is an approxima-tion of the actual process of gene-expression evoluapproxima-tion. Perhaps the most questionable assumption we make is that one set of parameters describes the evolution of expression patterns across all genes. We, however, expect that our main conclusions (fast evolution on the human branch and a distinct skew of the mutation spectrum) are robust against even quite strong devia-tions from this assumption, because the expected number of mutations on the phylogeny is modest (approximately four), assigning reasonable probability to instances with no mutations, while very fast-evolving genes are absorbed into the outlier model.
corrective sweeps. We also find evidence for a larger number of expression-level changes in the human lineage compared to chimp, which taken by itself could point to a more efficient action of selection in the ancestral chimpanzee population owing to its larger ancestral population size, but is also compatible with extensive positive selection on brain-expressed genes in the human lineage. Gene-expression levels have long been suggested to underlie differences between species, and we hope that the method proposed here will help to better understand the role of gene regulatory changes in the evolution of our and other species.
We thank the two anonymous reviewers for their helpful comments. R.C. was supported by the European Molecular Biology Organization and the Fyssen foundation; G.L. by the Medical Research Council and the Engineering and Physical Sciences Research Council (code HAMKA); P.K. and M.S. by the Chinese Academy of Sciences and the Max Planck Society; and D.P.K. by the Vienna Science and Technology Fund, the Austrian Centre of Biopharmaceutical Tech-nology, Austrian Research Centres Seibersdorf, and Baxter AG.
LITERATURE CITED
Bolstad, B. M., 2004 Low level analysis of high-density
oligonucle-otide array data: background, normalization and summarization. Ph.D. Thesis, University of California, Berkeley, CA.
Dai, M., P. Wang, A. D. Boyd, G. Kostov, B. Athey et al.,
2005 Evolving gene/transcript definitions significantly alter the interpretation of GeneChip data. Nucleic Acids Res.33:e175.
deMeaux, J., U. Goebel, A. Popand T. Mitchell-Olds, 2005
Allele-specific assay reveals functional variation in the chalcone synthase promoter of Arabidopsis thaliana that is compatible with neutral evolution. Plant Cell17:676–690.
Denver, D. R., K. Morris, J. T. Streelman, S. K. Kim, M. Lynchet al.,
2005 The transcriptional consequences of mutation and natu-ral selection in Caenorhabditis elegans. Nat. Genet.37:544–548. Dermitzakis, E. T., and A. G. Clark, 2002 Evolution of
transcrip-tion factor binding sites in mammalian gene regulatory regions: conservation and turnover. Mol. Biol. Evol.19:1114–1121. Durbin, R., S. Eddy, A. Kroghand G. Mitchison, 1998 Biological
Sequence Analysis.Cambridge University Press, Cambridge, UK/ London/New York.
Edwards, A. F. W., and L. L. Cavalli-Sforza, 1964 Reconstruction
of evolutionary trees, pp. 67–76 inPhenetic and Phylogenetic Clas-sification, edited by W. H. Heywoodand J. McNeill.Systematics
Association, London.
Enard, W., P. Khaitovich, J. Klose, S. Zollner, F. Heissiget al.,
2002a Intra- and interspecific variation in primate gene expres-sion patterns. Science296:340–343.
Enard, W., M. Przeworski, S. E. Fisher, C. S. Lai, V. Wiebeet al.,
2002b Molecular evolution of FOXP2, a gene involved in speech and language. Nature418:869–872.
Felsenstein, J., 1973 Maximum-likelihood estimation of
evolution-ary trees from continuous characters. Am. J. Hum. Genet.25:
471–492.
Felsenstein, J., 1981 Evolutionary trees from DNA sequences: a
maximum likelihood approach. J. Mol. Evol.17:368–376. Felsenstein, J., 2004 Inferring Phylogenies. Sinauer Associates,
Sunderland, MA.
Frigo, M., and S. G. Johnson, 2005 The design and
implementa-tion of FFTW3. Proc. IEEE93:216–231.
Gilad, Y., S. A. Rifkin, P. Bertone, M. Gersteinand K. P. White,
2005 Multi-species microarrays reveal the effect of sequence di-vergence on gene expression profiles. Genome Res.15:674–680. Gilad, Y., A. Oshlack, G. K. Smyth, T. P. Speedand K. P. White,
2006 Expression profiling in primates reveals a rapid evolution of human transcription factors. Nature440:242–245.
Harding, R. M., and G. McVean, 2004 A structured ancestral
pop-ulation for the evolution of modern humans. Curr. Opin. Genet. Dev.2004:667–674.
Hsieh, W. P., T. M. Chu, R. D. Wolfinger and G. Gibson,
2003 Mixed-model reanalysis of primate data suggests tissue and species biases in oligonucleotide-based gene expression pro-files. Genetics165:747–757.
Huber, W., A.vonHeydebreck, H. Sultmann, A. Poustkaand M.
Vingron, 2002 Variance stabilization applied to microarray
data calibration and to the quantification of differential expres-sion. Bioinformatics18(Suppl. 1): S96–S104.
Jeffreys, A. J., R. Neumann, M. Panayi, S. Myersand P. Donnelly,
2005 Human recombination hot spots hidden in regions of strong marker association. Nat. Genet.37:601–606.
Keightley, P. D., M. J. Lercherand A. Eyre-Walker, 2005
Evi-dence for widespread degradation of gene control regions in hominid genomes. PLoS Biol.3:e42.
Khaitovich, P., G. Weiss, M. Lachmann, I. Hellmann, W. Enard
et al., 2004 A neutral model of transcriptome evolution. PLoS Biol.2:E132.
Khaitovich, P., I. Hellmann, W. Enard, K. Nowick, M. Leinweber
et al., 2005a Parallel patterns of evolution in the genomes and tran-scriptomes of humans and chimpanzees. Science309:1850–1854. Khaitovich, P., S. Paaboand G. Weiss, 2005b Toward a neutral
evolutionary model of gene expression. Genetics170:929–939. Khaitovich, P., K. Tang, H. Franz, J. Kelso, I. Hellmannet al.,
2006 Positive selection on gene expression in the human brain. Curr. Biol.16:R356–R358.
King, M. C., and A. C. Wilson, 1975 Evolution at two levels in
hu-mans and chimpanzees. Science188:107–116.
Lande, R., 1976 Natural selection and random genetic drift in
phe-notypic evolution. Evolution30:314–334.
Lemos, B., C. D. Meiklejohn, M. Caceres and D. L. Hartl,
2005 Rates of divergence in gene expression profiles of pri-mates, mice, and flies: stabilizing selection and variability among functional categories. Evol. Int. J. Org. Evol.59:126–137. Lunter, G., and J. Hein, 2004 A nucleotide substitution model with
nearest-neighbour interactions. Bioinformatics 20(Suppl. 1): I216–I223.
Lynch, M., and W. G. Hill, 1986 Phenotypic evolution by neutral
mutation. Evolution40:915–935.
Moses, A. M., D. A. Pollard, D. A. Nix, V. N. Iyer, X. Y. Liet al.,
2006 Large-scale turnover of functional transcription factor binding sites in Drosophila. PLoS Comput. Biol.2:e130. Nuzhdin, S. V., M. L. Wayne, K. L. Harmonand L. M. McIntyre,
2004 Common pattern of evolution of gene expression level and protein sequence in Drosophila. Mol. Biol. Evol.21:1308–1317. Oakley, T. H., Z. Gu, E. Abouheif, N. H. Patel and W. H. Li,
2005 Comparative methods for the analysis of gene-expression evolution: an example using yeast functional genomic data. Mol. Biol. Evol.22:40–50.
Ohta, T., 1973 Slightly deleterious mutant substitutions in
evolu-tion. Nature246:96–98.
Oshlack, A., A. E. Chabot, G. K. Smythand Y. Gilad, 2007 Using
DNA microarrays to study gene expression in closely related spe-cies. Bioinformatics23:1235–1242.
Rifkin, S. A., J. Kimand K. P. White, 2003 Evolution of gene
expres-sion in the Drosophila melanogaster subgroup. Nat. Genet.33:
138–144.
Turelli, M., J. H. Gillespieand R. Lande, 1988 Rate tests for
selec-tion on quantitative characters during macroevoluselec-tion and mi-croevolution. Evolution42:1085–1089.
Voolstra, C., D. Tautz, P. Farbrother, L. Eichingerand B. Harr,
2007 Contrasting evolution of expression differences in the tes-tis between species and subspecies of the house mouse. Genome Res.17:42–49.
Wu, Z., R. A. Irizarry, R. Gentleman, F. MartinezMurilloand F.
Spencer, 2004 A model based background adjustment for
oligo-nucleotide expression arrays. Department of Biostatistics Working Papers, Working Paper 1. Johns Hopkins University, Baltimore. http://www.bepress.com/jhubiostat/paper1/.