Analysis of Supply Chain Model for Optimum
Question paper Delivery system Using Genetic
Algorithm with Simulated Annealing
N.Subramani1, Dr.J.Ganesh Murali2, Dr.P.Suresh3, J.Anish Jafrin Thilak4, V.V.Arunsankar5
Assistant Professor, Department of Mechanical Engineering, Karpagam College of Engineering, Coimbatore, India 1,4&5
Professor, Department of Mechanical Engineering, Karpagam College of Engineering, Coimbatore, India2&3
ABSTRACT: Transportation of goods constitutes an important part of in–bound as well as out-bound logistics of Supply Chain Management (SCM). Efficient distribution of goods and services is of vital importance in today’s competitive market, as transportation constitutes a considerable portion of the trading price of most products or services. Supply Chain Management (SCM) is now at the centre stage of manufacturing and service organizations. According to the strategies in markets, supply chains and logistics are naturally being modeled as distributed systems. Supply Chain is the network of suppliers, manufacturing, assembly, distribution and logistics facilities that perform the function of procurement of materials, transformation of these materials into intermediate and finished products and distribution of these finished products to the customers. The task of managing entire supply chain constitutes the core of the Supply Chain Management. The economic importance has motivated both private companies and academic researchers to pursue the use of operations research and management service tools to improve the efficiency of Transportation. Refereeing to such scenario, integration of Genetic Algorithm (GA) with Simulated Annealing (SA) approaches adapted to design the Open Loop supply chain distribution model for the better question paper delivery system.
KEYWORDS: Open Loop model, Simulated Annealing, Genetic Algorithm, SCM, Question paper delivery system
I. INTRODUCTION
A. SUPPLY CHAIN MANAGEMENT
Supply Chain Management (SCM) is now at the centre stage of manufacturing and service organizations. Supply chain Management is the Procurement of raw material to the shop by the suppliers, from the shop to production unit for manufacturing by the manufacturer, then assembling by the employees and the finished goods to the market by effective way and to customers. The task of managing the entire supply chain constitutes the core of the Supply Chain Management. The type of vehicles and the route to be followed by each vehicle to service customer’s demands, decisions related with transportation aspect of logistics management are an important part of supply chain decisions. This analysis addresses the transportation of distribution logistics in SCM. The problem has been modelled as a classical routing problem.
B. THE CONVENTIONAL TRAVELING SALESMAN PROBLEM
time and time windows within which the service must begin. The latter problem is referred to ad the VRP with Time Windows (VRPTW). Furthermore, having to deal with aspects such as multiple depots and commodities complicates the models further. Solution methods include exact methods such as mathematical programming, but custom designed heuristics and Meta heuristics such as Genetic Algorithm (GA), tabu search and Simulated Annealing (SA) have also been applied to the VRP.
Then, the asymmetric TSP can be formulated as follows:
min
n
l i
CijXij
s.t (1)
1
n
l i
Xij
where j = 1, ……, n.,(2)
1
n
l i
Xij
where i = 1, ……, n.,(3) Xij {0,1} where j = 1, ……, n., i = 1, ……, n.,
We set up the problem by numbering each of the n cities as C1,…, Cn; a tour is then just a permutation, say (k1, k2, k3,…,
kn) of (1,…, n). We interpret this as the tour which starts at Ck1, then goes to Ck2 and so on, running through the remaining cities up to and including Ckn before finally completing the tour back at Ck1. It is thus clear than we can permute the permutation cyclically without changing the tour. There is no loss of generality then is assuming that Ck1 =
C1; it is then clear that there are (n – 1)! Different tours. This also shows that solving the problem by exhaustive enumeration is infeasible unless there are very few cities.
II. LITERATURE
Chan et al (2007) have proposed a multiple ant colony optimization to design a balanced and efficient supply chain network that maintains the best balance of transit time and customer service. They focused on effective allocation of the customers to the Distributed Centers (DC’s) with the two fold objective of minimization of the transit time and degree of imbalance of the DC’s. The proposed technique shows better performance considering both negative and positive feedback in search of optimum results. A Mixed Integer Linear Programming (MILP) model have been proposed to describe the optimization problem. A case study for the coatings business unit of a global specialty chemicals manufacturer is used to demonstrate the applicability of the approach in a number of scenarios (Panagiotis Tsiakis et al 2008). Huang et al (2008) have designed a supply chain network in uncertain environment, in which the demands of the customer are taken as random variables and the operation cost involved are programmed using fuzzy neural network and optimized by particle swarm optimization to solve the established model. From the above discussion, it was observed that particle swarm algorithm is successfully applied in various supply chain optimization problems.
III. INTRODUCTION TO GENETIC ALGORITHM AND SIMULATED ANNEALING
GAs has been used for problem solving and for modeling. GAs are applied to many scientific, engineering problems, in business and entertainment, including: optimization, automatic programming, machine and robot learning, economic models, immune system models, ecological models, population genetics models, interactions between evolution and learning and models of social systems. [Goldberg]. The algorithm operates through a simple cycle:
1. Creation of a population of strings. 2. Evaluation of each string. 3. Selection of the best strings.
4. Genetic manipulation to create a new population of strings.
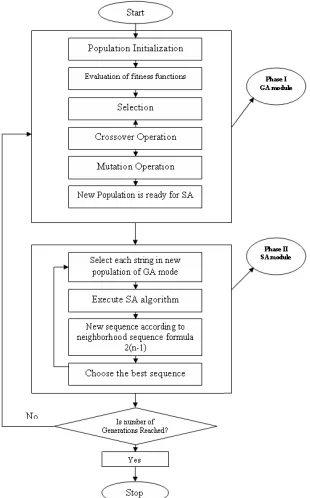
SA is a generalization of a Monte Carlo method for examining the equations of state and frozen states of n-body systems. The concept is based on the manner in which liquids freeze or metals recrystalize in the process of annealing. In an annealing process a melt, initially at high temperature and disordered, is slowly cooled so that the system at any time is approximately in thermodynamic equilibrium. As cooling proceeds, the system becomes more ordered and approaches a “frozen” ground state at T=0. Hence the process can be though of as an adiabatic approach to the lowest energy state. F the initial temperature of the system is too low or cooling is done insufficiently slowly the system may become quenched forming defects or freezing out in metastable states (ie. trapped in a local minimum energy state). The GA-SA algorithm is explained in the below. Many researchers have proposed the concept of joining the two powerful optimization techniques namely GA and SA. The steps followed are given below.
Step 1: Initialize the parameters of the GA Step 2: Generate the initial population Step 3: Execute GA for one generation For each of the Chromosomes do the following Step 4: Initialize the parameters of SA
Step 5: Improve the quality of solution using SA and the string with the best solution is returned to the new population of GA Step 6: Repeat the steps 3 and 4 for required number of generations.
The neighborhood generation scheme used in SA is a single insertion neighborhood generation scheme used in SA is a single insertion neighborhood scheme. The main goal is to minimize square error (intra-class dissimilarity). The variations of K-Means is initialization (select the number of clusters, initial partitions), Updating of centre and Hill-climbing (trying to move an object to another cluster). Figure 1 shows the flowchart for the GA-SA algorithm.
IV. DESIGN OF OPTIMUM QUESTION PAPER DELIVERY SYSTEM
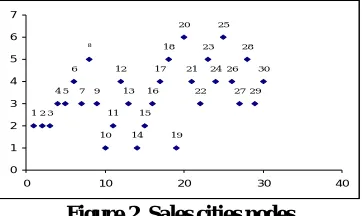
K-means clustering is an algorithm to classify or to group the objects based on attributes/features into k number of group. K is a positive integer number. After clustering the unoptimal route and distance is given in Table 1. The unoptimal route and distance is arrived by using random walker method. The comparisons of K-Means GA, SA and GA-SA values are given in Table 2. The indicate of nodal points is shown in Figure 2. The grouping is done by minimizing the sum of squares of distances between data and the corresponding cluster centroid for the case study of question paper delivery system.
Table 1 Optimal route and distance
Sales person Cities allotted Total number of
cities Distance to travel
1 9-8-6-7-1-2-3-5-4-12 10 12,892
2 17-3-25-20-21-23 06 10,685
3 24-26-30-32-28-29-27 07 11,343
4 14-13-10-11-16-15-19 07 11,658
Table 2 Comparison of K-Means GA, SA and GA-SA
Sales person Unoptimized
Distance
Genetic Algorithm
Simulated
Annealing GA-SA
1 12,892 12,231 12,001 11,452
2 10,685 10,006 9,862 9,501
3 11,343 10,786 10,546 10,005
4 11,658 11,031 10,892 10,263
Average percentage of Improvement:11% to 14%
1 2 3 4 5 7 9
10 11 12 13 14 15 16 17 18 19 20 21 22 23 24 25 26 27 28 29 30 6 8 0 1 2 3 4 5 6 7
0 10 20 30 40
Figure 2 Sales cities nodes
The algorithm is composed of the following steps:
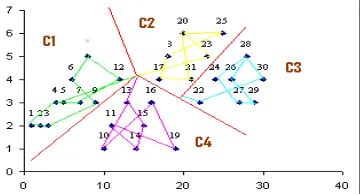
a. Place K points into the space represented by the objects that are being clustered. These points represent initial group centroids.
b. Assign each object to the group that has the closest centroid.
c. When all objects have been assigned, recalculate the positions of the K centroids.
Figure 3 K-Means Clustering
By adopting K-Means cluster algorithm, we have calculated and compared the optimum results by using GA with SA. Then it is proved to obtaining better nearer optimal solutions for TSP (Figure 4).
Figure 4. Sequence Route obtained from Simulate Annealing with Genetic Algorithm
From the results obtained, it was clearly indicated that K-Means clustering algorithm proved to be effective as it was able to group the cities into clusters in an optimal manner. From the results it is evident that integrated GA-SA is better algorithm for a Traveling salesman problem than Genetic Algorithm and Simulated Annealing.
V. COST ANALYSIS OF QUESTION PAPER DELIVERY SYSTEM
Supply chain cost can be reduced by determining the number of warehouse and allocating distribution centers to warehouse effectively. This problem was solved using K-Means GA-SA. This work proposes to determine the clusters of distribution centers assigned to each warehouse and distribution costs are calculated for different cluster sizes. K-Means GA-SA has been developed for effectively allocating distribution centers to warehouses. The problem can be solved for determining the location of warehouses thereby minimizing the transportation costs. By consolidating the number of warehouses, fixed cost and the transportation distance, the distribution cost is minimized. As the number of warehouses decreases, the total distance to be traveled from warehouses to Distribution Centers (DC’s) will increase. The results obtain by K-Means GA-SA method is compared with GA and SA separately. K-Means GA-SA is found to be better among the three methods for effective allocation and to determine the required number of warehouse, it is shown in Table 3. From the results, it can be observed that K-Means GA-SA can increase the cost saving in supply chain upto 18.42%, by effectively allocating distribution centers to warehouses across the supply chain and determine the number of warehouses need for reducing the supply chain distribution costs.
Table 3 Percentage of cost saving with the introduction of K-GA-SA S.
No.
No. of cities
Without clustering Transportation Cost
With two cluster With three cluster
Cost Cost saving (%) Cost Cost Saving (%)
1 10 6000 5200 15.38 5500 9.09
2 12 7000 6000 16.67 6400 9.38
3 14 8000 7100 12.67 6900 15.94
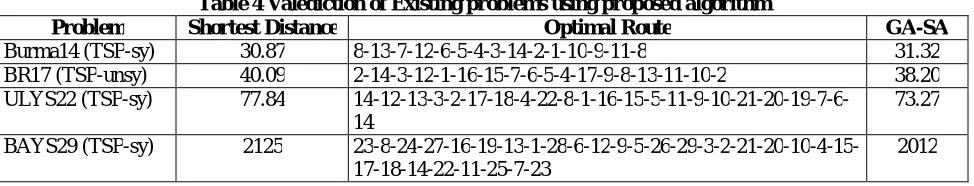
6. Valediction of Proposed Algorithm
The validity of the proposed model is tested with the realistic problems taken from Reinelt (1994). The results shows (Table 4) the proposed algorithm is produced better results and nearer to the solutions given in TSPLIB95.
Table 4 Valediction of Existing problems using proposed algorithm
Problem Shortest Distance Optimal Route GA-SA
Burma14 (TSP-sy) 30.87 8-13-7-12-6-5-4-3-14-2-1-10-9-11-8 31.32 BR17 (TSP-unsy) 40.09 2-14-3-12-1-16-15-7-6-5-4-17-9-8-13-11-10-2 38.20 ULYS22 (TSP-sy) 77.84
14-12-13-3-2-17-18-4-22-8-1-16-15-5-11-9-10-21-20-19-7-6-14
73.27
BAYS29 (TSP-sy) 2125 23-8-24-27-16-19-13-1-28-6-12-9-5-26-29-3-2-21-20-10-4-15-17-18-14-22-11-25-7-23
2012
In all the problem are assumed and 100 iterations are performed and the results are given and compared with exact results. The matrix in all the problems given show the distances between the cities ‘i’ to ‘j’. The computer time for smaller size problems say less than 20 cities only below two minutes. All the programs are executed on Pentium IV processor under Microsoft windows 2003 operating system.
VI. CONCLUSION
The performance of the algorithms GAs, SA, Hybrid search algorithm combining GA and SA called Hybrid GA-SA algorithm, K-means Cluster based heuristic, Hybrid K-Means Cluster based heuristic-GA, Hybrid K-Means Cluster based heuristic- GA-SA for ATSP are evaluated by considering Question paper delivery system. Case study is taken from the real time question paper delivery system to study the proposed models and an optimal route has been suggested to the organization to minimize the transportation cost. When comparing the K- Means Cluster based heuristic withal optimization technique algorithms, it is evident that K-Means cluster based heuristic performs better than GA. When K- Means Cluster based heuristic hybrid with GA-SA, it performs better than K- Means Cluster based heuristic. But, as a whole, K- Means Cluster based heuristic hybrid with GA and the Hybrid K-Means Cluster based heuristic –GA-SA performs better to design the optimal supply chain model for the question paper delivery system.
REFERENCES
1) Altiparmak F., Gen M., Lin L. and Paksoy T. (2006), ‘A genetic algorithm for multi-objective optimization of supply chain networks’,
Computers and Industrial Engineering, Vol.51, pp.197-216.
2) Chan F.T.S., Kumar N. and Choy K.L. (2007), ‘Decision making approach for the distribution centre location problem in a supply chain
network using the fuzzy-based hierarchical concept’, Proceedings of The Institution of Mechanical Engineers Part B: Journal of Engineering Manufacture, Vol.221, pp.725-739.
3) Chiung Moon et al., (2002) An efficient GA for the TSP with precedence constraints. European Journal of Operational Research. 140, 606-617.
4) Dantzing, B.G. and J.H. Ramser (1959) The truck-dispatching problem Management Sciences, 6(1), 80-91.
5) Giovanni Righini and Marco Trubian (2002) A note on the approximation of the asymmetric TSP. Discrete Optimization, 13 May.
6) In –Chan Choi et al., (2003) A GA with a mixed region search for the asymmetric TSP. computers & Operations Research 30, 773-786.
7) Jeff Ferrio and John Wassick (2008), ‘Chemical supply chain network optimization’, Computers and Chemical Engineering, Vol.32, pp.
2481-2504.
8) Jiuping Xu, Qiang Liu and Rui Wang (2008), ‘A class of multi-objective supply chain networks optimal model under random fuzzy
environment and its application to the industry of Chinese liquor’, Information Sciences, Vol.178, pp.2022-2043.
9) Kirkpatrick, S., C. D. Gelatt, Jr. and M.P. Vecchi (1983) Optimization by SA, Science, Number 4598, 13 May.
10) Lenstra, J. and K.A. Rinnooy (1981) Complexity of vehicle routing and scheduling problems. Networks, 11 221-227.
11) Narahari, Y and S. Biswas (2000) supply chain management the role of models proceedings of the international conference on intelligent flexible autonomous manufacturing systems, January 10-12.
12) Panagiotis Tsiakis and Papageorgiou L.G. (2008), ‘Optimal production allocation and distribution supply chain networks’, International Journal
of Production Economics, Vol.111, pp.468-483.
13) Reinelt G. (1994), ‘The Traveling Salesman: Computational Solutions for TSP Applications’, LNCS, Springer Verlag, Vol.840.
15) Steuer R.E. (1986), ‘Multiple Criteria Optimization: Theory, Computation and Application’, Wiley, New York.
16) [email protected] and [email protected]
17) www.chipdocs.com/datasheets/datasheet-pdf
18) www.logistik-heute.de
19) Zegordin S.H., Itoh K. and Enkawa T. (1995), ‘Minimizing makespan for flow shop scheduling by combining simulated annealing with
sequencing knowledge’, European Journal of Operations Research, Vol.85, pp.515-531.
20) Zhou G., Min H. and Gen M. (2002), ‘The balanced allocation of customers to multiple distribution centers in the supply chain network: A