DOI: 10.1534/genetics.105.054452
Test of Association Between Haplotypes and Phenotypes in Case–Control
Studies: Examination of Validity of the Application of an Algorithm
for Samples From Cohort or Clinical Trials to Case–Control
Samples Using Simulated and Real Data
Shiori Furihata,*
,†,1Toshikazu Ito
†and Naoyuki Kamatani*
,‡,2*Algorithm Team, Japan Biological Information Research Center ( JBIRC), Japan Biological Informatics Consortium ( JBIC), Tokyo 135-0064, Japan,†Mitsubishi Research Institute, Tokyo 100-8141, Japan and‡Division of Genomic Medicine,
Department of Advanced Biomedical Engineering and Science and Institute of Rheumatology, Tokyo Women’s Medical University, Tokyo 162-0054, Japan
Manuscript received December 7, 2005 Accepted for publication September 1, 2006
ABSTRACT
The use of haplotype information in case–control studies is an area of focus for the research on the association between phenotypes and genetic polymorphisms. We examined the validity of the application of the likelihood-based algorithm, which was originally developed to analyze the data from cohort studies or clinical trials, to the data from case–control studies. This algorithm was implemented in a computer program called PENHAPLO. In this program, haplotype frequencies and penetrances are estimated using the expectation-maximization algorithm, and the haplotype–phenotype association is tested using the generalized likelihood ratio. We show that this algorithm was useful not only for cohort studies but also for case–control studies. Simulations under the null hypothesis (no association between haplotypes and phenotypes) have shown that the type I error rates were accurately estimated. The simulations under alternative hypotheses showed that PENHAPLO is a robust method for the analysis of the data from case– control studies even when the haplotypes were not in HWE, although real penetrances cannot be estimated. The power of PENHAPLO was higher than that of other methods using the likelihood-ratio test for the comparison of haplotype frequencies. Results of the analysis of real data indicated that a significant association between haplotypes in theSAA1gene and AA-amyloidosis phenotype was observed in patients with rheumatoid arthritis, thereby suggesting the validity of the application of PENHAPLO for case–control data.
T
HE importance of the analysis of polymorphism data based on linkage disequilibrium and haplo-type structure has increased with the number of avail-able single-nucleotide polymorphism (SNP) markers. Some studies have suggested that phenotypes of indi-viduals are associated with a diplotype configuration (a combination of haplotypes) rather than a SNP geno-type (Horikawa et al. 2000; Sugiura et al. 2002;Tanakaet al. 2002; Uranoet al.2002; Kawaguchiet al.
2003). Since neither haplotypes nor diplotype config-urations of a subject are usually observed, the haplo-type frequencies of the population are inferred using algorithms.
For the analysis of data from either cohort studies or clinical trials, we developed an algorithm for an associ-ation test between individual qualitative phenotypes
and specific haplotypes (Itoet al.2004). This algorithm
estimates diplotype-based penetrances in dominant, recessive, or general relative risk modes; further, it estimates the frequencies in a population.
On the basis of the expectation-maximization (EM) method, the algorithm was implemented in the computer program PENHAPLO. The proportions of affected and unaffected individuals with different dip-lotype configurations can be compared using posterior distribution given the maximum-likelihood estimates of population haplotype frequencies as priors. A number of computer programs have been developed for infer-ring haplotype frequencies in a population (Stephens
et al.2001; Kitamuraet al.2002; Niuet al.2002; Qinet al.
2002; Stephensand Donnelly2003). One advantage
of using PENHAPLO is that the diplotype configuration of each individual need not be determined to test the association between the haplotypes and phenotypes. Rather, the diplotype configurations of some subjects can remain ambiguous. Our previous results showed that PENHAPLO is particularly useful for the analysis of cohort data on the association between haplotypes and phenotypes (Itoet al.2004).
1Present address:Research Center for Advanced Science and Technol-ogy, Mitsubishi Research Institute, 2-3-6 Otemachi, Chiyoda-ku, Tokyo 100-8141, Japan.
2Corresponding author:Division of Genomic Medicine, Department of Advanced Biomedical Engineering and Science and Institute of Rheuma-tology, Tokyo Women’s Medical University, 10-22 Kawada-cho, Shinjuku-ku, Shinjuku, Tokyo 162-0054, Japan. E-mail: [email protected]
A case–control study is another type of useful clinical study for detecting the association between haplotypes and phenotypes. Several methods have been proposed for the analysis of case–control studies on the basis of haplotypes (Fallin et al. 2001; Schaid et al. 2002;
Zaykinet al. 2002; Epstein and Satten 2003; Stram
et al. 2003). Fallin et al. (2001) estimated haplotype
frequencies for cases and controls separately; then, they applied omnibus tests to assess the differences in the overall haplotype frequency profiles between cases and controls. Schaidet al.(2002) and Zaykinet al.(2002)
developed methods for testing the association using a logistic regression model. In these methods, haplotype frequencies were estimated under the assumption that haplotypes were in Hardy–Weinberg equilibrium (HWE) in the population. For a case–control study, this assumption is appropriate under the null hypothesis, in which no association is assumed between haplotypes and phenotypes; however, it does not hold under the alternative hypothesis. If an association between lotypes and phenotypes exists, the proportion of hap-lotypes in the cases does not reflect the haplotype frequencies in the population and may deviate from HWE. The haplotypes positively associated with the phenotypes are observed more often in the cases, and vice versa. Epsteinand Satten(2003) and Stramet al.
(2003) developed methods to overcome this problem. Epstein and Satten (2003) proposed a retrospective
likelihood method in which HWE was assumed only in the controls. Stram et al. (2003) corrected the
likeli-hood by introducing known sampling probabilities of cases and controls from the population, although sam-pling probabilities are rarely known in an actual case– control study. Stramet al.(2003) showed that, as long as
haplotypes were well predicted by SNP genotyping of data, the difference in the risks estimated using cohort likelihood and case–control-based likelihood was low.
We investigate the applicability of PENHAPLO, which is based on cohort likelihood, to case–control studies. We focused on testing the association between haplo-types and phenohaplo-types, but not on inferring haplotype frequencies. In the subsequent section, we briefly de-scribe the algorithm implemented in PENHAPLO. Next, we apply PENHAPLO to analyze simulated case– control data under both the null hypothesis and the alternative hypothesis. The results using PENHAPLO are compared with those using known-phase data. Fi-nally, we apply PENHAPLO to the real data from a case– control study to examine the validity of the method.
METHODS
Likelihood function in the case of cohort studies:
Details of the algorithm implemented in PENHAPLO are described in our previous article Itoet al.(2004). We
briefly describe the parameters and the likelihood function used in the algorithm.
Suppose that there are N subjects in a sample. A qualitative phenotypecifor theith subject occurs with a
probability qk when the subject possesses a diplotype configurationakand a phenotypec1. Throughout this
article, a diplotype configuration is defined as an ordered combination of two haplotypes. Therefore, the maximum value ofkisL2, whereL is the number
of all possible haplotypes. In our algorithm imple-mented in PENHAPLO (Itoet al.2004), we considered
two or three penetrances depending on the mode of inheritance, instead of assigning qk to each possible diplotype configuration. In the dominant mode, the penetrance q1 was assumed to be identical for all
members of D1, the subset that contains diplotype
configurations with at least one phenotype-associated haplotypeH1; on the other hand, the other penetrance qwas assumed for nonmembers ofD1. In the recessive
mode, the penetrances q1 and q were assumed for
members and nonmembers, respectively, of D1, the
subset containing diplotype configurations with twoH1
copies. In the general relative risk mode, three pene-trances were assigned, depending on the number of haplotypeH1copies in the subject.
If the haplotypes are in HWE in the underlying pop-ulation with frequenciesQ¼(u1,. . .,uL), the likelihood function in the dominant or recessive mode is expressed as
LðQ; q1; qÞ
}Y
N
i¼1 X
ak2Ai
Pðdi ¼akjQÞPðci ¼wijdi¼ak;q1;qÞ:
ð1Þ
Here,Aidenotes the set of diplotype configurationsak
for subjectithat are consistent with the observed geno-typegi. diis a diplotype configuration for the subject,wiis the observed phenotype, andN is the number of sub-jects in the observed data. For anyiandk, the probability of the subjectihaving the diplotype configurationakis expressed as a product of the two frequencies of the haplotypes that constituteak. The probability that theith subject develops the observed phenotypewiunder the condition thatdi¼akis expressed as
Pðci¼wijdi¼ak;q1;qÞ
¼
q1 ifwi ¼c1andak2D1
1q1 ifwi 6¼c1andak2D1 q ifwi ¼c1andak;D1
1q ifwi 6¼c1andak;D1:
8 > > > < > > > :
In the general relative risk mode, the likelihood function is expressed as
LðQ;q0;q1;q2Þ
}Y
N
i¼1 X
ak2Ai
Pðdi¼akjQÞPðci¼wijdi¼ak;q0;q1;q2Þ;
where q0, q1, and q2 show the penetrances for the
diplotype configurations that contain zero, one, and two copies of the phenotype-associated haplotypeH1,
respectively. The probability function is expressed as
Pðci¼wijdi¼ak;q0;q1;q2Þ
¼
q0 ifwi ¼c1andak2D0
1q0 ifwi 6¼c1andak2D0
q1 ifwi ¼c1andak;D1
1q1 ifwi 6¼c1andak;D1
q2 ifwi ¼c1andak;D2
1q2 ifwi 6¼c1andak;D2; 8
> > > > > > > > < > > > > > > > > :
where D0, D1, and D2 denote the sets of diplotype
configurations that contain zero, one, and two copies of the members ofH1, respectively. The parameters (Q, q1, andq) or (Q,q0,q1, andq2) are estimated using the
EM method. The maximum likelihood under the null hypothesis,i.e.,q1¼qorq0¼q1¼q2, and that under
the alternative hypothesis,i.e.,q16¼qorq06¼q16¼q2,
were calculated; the generalized likelihood ratio was used to test the association between the phenotype and the diplotype configuration.
Parameters for a case–control study:In a case–control
study, haplotype frequencies of cases or controls exhibit a bias as compared to those of the population if an asso-ciation between the phenotype and the haplotypeH1
exists. The phenotype-associated haplotype is observed more often in cases than in controls. When PENHAPLO is used to analyze the data from a case–control study, parameters r1 and r are estimated instead of the
penetrances q1 and q in the dominant or recessive
mode. In the general mode,r0,r1, andr2are estimated
instead ofq0,q1, andq2, respectively. Here,r1is the ratio
of the number of cases to the total number of subjects of cases and controls for members ofD1, whileris the
same ratio, but for nonmembers ofD1. We assume that r1andrexpress the bias between cases and controls.
The odds ratio OR is estimated usingr1andras
OR¼ r1
1r1
1r r
ð3Þ
(see theappendixfor derivation). If prevalencelof the
disease is known for the population,q1andqcan be
obtained usingr1andras
q1¼
1
ðs=ð1sÞÞðð1r1Þ=r1Þðð1lÞ=lÞ11
; ð4Þ
q¼ 1
ðs=ð1sÞÞðð1rÞ=rÞðð1lÞ=lÞ11
; ð5Þ
wheresdenotes the ratio of the number of cases to the total number of subjects in the sample of a case–control study.
Permutation test for multiple comparison: Neither
the phenotype-associated haplotype nor the mode of inheritance is known in a real analysis. To find the phenotype-associated haplotypes and the mode of in-heritance, all combinations of ‘‘incomplete haplotypes’’ and three modes of inheritance can be tested for the association analysis using PENHAPLO. The concept of incomplete haplotype was defined by Kamatani et al.
(2004) as a subset of a complete haplotype whose members have certain alleles at some of the loci within the region. On the other hand, a ‘‘complete’’ haplotype is defined as a list of alleles at all the loci within the region. For example, *CTGCT defines an incomplete haplotype whose members are the complete haplotypes ACTGCT and GCTGCT if the alleles at the first locus are A and G, respectively. A single allele, such as T at the third position, is also defined as an incomplete haplo-type because it is expressed as **T***.
To control a familywise type I error rate, we evaluate the significance level per test by a permutation test. A familywise type I error rate must be inflated if multiple haplotypes and multiple modes of inheritance are tested. Since incomplete haplotypes are not indepen-dent of each other, the commonly used Bonferroni correction would result in extremely conservative cor-rections for this multiple-testing problem. Therefore, we employ the single-step resampling method pro-posed by Westfalland Young(1993) for evaluating
the significance level per test. The algorithm is as follows:
1. Generate P-values under the null hypothesis for all combinations of the incomplete haplotypes and modes of inheritance that are tested for real data. To obtain theP-values, first, shuffle the phenotype data c, affected or nonaffected, among all the subjects. Then, compute theP-values for the tests. 2. The minimumP-value is adopted for resampled data. 3. Repeat 1–2Mtimes and obtainM P-values.
4. Sort theP-values in ascending order. The (a3M)th
P-value is a significance level per test corresponding to a familywise significant levela.
Simulation 1: validation of the robustness of the
algorithm: We performed simulations to validate the
robustness of the use of PENHAPLO in case–control studies. Type I error rates under the null hypothesis were calculated for the simulation data on the basis of two blocks in different states of linkage disequilibrium. The estimated type I error rates show whether the test statistic used in PENHAPLO approximately follows the
x2-distribution. Under various alternative hypotheses,
with the true values implicitly shows the adequacy of the HWE assumption used in PENHAPLO.
The flow chart of the simulation is shown in Figure 1. We began the simulation by assigning two ordered haplotype copies to each of the 1,000,000 subjects by randomly selecting the haplotype copies usingQ. Next, the phenotype of each subject was stochastically de-termined according to the penetrancesq1andq. The
cases and controls were randomly sampled from affected and unaffected subjects, respectively. After removing the phase information, PENHAPLO was applied to the simulated case–control data for an association test and estimation of odds ratios. Simulta-neously, 232 contingency tables were constructed on the basis of known-phase data and tested for indepen-dence using Pearson’s x2-statistic. In the contingency
tables, the rows indicate whether a subject had at least one copy of a disease-associated haplotype, and the columns indicate casesvs.controls. We also used three other methods (haplotype frequency comparison, dip-lotype frequency comparison, and subject partition) to test the associations using the same simulated data. Using these three methods, the haplotype frequencies were first estimated, followed by the test of association between haplotypes and disease using contingency tables.
In the simulation, we used eitherQobtained from our previous study on serum amyloid A (SAA) genes (Moriguchiet al.2001) or artificially created
distribu-tions (ART). Table 1 shows the haplotypes and their frequencies. TheSAAgene contains six SNPs. They are not in tight linkage disequilibrium, as shown in Figure 2. TheARTdata also contain six SNPs, and the loci from 1 to 3 and those from 5 to 6 are in tight linkage disequilibrium, whereas the other loci are in linkage equilibrium. The penetranceqwas fixed at 0.2 for both
the null and alternative hypotheses, whereas various values ofq1were tested for alternative hypotheses. In
this simulation, we used the dominant mode, in which
q1andqwere given for the subjects with at least one
disease-associated haplotype and those without any, respectively. The simulations were repeated 20,000 times for the null hypothesis and 5000 times for each alternative hypothesis. The numbers of cases were equal to those of the controls throughout the study.
The association between a disease and haplotype was tested in recent case–control studies (Fallinet al.2001;
Hodgkinson et al.2004). In these studies, haplotype
frequencies were estimated separately in cases and controls followed by a test of their differences between
Figure 1.—Schematic of the simula-tion (where the equasimula-tion q1 ¼ q ¼ 0.2 was assumed for the null hypothesis).
TABLE 1
Haplotype frequencies forSAAgenes (MORIGUCHIet al.2001)
andART
SAA ART
Haplotype Frequency Haplotype Frequency
ACTGCC 0.394 212122 0.1672
ACCGTCa 0.214 221122a 0.1428
AGCGCT 0.210 121122 0.1281
GCCGTC 0.036 221111 0.1164
GCTGCT 0.035 121111 0.1018
GGCACT 0.023 212111 0.0864
ACTGCT 0.023 221211 0.0766
AGCACT 0.018 221222 0.0759
GGCGCT 0.017 211122 0.0319
ACTGTC 0.013 211111 0.0314
ACCGCC 0.006 212222 0.0250
ACCATC 0.006 212211 0.0165
AGCGCC 0.003
a
cases and controls. The PENHAPLO algorithm also estimates the haplotype frequencies; however, it simul-taneously tests the association between disease and diplotype configurations. We compared the results obtained by the analysis using PENHAPLO with those obtained by the analysis using the following methods:
Method 1 (haplotype frequency comparison method): In the first step, LDSUPPORT (Kitamuraet al.2002)—a
software that estimates the haplotype frequencies using the EM algorithm—was used to separately estimate haplotype frequenciesQfor cases and controls. Then, the differences in the frequencies of the specific haplotypeH1 between cases and controls were tested
using 232 contingency tables.
Method 2 (diplotype frequency comparison method):First, haplotype frequencies for cases and controls were esti-mated separately using LDSUPPORT. Then, the fre-quency of each diplotype configuration was calculated
separately for cases and controls, as a product of the frequencies of two haplotypes. The frequencies of diplo-type configurations were summed up separately for members and nonmembers of D1. Then, the
frequen-cies of diplotype configurations categorized as members ofD1were compared between cases and controls.
Method 3 (subject partition method): In the first step, haplotype frequencies were estimated by LDSUPPORT using pooled data of cases and controls. Then, posterior probabilities of diplotype configurations for each sub-ject were calculated by considering the products of the estimated relative frequencies of two haplotypes con-stituting possible diplotype configurations for each subject as priors. The expected numbers of diplotype configurations in both cases and controls were calcu-lated by summing them for the members and non-members of D1 separately. Then, the frequencies of
diplotype configurations categorized as members ofD1
were compared between the cases and controls. Note that, in this method, a subject may be partitioned into two proportions—that of a member and that of a nonmember ofD1.
Simulation 2: detecting the association:In simulation
1, the risk haplotype and mode of inheritance were assumed to be known. Next, to simulate a more real association study, the data were simulated as follows and analyzed using PENHAPLO under the assumption that the risk haplotype and mode of inheritance were unknown:
1. A common disease: One of the major haplotypes was assumed to be a disease-related haplotype. The risk was additive. The relative risk of a subject with two disease-related haplotypes compared to subjects with no disease-related haplotypes was assumed to be 1.5 or 2.
2. Disease caused by a single mutation: One of the minor haplotypes was assumed to be a disease-related haplotype. The mode of inheritance was dominant. The relative risk was assumed to be 2 or 4; i.e., the corresponding odds ratios were 2.25 and 3.9, respectively.
In both cases, the penetrancesqandq0for the
diplo-type without the risk haplodiplo-type were fixed at 0.1. The haplotype frequenciesQofSAAgenes shown in Table 1 were used. For the simulation of a common disease, the risk haplotype was assumed to be ‘‘ACCGTC,’’ while ‘‘GCTGCT’’ was assumed to be the risk haplotype for the other simulation.
Since neither the risk haplotype nor the mode of inheritance was kept blinded in the analysis of the simulated data all possible combinations of the in-complete haplotypes and three modes of inheritance were tested using PENHAPLO, followed by a compari-son of the P-values with the significance level per test evaluated by the permutation test. It was decided that an association was detected when at least oneP-value was
less than the significance level per test. Type I error rates under the null hypothesis and the power under an alternative hypothesis were calculated.
The results of PENHAPLO were compared with an alternative nonparametric method (method 4). For case–control studies, haplotype frequencies between cases and controls are often compared using a likeli-hood-ratio statistic. In our study, log-likelihoods for cases, controls, and combined data of cases and con-trols—ln(Lcases), ln(Lcontrols), and ln(Lcases1controls),
re-spectively—were maximized using LDSUPPORT. Then, the likelihood-ratio (LR) statistics were calculated as LR ¼ 2{ln(Lcases) 1 ln(Lcontrols) ln(Lcases1controls)}.
The statistic approximately follows a x2-distribution,
except in the case where there are many minor hap-lotypes in the data. Therefore, we evaluated the critical point of LR under the null hypothesis for each simula-tion with a varying sample size so that the type I error rate equals 0.05. The empirical power was calculated as the proportion of the attempts that yielded values of the test statistic that are greater than the values over the critical point. The powers obtained were compared with the results using PENHAPLO.
Three sample sizes—400, 1000, and 2000 (half of the samples were the cases)—were simulated. The family-wise significance levelawas set at 0.05. The simulations were repeated 2000 times for both the null and the alternative hypotheses. The permutation tests for an evaluation of significance level per test were performed 1000 times for each simulation.
Analysis of real data: We applied PENHAPLO to
analyze the real data from patients with rheumatoid arthritis (RA) with amyloidosis and non-RA healthy subjects (Moriguchi et al. 2001). Since the cases
(amyloidosis) and controls (non-RA) were selected separately, the study design is considered to be a case– control study. In the previous study (Moriguchiet al.
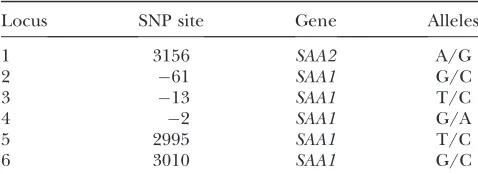
2001), five SNPs of theSAA1gene were obtained for 44 RA patients with amyloidosis (cases) and for 58 non-RA subjects (controls). Although one SNP in theSAA2gene was obtained in the previous study, we did not use it since the locus was not in linkage disequilibrium with the other loci.
RESULTS
Simulation 1: type I errors under the null hypothesis:
Figure 3 shows the empirical type I error rates (the proportions of attempts with a test statistic that had fallen in the critical region) when the data simulated under the null hypothesis were analyzed by various methods at a fixed significance level ofa¼0.05. The results obtained by the analysis using PENHAPLO were compared with those obtained by the analysis using 23
2 tables based on the known-phase data. The results were also compared with those obtained by the other three methods using the contingency tables based on
the unknown-phase data. The type I error rates were calculated as the proportions of the attempts that yielded the values of the test statistic—that is, 2 log(generalized likelihood ratio) for PENHAPLO and
x2-values for the other methods—that were.3.841 (the
value that yields a cumulative distribution function of 0.95 for thex2-distribution with 1 d.f.). When the same
simulated samples were analyzed, the empirical type I error rates obtained using PENHAPLO were consistent with those obtained using the known-phase data. However, the empirical type I error rates obtained using methods 1 and 2 were higher than those obtained using the known-phase data. Therefore, these methods un-derestimate type I error rates. A real type I error rate of 0.05 was obtained when the critical points were set at values.3.841. The values of the critical points depend on the number of samples and the haplotype frequency in the population. For example, the critical values for
SAAdata with 200 samples of each case and control were 4.005 and 4.036 for methods 1 and 2, respectively.
In contrast, the empirical type I error rates obtained using method 3 were lower than those obtained using the known-phase data, which suggests that method 3
tends to overestimate the type I error rates (Figure 3). A real type I error rate of 0.05 was obtained when the critical points were set at values,3.841. In this case as well, the values of the critical points depend on the number of samples and the haplotype frequency in the population. When the data from SAA genes were analyzed, the ranges of the statistical errors (1s) for the type I error rates included the expected significance level of 0.05 for both PENHAPLO and the known-phase data; however, it was not included for the other three methods (Figure 3).
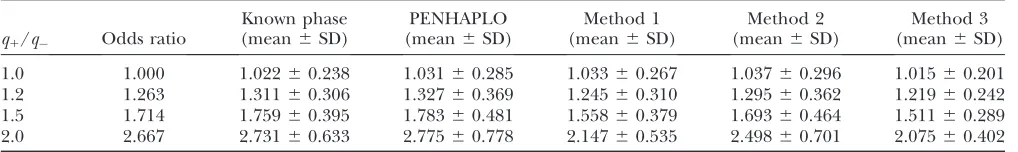
Simulation 1: odds ratio:We then performed
equiv-alent simulations under the alternative hypotheses. Simulations were performed at a fixed value of q ¼
0.2, whereas q1/q was varied from 1.0 to 2.0. The
number of both cases and controls was fixed at 200. Tables 2 and 3 show the means and standard deviations of the estimated odds ratios for theSAAandARTdata, respectively. For both SAA gene and ART data, the discrepancies between the means of the estimated odds ratio calculated using PENHAPLO and those calculated using the known-phase data were ,2%. The discrep-ancies between the true values and the means estimated using the known-phase data decreased with increasing sample size. Method 1 underestimated the odds ratios: the means of the estimated odds were significantly lower than those calculated using known-phase data (Tables 2 and 3). The discrepancies were.30% at the maximum. The maximum discrepancies occurred at a maximum odds ratio of 2.7. The discrepancies between the means estimated using either method 2 or method 3 and those calculated using the known-phase data were within 5% for SAA data (Table 2). The discrepancies increased with increasing odds ratio. For ART data,
method 3 underestimated the odds ratios by .30% (when the means were compared) at the maximum odds ratio (Table 3).
Simulation 2: power calculation:The powers and type
I error rates are shown in Table 4.
The familywise type I error rates estimated using PENHAPLO were almost equal to the significance level
a ¼ 0.05. Although 270 tests (90 incomplete haplotypes times and three modes of inheritance) were performed in each simulation analyzed using PENHA-PLO, it was shown that the familywise type I error rates did not inflate when theP-values per test were compared with the significance levels per test evaluated by the permutation test.
For the alternative hypothesis, the powers analyzed using PENHAPLO were 1.1–1.3 times higher than those analyzed using method 4, which was based on the comparison of haplotype frequencies.
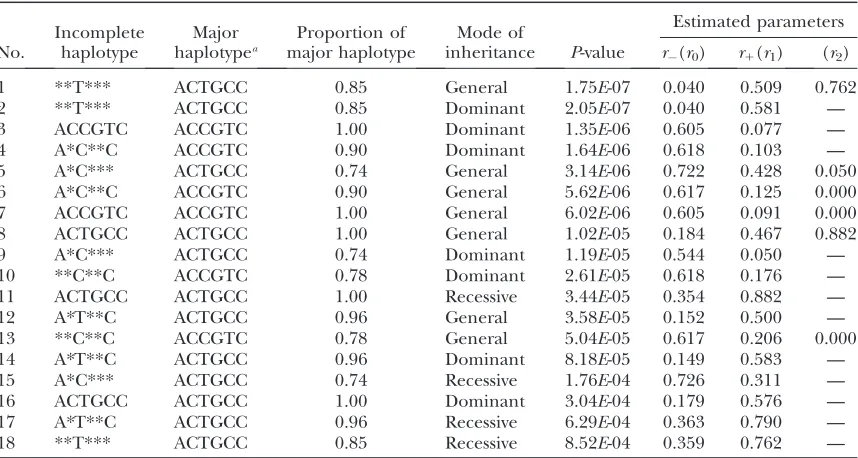
Analysis of real data:Finally, we applied PENHAPLO
to the real data for the case–control study of amyloidosis (Moriguchiet al.2001). The details of the five SNPs in
theSAA1gene are shown in Table 5. All the incomplete haplotypes constructed by three htSNPs (loci 3, 4, and 6) were tested for the association in dominant, recessive, and general modes. Table 6 shows the results whose
P-values were smaller than the significance level per test of 3.103103. The results did not change significantly
even when additional data were included after our previous publication (Moriguchiet al.2001).
The incomplete haplotype showing the strongest association with AA amyloidosis was *T*** in the general relative risk model. This incomplete haplotype actually denotes a SNP at 13T/C of the SAA1gene. The result suggested that13T was a risk factor for the
TABLE 2
The results of simultaion 1: estimated mean and standard errors of the odds ratios forSAA
q1/q Odds ratio
Known phase (mean6SD)
PENHAPLO (mean6SD)
Method 1 (mean6SD)
Method 2 (mean6SD)
Method 3 (mean6SD)
1.0 1.000 1.01560.213 1.01760.218 1.01160.182 1.01760.219 1.01560.208 1.2 1.263 1.28760.268 1.29160.275 1.21360.215 1.28760.274 1.27560.259 1.5 1.714 1.76460.366 1.77160.378 1.53160.266 1.75860.376 1.72460.350 2.0 2.667 2.71860.570 2.73460.592 2.08460.363 2.69160.580 2.60260.532
The sample sizes of both the cases and the controls were 200. The penetranceq–was fixed at 0.2.
TABLE 3
The results of simulation 1: estimated mean and standard errors of the odds ratios forART
q1/q Odds ratio
Known phase (mean6SD)
PENHAPLO (mean6SD)
Method 1 (mean6SD)
Method 2 (mean6SD)
Method 3 (mean6SD)
1.0 1.000 1.02260.238 1.03160.285 1.03360.267 1.03760.296 1.01560.201 1.2 1.263 1.31160.306 1.32760.369 1.24560.310 1.29560.362 1.21960.242 1.5 1.714 1.75960.395 1.78360.481 1.55860.379 1.69360.464 1.51160.289 2.0 2.667 2.73160.633 2.77560.778 2.14760.535 2.49860.701 2.07560.402
development of AA amyloidosis. The results are consis-tent with previous works by Moriguchiet al.(2001) and
Yamadaet al.(2003).
Among 39 tests, 8 were significant for the association between AA amyloidosis and the haplotypes. The significant results were divided into two groups. One consisted of the incomplete haplotypes whose major complete haplotype was CTGCC, and the other con-sisted of those having CCGTC at the highest frequency. The number of members in both groups was four. A careful inspection of the results showed that the group CTGCC serves as a risk, while the group CCGTC serves as an inhibitory factor in the development of AA amyloidosis.
The haplotype CTGCC was the most frequent haplo-type observed in the controls, followed by CCGTC, which was the second most frequent haplotype. When more than one major haplotype with contrary effects are detected in a case–control study, the results should be
interpreted with caution. In a case–control study, an increase in a disease-related haplotype causes a decrease in the relative frequencies of other haplotypes, in cases. If a minor haplotype is related to the disease and the penetrance is low, then an increase in the risk haplotype in cases does not significantly change the relative frequencies of the major haplotypes. However, if a major haplotype is associated with a risk, the effect may not be so small. As a result, either an increase in a risk haplotype or a decrease in the other major haplotypes (or both) might be detected if the power is sufficiently large. A comparison of the relative frequen-cies of three major haplotypes ($10% in controls) between cases and controls revealed that the relative frequency of CTGCC was higher in the cases than in the controls, while CCGTC was observed less frequently in the cases than in the controls. On the other hand, the relative frequency of GCGCT in the controls (third highest) was almost the same between the cases and controls. These results may suggest that the decrease of CCGTC in the cases was caused by the increase of CTGCC. However, a possibility remains that the effect of the haplotype CCGTC is independent of the effect of13T.
DISCUSSION
Earlier, we developed an algorithm, for implementa-tion in PENHAPLO, for testing the associaimplementa-tion between phenotypes and haplotypes using genotype and pheno-type data from either cohort studies or clinical trials.
TABLE 4
Powers and type I error rates for simulation 2
Disease-related haplotype
No. of
casesa Analysis
Relative riskb
1.0 1.5 2.0 3.0
Nonec 200 PENHAPLO 0.052
500 PENHAPLO 0.058
1000 PENHAPLO 0.058
Major 200 PENHAPLO — 0.122 0.379 —
Method 4 — 0.113 0.298 —
500 PENHAPLO — 0.292 0.836 —
Method 4 — 0.230 0.734 —
1000 PENHAPLO — 0.562 0.994 —
Method 4 — 0.467 0.981 —
Minor 200 PENHAPLO — — 0.246 0.828
Method 4 — — 0.212 0.712
500 PENHAPLO — — 0.702 0.999
Method 4 — — 0.580 0.995
1000 PENHAPLO — — 0.976 1.000
Method 4 — — 0.915 1.000
aThe number of controls was the same as the number of cases. b
The relative risk was defined as the ratio of the penetrance with two disease-related haplotypes to that with-out any disease-related haplotype. When the simulations of disease-related haplotype were major, the additive risk model was assumed; when they were minor, the dominant model was assumed. The odds ratios for the dominant model corresponded to 2.25 and 3.9.
c
The null hypothesis.
TABLE 5
SNP sites ofSAA1andSAA2
Locus SNP site Gene Alleles
1 3156 SAA2 A/G
2 61 SAA1 G/C
3 13 SAA1 T/C
4 2 SAA1 G/A
5 2995 SAA1 T/C
The algorithm simultaneously estimates penetrances on the basis of diplotype configurations and haplotype frequencies and tests the association between haplo-types and phenohaplo-types. Since the penetrances can be estimated using data from cohort studies and clinical trials, PENHAPLO can be applied to such studies with-out major problems. In our study, we investigated the val-idity of the application of the algorithm implemented in PENHAPLO to case–control studies by simulations as well as by real data.
It was found that PENHAPLO is useful not only for the analysis of the data from cohort studies and clinical trials but also for the analysis of data from case–control studies with regard to the association test between haplotypes and qualitative phenotypes. However, when applying PENHAPLO to case–control studies, some estimated parameters are different from those esti-mated by the same algorithm when the data from either cohort studies or clinical trials are used. In the case of data from case–control studies, the parametersr1 and r, which are equivalent to the penetrancesq1andqfor
cohort studies and clinical trials, are sensitive to selection bias. The odds ratios (the ratios of the pro-portion of the number of subjects with D1 to the
number of subjects with D in cases to the same
proportion in controls) are expressed as a function of
r1andr. In addition, if the affection rate is known, the
penetrances are expressed as a function of the affection rate,r1andr.
Simulation studies have shown that PENHAPLO is a robust method for the analysis of case–control studies.
Type I error rates were almost exactly as expected when data were generated under the null hypothesis. The means of the odds ratios estimated using PENHAPLO for the simulation converged to the true value in the population as the number of cases and controls in-creased. We compared the results obtained using PENHAPLO with those obtained using known-phase data. The type I error rate and the means of the odds ratios obtained using PENHAPLO were comparable to those analyzed using known-phase data.
Our results have shown that the odds ratios can be estimated from the combined case and control data by applying the method for the estimation of penetrances from the cohort data. The use of haplotypes inferred separately in cases and controls or inferred using combined data underestimates the odds ratio. These discrepancies increased with the decreasing strength of linkage disequilibrium and with increasing odds ratios. When an association test was performed using these alternative methods, the type I error rate under the null hypothesis did not correspond with the significance level.
Simulation studies have also shown that the power of PENHAPLO was higher than that of the alternative method.
The results of the analysis of the data from the case– control sample of patients with RA and healthy subjects were of interest. They support the previously proposed hypotheses for the association of SAA genes with AA amyloidosis. Babaet al.(1995) proposed that two
mis-sense base substitutions are related to AA amyloidosis;
TABLE 6
The incomplete haplotypes and modes of inheritance that were significant in tests for association with amyloidosis
No.
Incomplete haplotype
Major haplotypea
Proportion of major haplotype
Mode of
inheritance P-value
Estimated parameters
r(r0) r1(r1) (r2)
1 **T*** ACTGCC 0.85 General 1.75E-07 0.040 0.509 0.762
2 **T*** ACTGCC 0.85 Dominant 2.05E-07 0.040 0.581 —
3 ACCGTC ACCGTC 1.00 Dominant 1.35E-06 0.605 0.077 —
4 A*C**C ACCGTC 0.90 Dominant 1.64E-06 0.618 0.103 —
5 A*C*** ACTGCC 0.74 General 3.14E-06 0.722 0.428 0.050
6 A*C**C ACCGTC 0.90 General 5.62E-06 0.617 0.125 0.000
7 ACCGTC ACCGTC 1.00 General 6.02E-06 0.605 0.091 0.000
8 ACTGCC ACTGCC 1.00 General 1.02E-05 0.184 0.467 0.882
9 A*C*** ACTGCC 0.74 Dominant 1.19E-05 0.544 0.050 —
10 **C**C ACCGTC 0.78 Dominant 2.61E-05 0.618 0.176 —
11 ACTGCC ACTGCC 1.00 Recessive 3.44E-05 0.354 0.882 —
12 A*T**C ACTGCC 0.96 General 3.58E-05 0.152 0.500 —
13 **C**C ACCGTC 0.78 General 5.04E-05 0.617 0.206 0.000
14 A*T**C ACTGCC 0.96 Dominant 8.18E-05 0.149 0.583 —
15 A*C*** ACTGCC 0.74 Recessive 1.76E-04 0.726 0.311 —
16 ACTGCC ACTGCC 1.00 Dominant 3.04E-04 0.179 0.576 —
17 A*T**C ACTGCC 0.96 Recessive 6.29E-04 0.363 0.790 —
18 **T*** ACTGCC 0.85 Recessive 8.52E-04 0.359 0.762 —
a
however, Moriguchi et al. (2001) and Yamadaet al.
(2003) proposed that13T/C substitutions in the 59 -flanking sequence are responsible. The results of the analysis by PENHAPLO using the concept of incomplete haplotypes suggest that both the hypotheses might hold. In conclusion, the likelihood-based algorithm PEN-HAPLO can be applied not only to cohort studies and clinical trials but also to case–control studies for testing the association between haplotypes and phenotypes. However, the parameters estimated as penetrances in cohort studies are not the true penetrances in case– control studies. Rather, an odds ratio is obtained from these parameters, and the penetrances can be calcu-lated if the affection rate is available. Although the haplotypes are not in HWE in both cases and controls, the results showed that the effect of departure from HWE did not significantly affect the results, particularly when the loci were in tight linkage disequilibrium.
This work was supported by grants from the New Energy and Industrial Technology Development Organization.
LITERATURE CITED
Baba, S., S. A. Masago, T. Takahashi, T. Kasama, H. Sugimuraet al.,
1995 A novel allelic variant of serum amyloid a, saa1 gamma: genomic evidence, evolution, frequency, and implication as a risk factor for reactive systemic aa-amyloidosis. Hum. Mol. Genet.4: 1083–1087.
Epstein, M. P., and G. A. Satten, 2003 Inference on haplotype
ef-fects in case-control studies using unphased genotype data. Am. J. Hum. Genet.73:1316–1329.
Fallin, D., A. Cohen, L. Essioux, I. Chumakov, M. Blumenfeld et al., 2001 Genetic analysis of case/control data using esti-mated haplotype frequencies: application to apoe locus variation and Alzheimer’s disease. Genome Res.11:143–151.
Hodgkinson, C. A., D. Goldman, J. Jaeger, S. Persaud, J. M. Kane et al., 2004 Disrupted in schizophrenia 1 (disc1): association with schizophrenia, schizoaffective disorder, and bipolar disor-der. Am. J. Hum. Genet.75:862–872.
Horikawa, Y., N. Oda, N. J. Cox, X. Li, M. Orho-Melanderet al.,
2000 Genetic variation in the gene encoding calpain-10 is asso-ciated with type 2 diabetes mellitus. Nat. Genet.26:163–175. Ito, T., E. Inoueand N. Kamatani, 2004 Association test algorithm
between individual phenotype and a haplotype using simulta-neous estimation of haplotype frequencies, diplotype configura-tions and diplotype-based penetrances. Genetics168:2339–2348. Kamatani, N., A. Sekine, T. Kitamoto, A. Iida, S. Saito et al.,
2004 Large-scale single-nucleotide polymorphism (snp) and haplotype analyses, using dense snp maps, of 199 drug-related genes in 752 subjects: the analysis of the association between un-common snps within haplotype blocks and the haplotypes con-structed with haplotype-tagging snps. Am. J. Hum. Genet.75: 190–203.
Kawaguchi, Y., A. Tochimoto, N. Ichikawa, M. Harigai, M. Hara et al., 2003 Association of il1a gene polymorphisms with suscep-tibility to and severity of systemic sclerosis in the Japanese popu-lation. Arthritis Rheum.48:186–192.
Kitamura, Y., M. Moriguchi, H. Kaneko, H. Morisaki, T. Morisaki et al., 2002 Determination of probability distribution of diplo-type configuration (diplodiplo-type distribution) for each subject from genotypic data using the em algorithm. Ann. Hum. Genet.66: 183–193.
Moriguchi, M., C. Terai, H. Kaneko, Y. Koseki, H. Kajiyamaet al.,
2001 A novel single-nucleotide polymorphism at the 59 -flank-ing region ofSAA1associated with risk of type aa amyloidosis sec-ondary to rheumatoid arthritis. Arthritis Rheum.44:1266–1272.
Niu, T., Z. S. Qin, X. Xuand J. Liu, 2002 Bayesian haplotype
infer-ence for multiple linked single-nucleotide polymorphisms. Am. J. Hum. Genet.70:157–169.
Qin, Z., T. Niu and J. Liu, 2002
Partition-ligation-expectation-maximization algorithm for haplotype inference with single-nucleotide polymorphisms. Am. J. Hum. Genet.71:1242–1247. Schaid, D. J., C. M. Rowland, D. E. Tines, R. M. Jacobsonand G. A.
Poland, 2002 Score tests for association between traits and
hap-lotypes when linkage phase is ambiguous. Am. J. Hum. Genet.70: 425–434.
Stephens, M., and P. Donnelly, 2003 A comparison of Bayesian
methods for haplotype reconstruction from population genotype data. Am. J. Hum. Genet.73:1162–1169.
Stephens, M., N. Smithand P. Donnelly, 2001 A new statistical
method for haplotype reconstruction from population data. Am. J. Hum. Genet.68:978–989.
Stram, D. O., C. Leigh Pearce, P. Bretsky, M. Freedman, J. N.
Hirschhornet al., 2003 Modeling and e-m estimation of
hap-lotype-specific relative risks from genotype data for a case-control study of unrelated individuals. Hum. Hered.55:179–190. Sugiura, T., Y. Kawaguchi, M. Harigai, H. Terajima-Ichida, Y.
Kitamura et al., 2002 Association between adult-onset Still’s
disease and interleukin-18 gene polymorphisms. Genes Immun. 3:394–399.
Tanaka, E., A. Taniguchi, W. Urano, H. Nakajima, Y. Matsudaet al.,
2002 Adverse effects of sulfasalazine in patients with rheuma-toid arthritis are associated with diplotype configuration at the n-acetyltransferase 2 gene. J. Rheumatol.29:2492–2499. Urano, W., A. Taniguchi, H. Yamanaka, E. Tanaka, H. Nakajima
et al., 2002 Polymorphisms in the methylenetetrahydrofolate re-ductase gene were associated with both the efficacy and the tox-icity of methotrexate used for the treatment of rheumatoid arthritis, as evidenced by single locus and haplotype analyses. Pharmacogenetics12:183–190.
Westfall, P. H., and S. S. Young, 1993 Resampling-Based Multiple Testing: Examples and Methods for P-Value Adjustment(Wiley Series in Probability and Statistics). John Wiley & Sons, New York. Yamada, T., Y. Okuda, K. Takasugi, L. Wang, D. Marks et al.,
2003 An allele of serum amyloid a1 associated with amyloidosis in both Japanese and Caucasians. Amyloid10:7–11.
Zaykin, D. V., P. H. Westfall, S. S. Young, M. A. Karnoub, M. J.
Wagneret al., 2002 Testing association of statistically inferred
haplotypes with discrete and continuous traits in samples of un-related individuals. Hum. Hered.53:79–91.
Communicating editor: Y.-X. Fu
APPENDIX: PARAMETERS ESTIMATED IN A CASE–CONTROL STUDY
In a cohort study, the probabilities of a subject developing a disease when the diplotype configuration is or is not a member ofD1are shown in Table A1. Using
the haplotype frequencies Q in the population, the relative frequencyfDjof thejth diplotype configuration Djin the population is expressed, assuming the HWE as
fDj ¼ulum;
whereulandumare relative frequencies of thelth and mth haplotypes, respectively, that constitute Dj. A dip-lotype configurationDjwithj¼1,. . .,kis a member of
D1, while Djwithj¼k1 1,. . .,L2is a nonmember of D1. The prevalence of disease l is calculated using
the penetrancesq1,q, andfDk as
l¼q1
Xk
j¼1
fDj1q XL2
j¼k11
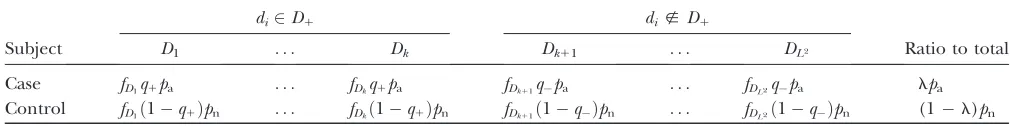
In a case–control study, suppose that cases and controls are sampled from affected and not-affected subjects in the population with the sample rates pa and pn,
re-spectively. The probabilities of observing a case or a control with a diplotype configurationDkin all samples of cases and controls are expressed in Table A2. The ratios of the number of cases to the total number of subjects in a case–control study is expressed as
s¼ lpa
lpa1ð1lÞpn
: ðA2Þ
Thus, the following equation is obtained:
pa
pn
¼sð1lÞ
lð1sÞ: ðA3Þ
The ratio s is also obtained as the summation of the probabilities of the observed cases over all the possible diplotype configurations:
s¼X
k
j¼1
fDjq1pa1 XL2
j¼k11
fDjqpa: ðA4Þ
Correspondingly, the ratio of the number of controls to the total number of subjects, 1s, is obtained as the summation of the probabilities of the observed controls across all the possible diplotype configurations as follows:
ð1sÞ ¼X
k
j¼1
fDjð1q1Þpn1 XL2
j¼k11
fDjð1qÞpn: ðA5Þ
In a case–control study,sis known; however,paandpn
are unknown. r1 and rare defined as the selection
biases that express the difference in the relative fre-quencies of cases and controls with the diplotype con-figurationDk2D1andDk;D1, respectively, as
r1
1r1
¼
Pk
j¼1fDjq1pa Pk
j¼1fDjð1q1Þpn
; ðA6Þ
r
1r¼ PL2
j¼k11fDjqpa PL2
j¼k11fDjð1qÞpn
: ðA7Þ
Substituting (A3) for (A6) yields
r1¼
1
ðð1q1Þ=q1Þðð1sÞ=sÞðl=ð1lÞÞ11
: ðA8Þ
Instead of q1, r1 is estimated when PENHAPLO is
applied to analyze the data from a case–control study. Therefore, if the prevalence l is known and r1 is
estimated using PENHAPLO, the penetrance q1 is
obtained as follows:
q1¼
1
ðs=ð1sÞÞðð1r1Þ=r1Þðð1lÞ=lÞ11
: ðA9Þ
In the same manner,qis obtained as
q¼ 1
ðs=ð1sÞÞðð1rÞ=rÞðð1lÞ=lÞ11
: ðA10Þ
The odds ratio is expressed as
OR¼
Pk
j¼1fDjq1pa Pk
j¼1fDjð1q1Þpn
, PL2
j¼k11fDjqpa PL2
j¼k11fDjð1qÞpn
: TABLE A1
Proportions of the subjects categorized by the affection status and diplotype configurations
di2D1 di;D1
Subject D1 . . . Dk Dk11 . . . DL2 Prevalence
Affected fD1q1 . . . fDkq1 fDk11q . . . fDL2q l
Not affected fD1ð1q1Þ . . . fDkð1q1Þ fDk11ð1qÞ . . . fDL2ð1qÞ 1l
Total fD1 . . . fDk fDk11 . . . fDL2
PL2 k fDk ¼1
fDk denotes the relative frequency of diplotype configurationDkin the population, andLdenotes the number of haplotypes.
TABLE A2
Proportion of the subjects with different diplotype configurations in cases and controls among the combined case and control sample
di2D1 di;D1
Subject D1 . . . Dk Dk11 . . . DL2 Ratio to total
Substituting (A6) and (A7) in the above equation yields
OR¼ r1
1r1
1r r
: ðA11Þ
The likelihood-ratio test used in PENHAPLO is based on the following null and alternative hypotheses for a cohort study:
H0: q1¼q H1: q16¼q:
When PENHAPLO is used to analyze a case–control study, the null and alternative hypotheses are H0:r1¼s
and H1:r16¼sthat correspond to
H0: OR¼1
H1: OR6¼1: