ISSN (Online): 2319-8753 ISSN (Print) : 2347-6710
I
nternational
J
ournal of
I
nnovative
R
esearch in
S
cience,
E
ngineering and
T
echnology
(A High Impact Factor, Monthly, Peer Reviewed Journal)
Visit: www.ijirset.com
Vol. 7, Issue 1, January 2018
Fiber based Spectrometer; Design Study &
Comparison with a Grating based
Spectrometer
Dr.Shehab A.Kadhim1, Dr.Abdulkareem H.Dagher2, Gufran Z. Kalaf3, Nibras K.Juber4
Scientific Researcher, Ministry of Science & Technology, Baghdad, Iraq1,4
Department of Physics, College of Education, the University of Mustansiriyah, Baghdad, Iraq2,3
ABSTRACT: This paper presents the design study, operational principle and mathematical model of a fiber optic based spectrometer (FOS). Such a spectrometer is highly desired by the ever-increasing applications of fiber optic sensors in compared to a grating based spectrometer, where high response frequency is required while advantages of high accuracy and large dynamic range must be maintained. The white light interferometry could provide a solution for high accuracy and large dynamic range measurement without ambiguity because of its absolute measurement nature. However the signal demodulation speed is limited due to the low spectrum acquisition rate of the existing spectrometers.
The new (FOS) utilizes time domain dispersion of the sampled incoming light by dispersive fiber rather than the spatial dispersion employed by traditional spectrometers. In additionthe signal that represents the spectrum of the light is naturally a serial signal which can bedetected by a single detector and recorded by a high speed data acquisition device. Theoreticalstudy of the operation principle is made and a mathematical model for the spectrometeris developed based on beam mode profiletechnique.
KEYWORDS: Fiber optic based spectrometer (FOS), grating based spectrometer,CCD camera, Resolution.
I. INTRODUCTION
Spectrometers are widely used tools in chemical and biological sensing, material analysis, and light source characterization. Traditional spectrometers use a grating to disperse light, and the spectral resolution scales with the optical pathlength from the grating to the detectors, imposing a trade-off between device size and resolution. In recent years the development of “miniature“spectrometers has enabled a host of new applications due to their reduced cost and portability. However, they still rely on grating dispersion, thus the spectral resolution is lower than the large bench-top spectrometers. In order to develop a compact spectrometer without sacrificing resolution, a multimode fiber turned, where a long pathlength is easily achieved in a small footprint by coiling the fiber [1].
II. GRATING BASED SPECTROMETERS
ISSN (Online): 2319-8753 ISSN (Print) : 2347-6710
I
nternational
J
ournal of
I
nnovative
R
esearch in
S
cience,
E
ngineering and
T
echnology
(A High Impact Factor, Monthly, Peer Reviewed Journal)
Visit: www.ijirset.com
Vol. 7, Issue 1, January 2018
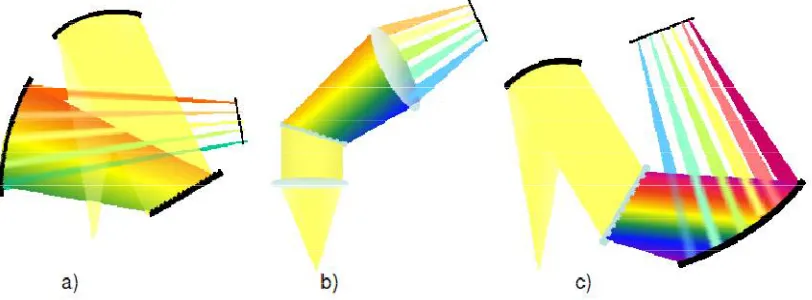
focus different wavelengths of the spectrum onto different pixels on the detector array).Both the Crossed Czerny-Turner (CCT) and the Transmission Grating based Spectrometer (TGS) include these three elements. For the TGS, we will consider two basic designs which have slightly different characteristics – the Lens-Grating-Lens (LGL) using two lenses and a grating, and the Mirror-Grating-Mirror (MGM) using two mirrors and a grating. Figure (1) shows the CCT, the LGL, and the MGM spectrometer lay-outs and schematic beam [2].
Figure (1): Spectrometer configurations: a) Crossed Czerny-Turner, b) Lens- Grating-Lens, c) Mirror-Grating-Mirror.
A spectrometer can in general not be optimized for all parameters, so it is important to compare only spectrometers that are designed for the same application.
2.1. Comparison of spectrometer configurations
A rough comparison of the characteristics in terms of resolution, throughput, and detector flexibility for the three spectrometer platforms provides in Table (1). As can be seen, all three platforms provide the same resolution relative to the wavelength range to be covered [3]. This is a consequence of the fact that the sizes of the beams relative to the optical components are roughly the same in all compact spectrometers and therefore the aberrations (determining the minimum resolution) are also roughly the same.
ISSN (Online): 2319-8753 ISSN (Print) : 2347-6710
I
nternational
J
ournal of
I
nnovative
R
esearch in
S
cience,
E
ngineering and
T
echnology
(A High Impact Factor, Monthly, Peer Reviewed Journal)
Visit: www.ijirset.com
Vol. 7, Issue 1, January 2018
choice of spectrometer platform really has to be done based on technical requirements, so the optimum choice for your next spectroscopy platform might very well be a transmission grating based one.
III. FIBER OPTIC BASED SPECTROMETERS
The fiber-based spectrometer consists of a multimode fiber and a monochrome CCD camera that images the speckle pattern at the end of the fiber. The speckle pattern, created by interference among the guided modes in the fiber, is distinct for light at different wavelength, thus providing a fingerprint of the input wavelength. In this paper, a conventional multimode fiber can act as the dispersion element, enabling spectrometer operation using only a fiber and a camera. Interference enabling spectrometer operation using only a fiber and a camera.A multimode optical fiber is found as an ideal dispersive element for this type of spectrometer because the long propagation length and the minimal loss enable high spectral resolution and good sensitivity [4].
In a multimode fiber spectrometer, the interference between the guided modes creates a wavelength-dependent speckle pattern, providing the required spectral-to-spatial mapping. In the past, the contrast of this speckle pattern was found to depend on the spectral width and shape of the optical source [5], allowing researchers to use contrast as a measure of the laser linewidth. As opposed to using only the statistical property of the speckle such as the contrast, we recently proposed and demonstrated that by recording the entire speckle patterns at different wavelengths, a multimode fiber can be used as a general purpose spectrometer [6]. The spectral resolution of the device depends on the spectral correlation width of the speckle, which is known to scale inversely with the length of the fiber [7]. The advantage of using an optical fiber is that a long propagation length is easily achieved with minimal loss, giving high spectral resolution. Furthermore, the fiber-based spectrometer requires only a multimode fiber and a monochrome CCD camera to record the speckle patterns. Compared to traditional spectrometers, optical fibers are lower cost, lighter weight, and can be coiled into a small volume while providing spectral resolution that is competitive with state-of-the-art grating based spectrometers.
IV. MODELING AND DESIGN CONSIDERATION
ISSN (Online): 2319-8753 ISSN (Print) : 2347-6710
I
nternational
J
ournal of
I
nnovative
R
esearch in
S
cience,
E
ngineering and
T
echnology
(A High Impact Factor, Monthly, Peer Reviewed Journal)
Visit: www.ijirset.com
Vol. 7, Issue 1, January 2018
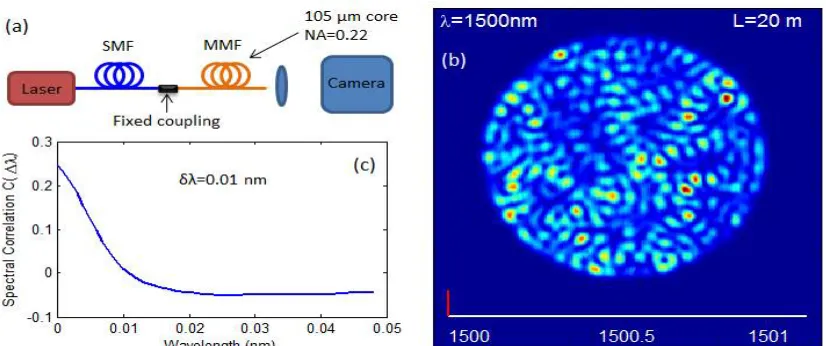
Figure (2): (a) Designed Setup,(b): Speckle pattern for expected results, (c):Spectral correlation function averaged over many spatial positions.
The spectral correlation function of the speckle intensity was calculated, C (Δλ, x) = < ( , ) ( + , ) >⁄[< ( ,x)>< ( + , ) >]−1 …..(1)
Where I(λ,x) is the intensity at a position x for input wavelength λ,<⋯>represents the average over λ.
In Figure (1-c), the spectral correlation function averaged over many spatial positionswas plotted across the 105 μm core of a 20 m fiber. The spectral correlation width, δλis defined as:C (δλ⁄ 2) = C (0)/2. When the input wavelength shifts by δλ , the output speckle
pattern becomes nearly uncorrelated, C(Δλ=δλ)≈0. In this case, δλ = 10 pm [9].
4.1. Advantages
1. Higher spectral resolution: Commercially available optical fiber are designed for long optical path lengths enabling very high spectralresolution (the proof-of-principle demonstration exhibited resolution of 0.03 nm at λ=1500 nm). Higher resolution can be achieved simply by using a longer fiber, allowing a fiber spectrometer to exhibit resolution equivalent to or better than the state of the art.
2. Smaller footprint: In traditional spectrometers , the resolution scales with the optical path length .To achieve resolutions less than 0.1 nm at λ= 1500 nm , path lengths on the order of 100 mm are required and the total spectrometer footprint is typically ~1meter . A 0ptical fiber can be coiled to achieve a similar path length with a much smaller footprint.
3. Lower-cost, lightweight all-fiber instrument: Traditional heavy, expensive spectrometer components and housing can be replaced with a single, low-cost multimode fiber.
4. Minimal insertion less: The fiber spectrometer leverages the extremely low-loss of commercial optical fibers, enabling highly efficient spectrometer operation.
5. No special camera requirements: The simplest realization that can be introduced to the marketplace will be a multimode fiber and a camera operating in the wavelength region of interest.
6. Easily scaled to realize 2D imaging spectrometer for hyper spectral imaging: Appropriate commercially available imaging fiber bundles can be integrated with commercially available cameras for hyper spectral imaging. By using each core as its own spectrometer, a spectrally resolved image can be generated.
ISSN (Online): 2319-8753 ISSN (Print) : 2347-6710
I
nternational
J
ournal of
I
nnovative
R
esearch in
S
cience,
E
ngineering and
T
echnology
(A High Impact Factor, Monthly, Peer Reviewed Journal)
Visit: www.ijirset.com
Vol. 7, Issue 1, January 2018
2. A high resolution, low loss spectrometer can be implemented in a multimode fiber with a 2D-CDD camera. Our approach is applicable to any wavelength range.
3. A low cost spectrometer that can be set up with modest effort and at low cost. It can be employed for general purpose VIS absorption, transmission, reflectance, and light emission and color measurements in several branches of the physical sciences and in chemistry and biology applications. Compared to existing spectrometers with comparable resolution and bandwidth, the multimode fiber spectrometer is compact, lightweight and inexpensive.
REFERENCES
[1]. Brandon Redding, MansoorAlam, Martin Seifer, and Hui Cao, '' High-resolution and broadband all-fiber spectrometers '', Optical Society of America, optica, Vol. 1, (3), pp. 175-180, (2014 ) .
[2]. Christopher, Palmer,'' Diffraction Grating Handbook '', 6th edition, Newport Corporation, (2005).
[3]. Thomas Rasmussen , ''Transmission grating based spectrometer '' , Ibsen Photonics ,Publication Version: 1.1,( 2011) .
[4]. I. Culeac, I. Nistor, M. Iovu, A. Buzdugan, V. Ciornea, and I. Cojocaru, "A Fiber Optic Intrusion Monitoring System", Moldavian Journal of the Physical Sciences, Vol. 12, N3-4, (2013).
[5]. B. Redding, S. M. Popoff, and H. Cao, ''All-fiber spectrometer based on speckle pattern reconstruction'', Opt. Express 21, 6584–6600 (2013). [6] B. Redding, S. M. Popoff, and H. Cao, ''Multimode optical fiber based spectrometers '', Nat. Photonics 7,1 –6 (2013).
[7]. M. Taniguchi, M. Hasegawa, T. Takagi, "An experimental study on the relationships between the speckle noise and the deformation of optical fiber", 41st SICE Annual Conference, IEEE, Vol. 5, pp.2967 - 2971, (2002).
[8]. L. Rodriguez-Cobo, M. Lomer, C. Galindez and J.M. Lopez-Higuera, "POF vibration sensor based on speckle pattern changes", OFS2012 22nd
International Conference on Optical Fiber Sensors, (2012).