ABSTRACT
Cakir, Janet Ferguson. Modeling Trail Degradation Using Field and GIS
Methodologies: A Comparative Study. (Under the direction of Dr. Hugh Devine and Dr. Yu-Fai Leung)
Trail degradation is a problem that park managers continually battle. A relatively recent US General Accounting Office report states a 4 billion dollar maintenance backlog has developed in the National Park System. Given the heavy use of trails, it is likely that a substantive part of this backlog is related to trail degradation. The ability to quickly and accurately predict trail problem locations would greatly enhance the efficiency of both preventing and mitigating these problems. To date, some studies have modeled trail degradation, but these methods rely almost entirely on field-collected data, which is expensive and time consuming to obtain. This study explores the potential of GIS to efficiently populate degradation models of incision and width with landform variables. Issues related to GIS data resolution for use in these models are examined through a stepwise regression procedure. Results suggest that models based on GIS-derived data perform as well or better than models based on field-measured data. These results also suggest that there may be a relationship between trail degradation and landform
coincident with statistically significant clusters of both high and low values of trail degradation.
This work bolsters the argument for the use of GIS derived data in trail degradation models. With these procedures designers and managers can quickly and efficiently use the models to quantify the degradation sensitivity of existing trail sections and alternative new trail designs. In addition, based on the findings in this study,
MODELING TRAIL DEGRADATION USING FIELD AND GIS
METHODOLOGIES: A COMPARATIVE STUDY
by
Janet Ferguson Cakir
A dissertation submitted to the Graduate Faculty of
North Carolina State University
in partial fulfillment of the
requirements for the Degree of
Doctor of Philosophy
Parks, Recreation, and Tourism Management
Raleigh
2005
Approved by
Dr. Roger Moore Dr. Shishir Raval
Dr. Hugh Devine (Co-chair of Advisory Committee)
BIOGRAPHY
Janet was born in Murray, Kentucky in 1970 to Colin and Mary Alice Ferguson. She spent her elementary years in the small town of Clifton Forge, Virginia. Her teen years were spent in Martinsville, Virginia. She graduated with a B.S. from the Geography Department of Radford University under the guidance of Dr. Lori LeMay. She continued her masters studies at Virginia Polytechnic Institute and State University. While at Virginia Tech, She worked closely with Dr. Jeffrey Marion from the Department of Forestry, and Dr. Bill Carstensen from the Department of Geography. After graduating with an M.S., she joined the department of Parks, Recreation, and Tourism Management at North Carolina State University as a doctoral student under Dr. Hugh Devine.
ACKNOWLEDGEMENTS
I would like to thank my husband for his consistent support. He has remained steady through both my long hours at work and my long weekends of dissertation work. I would also like to thank my committee. Each member contributed in a unique way to the
completion of this work. I commend them for their unwavering commitment to the successful completion of my program of study and this dissertation.
I would also like to thank Dr. Bryan Hubbell, and Dr. Terence Fitz-Simmons of the U. S. Environmental Protection Agency (EPA) for their willingness to lend their technical and statistical expertise to me as I struggled to develop methods of analysis for this work. In addition, I would like to thank my immediate supervisor at the EPA, Ron Evans, for showing a genuine interest and desire for me to graduate.
I would like to thank Dr. Lori LeMay of Radford University for her friendship, emotional support, and guidance through this process.
TABLE OF CONTENTS
PAGE LIST OF TABLES... VIII
LIST OF FIGURES...X
1.0 INTRODUCTION AND PROBLEM STATEMENT ... 1
2.0 LITERATURE REVIEW ... 5
2.1FACTORS OF TRAIL DEGRADATION... 6
2.1.1 Use and Biophysical Factors... 6
2.1.1.1 Vegetation... 7
2.1.1.2 Soil ... 9
2.1.2 Landform Related Factors ... 12
2.1.2.1 Grade and Slope ... 12
2.1.2.2 Trail Alignment ... 14
2.1.3 Evaluation of the Literature Related to the Factors of Trail Degradation... 16
2.2 MODELS OF TRAIL DEGRADATION... 17
2.2.1 Multiple Regression Models... 18
2.2.2 Logistic Regression Models ... 20
2.2.3 Evaluation of the Literature Related to Models of Trail Degradation ... 21
2.3 TRAIL DEGRADATION ASSESSMENT METHODS... 22
2.3.1 Sampling Design ... 22
2.3.2 Measurement of Trail Degradation ... 27
2.3.2.1 Incision... 27
2.3.2.2 Width... 28
2.3.3 Evaluation of the Literature Related to Trail Assessment Methods... 29
2.4 GEOGRAPHIC INFORMATION SYSTEMS (GIS) ... 31
2.4.1 GIS and Recreational Hiking Trails ... 32
2.4.1.1 Application to Trail Management ... 32
2.4.1.2 Application to Trail Planning and Design... 34
2.4.1.3 Application to Trail Degradation Models ... 35
2.4.2 Use of GIS in Geomorphic Models of Landform Degradation... 37
2.4.3 Evaluation of the Literature Related to GIS, Trails, and Degradation ... 38
3.0 OBJECTIVES... 39
4.0 METHODS... 40
4.1 STUDY AREA... 40
4.1.1 Location ... 40
4.1.2 Physical and Ecological Characteristics... 42
4.1.3 Use and Management... 43
4.2 FIELD SURVEY METHODS ... 45
4.3 DIGITAL DATA SOURCES... 46
4.4.1 Slope... 48
4.4.2 Roughness (Substitute for Trail Grade)... 49
4.4.3 Aspect ... 52
4.4.4 Trail Alignment Angle... 53
4.4.5 Trail Position ... 54
4.4.6 Curvature (Water Gathering/Spreading)... 54
4.5 OBJECTIVE 1METHODS:COMPARISON OF FIELD AND DEM BASED GIS SURVEYS... 59
4.6 OBJECTIVE 2METHODS: MODELS OF TRAIL DEGRADATION... 59
4.6.1 Models of Incision and Width ... 59
4.6.2 Better Models of Incision and Width... 63
4.7 OBJECTIVE 3METHODS: EXPLORATION OF SPECIFIC TRAIL DEGRADATION PROBLEMS... 64
4.7.1 Examination of Spatial Nature of Trail Problems ... 64
4.7.2 Examination of Relationship Between Trail Problems and Landform Characteristics ... 65
5.0 RESULTS... 67
5.1 FIELD SURVEY RESULTS... 67
5.2 OBJECTIVE 1RESULTS: COMPARISON OF FIELD AND GIS-BASED MEASUREMENTS71 5.3 OBJECTIVE 2RESULTS: MODELS OF TRAIL DEGRADATION... 77
5.3.1 Models of Incision and Width ... 81
5.3.2 Better Models of Incision and Width... 84
5.4 OBJECTIVE 3RESULTS: EXPLORATION OF SPECIFIC TRAIL DEGRADATION PROBLEMS ... 91
5.4.1 Examination of Spatial Nature of Trail Problems ... 91
5.4.2 Examination of Relationship Between Trail Problems and Landform Characteristics ... 94
6.0 DISCUSSION AND IMPLICATIONS... 103
6.1 OBJECTIVE 1DISCUSSION: COMPARISON OF FIELD MEASUREMENTS WITH GIS MEASUREMENTS. ... 104
6.2 OBJECTIVE 2DISCUSSION: MODELS OF TRAIL DEGRADATION... 108
6.2.1 Models of Incision and Width ... 108
6.2.2 Better Models of Incision and Width... 110
6.2.2.1 Relationships of Interest Between Incision and Selected Independent Variables (final models)... 114
6.2.2.2 Relationships of Interest Between Width and Selected Independent Variables (Final models)... 117
6.2.2.3 Limitations of the Final General Degradation Models of Incision and Width ... 119
6.3 OBJECTIVE 3DISCUSSION: EXPLORATION OF SPECIFIC TRAIL DEGRADATION PROBLEMS... 120
6.3.1 Examination of Spatial Nature of Trail Problems ... 120
6.4 STUDY LIMITATIONS... 122
6.4.1 Limitations Affecting Internal Validity ... 122
6.4.2 Limitations Affecting External Validity... 123
6.5 MANAGEMENT IMPLICATIONS... 124
6.5.1 Implications of Objective 1 ... 124
6.5.2 Implications of Objective 2 ... 125
6.5.3 Implications of Objective 3 ... 126
6.6 RESEARCH IMPLICATIONS... 127
6.6.1 GIS Implications ... 127
6.6.2 Degradation Models ... 128
6.6.3 Exploration of Trail Degradation Problems... 130
7.0 CONCLUSIONS... 131
BIBLIOGRAPHY ... 133
APPENDIX A: DETAILED SURVEY PROCEDURES... 142
SYSTEMATIC POINT MEASUREMENT FIELD SURVEY PROCEDURES... 142
PROBLEM ASSESSMENT FIELD SURVEY PROCEDURES... 148
APPENDIX B: JACKKNIFE MACRO ... 151
APPENDIX C: JACKKNIFE PREDICTED AND RESIDUAL VALUES... 152
LIST OF TABLES
Table 1. Recommended grade classes for different trail types. ... 13
Table 2. Risk score and slope categories based on maximum daily rainfall (MDR)... 14
Table 3. Results of models of path width, bare ground width, and incision. ... 18
Table 4. Advantages and disadvantages of different survey designs... 23
Table 5. Summary of sampling procedures. ... 26
Table 6. Summary of Sycamore Trail Problem Assessment Survey performed in 2002 by park management and interns (Bouldin 2004). ... 44
Table 7. Columns housed within the table of combined trail assessments. ... 58
Table 8. General characterization of Sycamore Trail incision and width. ... 70
Table 9. Degree of difference between initial and repeat field measurements (n=9). ... 70
Table 10. Percent trail grade measurement summary by data source. ... 71
Table 11. Percent trail grade Pearson’s product-moment correlation coefficients by data source. ... 71
Table 12. Percent slope of landform measurement summary by data source... 73
Table 13. Percent slope of landform Pearson’s product-moment correlation coefficients by data source... 73
Table 14. Aspect of landform measurement summary by data source. ... 73
Table 15. Aspect of landform Pearson’s product-moment correlation coefficients by data source. ... 73
Table 16. Trail alignment angle measurement summary by data source... 74
Table 17. Trail alignment angle Pearson’s product-moment correlation coefficients by data source. ... 74
Table 18. Number of spreading, collecting, and neither landform measurement summary by data source... 75
Table 19. Collecting landform Pearson’s product-moment correlation coefficients by data source. ... 75
Table 20. Trail position measurements by data source. ... 76
Table 21. Valley Pearson’s product-moment correlation coefficients by data source... 76
Table 22. Ridge Pearson’s product-moment correlation coefficients by data source... 76
Table 23. Midslope Pearson’s product-moment correlation coefficients by data source. ... 76
Table 24. Model of incision based on field data (unstandardized data). ... 81
Table 25. Model of width based on field data (unstandardized data). ... 82
Table 26. Adjusted r2 values for each model by data source. ... 82
Table 27. Summary table for the mean, min, max, and standard deviation of the predicted values and residuals for the incision and width models compared to field measured values. ... 83
Table 28. All possible input variables for r2 stepwise analysis... 85
Table 29. Final model for incision (unstandardized parameter estimates). ... 87
Table 31. Sensitivity analysis of optimal model variables that were not statistically
significant at p <0.05... 88
Table 32. Summary of measured, predicted, and residual values for the final incision and width models. ... 90
Table 33. Comparison of statistically significant landform variable performance from field models with previous study that modeled maximum incision and bare ground width. 108 Table 34. Comparison of statistically significant landform variable performance from final models with previous study that modeled maximum incision and bare ground width. 111 Table 35. Systematic point survey field form. ... 147
Table 36. Problem assessment survey form. ... 150
Table 37. Jackknife predicted values of incision by data source. ... 152
Table 38. Jackknife predicted values for width by data source. ... 156
Table 39. Jackknife residuals for width by data source. ... 158
Table 40. Jackknife predicted and residual values for the optimal model of incision. ... 160
LIST OF FIGURES
Figure 1. Seven-step cycle of recreational impact on soils. Manning (1979)... 10
Figure 2. Delineation of the trail tread boundary can influence measurements of incision and width. ... 30
Figure 3. Location of William B. Umstead State Park and Sycamore Trail (ESRI 1999/2000). ... 41
Figure 4. Sycamore Trail and surrounding topography (topographic source: USGS 2005c). ... 42
Figure 5. Soil types upon which Sycamore Trail is constructed (Wake County 2005). ... 43
Figure 6. Center pixel and eight neighboring pixels for calculating slope within GIS in a raster dataset... 49
Figure 7. Landform shapes (Fels 1994, Troeh 1964)... 55
Figure 8. Observation removed from analysis (topographic data source USGS 2005c). ... 62
Figure 9. Locations of systematic survey points (topographic source: USGS 2005c). ... 68
Figure 10. Locations of degradation problems (topographic source: USGS 2005c). ... 69
Figure 11. Frequency distribution of incision and width from systematic point survey (n=78)... 78
Figure 12. Semivariograms of field measured incision, width, slope, grade, and GIS-derived curvature from 3 m data source... 79
Figure 13. Semivariogram of LIDAR data. ... 80
Figure 14 . Stepwise regression of incision. ... 86
Figure 15. Stepwise regression of width. ... 86
Figure 16. Map of statistically significant high and low values of incision and width (topographic source: USGS 2005c). ... 93
Figure 17. Frequency of problems on Sycamore trail... 95
Figure 18. Dendogram and clusters of problems. ... 97
Figure 19. Spatial location of group members (topographic source: USGS 2005c)... 98
Figure 20. Problem types aggregated into larger categories... 99
Figure 21. Dendogram with aggregated problem classes. ... 100
Figure 22. Spatial location of wet and dry problem types (topographic source: USGS 2005c). ... 101
Figure 23. Comparison of 5 m and 30 m DEM (topographic source: USGS 2005c). ... 107
Figure 24. Output from curvature algorithm for 5 m data source (topographic source: USGS 2005c). ... 118
Figure 25. Curvature adapted from Fels (1994) and Troeh (1965)... 143
Figure 26. Determine the first characteristic of the soil type. ... 145
1.0
INTRODUCTION AND PROBLEM STATEMENT
Walking is the most popular outdoor recreation activity in the United States according to the National Survey of Recreation and the Environment (USDA 2000). It is estimated that over 179 million people engage in outdoor recreational walking annually. To help meet this demand, many parks construct and maintain recreational hiking and walking trails. With increasing use pressure on these trails, degradation of trail conditions has been reported in many parks (Hammitt and Cole 1998). Understanding the underlying factors of trail degradation has become critical to park managers with limited budgets and resources to maintain them.
Trail degradation mediation can be costly (Garland 1990). A relatively recent US General Accounting Office (USGAO) report states a 4 billion dollar maintenance backlog has developed in the National Park System (USGAO 1995). Given the heavy use of trails, it is likely that a substantive part of this backlog is related to trail degradation. For example, the new 290-mile Benton MacKaye Trail was recently completed by volunteer groups to take some degradation pressure off the Appalacian Trail (Miller 2005).
To alleviate the backlog in maintenance and better utilize park budgets, the USGAO calls for more efficient operation of parks. A priori knowledge of locations likely to become degraded could enable park managers to target management efforts and design degradation– resistant trails, thus resulting in more efficient utilization of human and natural resources.
locations of problems that require attention. The ability to use a model as a screening tool to predict trail locations more sensitive to degradation, would enable managers to re-direct staff to visit these locations more frequently, thus saving time and more efficiently utilizing resources as directed by the USGAO. In addition, these models would be very useful in trail design by providing a metric with which to relatively compare the degradation sensitivity of alternative designs.
It is commonly believed that the landform upon which a trail is located significantly influences degradation. Some frequently studied landform characteristics are slope, aspect, grade of the trail, or position of the trail (valley, ridge, mid-slope). Statistical examination of these characteristics may make it possible to use these variables to explain a portion of trail degradation through models.
Traditionally, field-based trail assessments and surveys are used to gather the required detailed landform data. These field surveys can be time consuming and expensive. With the advent of Geographic Information Systems (GIS), slope, grade of trail, aspect, trail alignment angle, the position of the trail, and landform curvature can be computed rather than
measured. GIS is a software tool that operates on digital geospatial data. GIS could potentially provide managers and designers the ability to implement degradation prediction models without the costs of field work.
meters of the earths surface. Choices related to the data source can have a significant influence on the resulting derived data. In one previous study, GIS derived independent variables were not used because it was thought that they represented geographically regional variability as opposed to local scale variability in the independent variable (Dixon et al. 2004).
The second main issue is the lack of a consensus related to how best to model trail degradation. Several studies have made steps in the development of different models of trail degradation, but no one model has emerged. There are questions still surrounding
degradation modeling including the selection of statistical method, and the selection of the dependent, and independent variables.
The research presented here develops models of trail degradation and methods with which to populate those models quickly and efficiently using GIS technology. Issues related to selection of topographic digital data sources and selection of model format are examined. The ability of GIS based models to predict the portion of degradation influenced by landform characteristics will obviously benefit trail managers as described above, but just as
importantly, it could significantly advance the study of trail degradation. If it is established that GIS derived data can be used in trail degradation models without compromising the performance of the model, it could provide a vital step in the advancement of the research. Researchers would be able to reduce field data collection efforts, expand study areas, increase the number of study observations and thus increase the sample size for statistical models, potentially enabling the analysis of more independent variables.
2.0
LITERATURE REVIEW
In order to model trail degradation, one must have a basic understanding of what trail degradation is, as well as what influences it. Trail degradation has been studied from various perspectives. Leung and Marion (1996) identify a management perspective of trail degradation research that examines the problems of trail widening, incision, compaction, and soil loss. This dissertation approaches trail degradation from this same perspective and examines factors associated with degradation evidenced by the widening and lowering of the surface of the trail tread.
The process of trail degradation begins with the initiation of the trail tread. This is an initial disturbance of the soil that interrupts the natural ecological processes that occur at that location (Bryan 1977). Once a trail tread has been developed, soils are exposed and more vulnerable to natural geomorphic processes (Coleman 1981, Chappell 1996). These geomorphic processes can be aided and exacerbated by use (Bryan 1977), which can accelerate the natural process of chemical and physical weathering (Arrowsmith and Inbakaran 2002). When degradation problems develop, hiker avoidance behavior can trample trailside vegetation and lead to the widening of the trail tread (Bryan 1977).
The trail degradation process appears simple at first glance, however, each part of the overall processes (disturbance, natural geomorphic processes, and use) can be very complex. To examine these complexities, a review of the literature related to the factors that influence trail degradation is conducted. Then, ways that these factors have been assessed and
Finally, a section detailing the use of GIS in trail management, design, and research is provided. In addition to this discussion of GIS and trail related papers, a sub-section of work related to GIS and geomorphology is discussed. These geomorphologic studies are valuable in that they are applications of GIS to landform-related processes and problems.
2.1
Factors of Trail Degradation
2.1.1 Use and Biophysical Factors
It is commonly believed that use of a trail is often a catalyst to degradation processes involving the surrounding vegetation and trail tread soils. This belief may lead managers to restrict use. As early as 1980, half of all U.S. park managers surveyed stated that they had already implemented controls on recreational use at their facilities (Bury and Fish 1980). By 1993, 46 percent of managers had actually closed selected environmentally sensitive areas of their parks (Marion et al. 1993).
Research related to trail use and degradation generally focuses on type of use (Deluca et al. 1998), and/or volume of use (Bryan 1977). Most studies focused on the effect of use volume, however the impacts vary in intensity according to the type of use (Cole and Spildie 1998), or even between individual users (Coleman 1981).
Some studies indicated a curvilinear relationship between intensity of use and impact on trails (Dale and Weaver 1974, Coleman 1981). Farrell and Marion (2001/2002) note that trail widths (an indicator of trail degradation) at Torres del Paine National Park in Chile were influenced by use at low volumes, but were not sta tistically different at high volumes.
2.1.1.1 Vegetation
Trail degradation could be the result of interactions between use, vegetation types, and geomorphic processes on the landscape (Whinam and Comfort 1996, Coleman 1981, Summer 1980, Weaver et al. 1978, Bryan 1977, Dale and Weaver 1974). For example, users can trample and destroy vegetation, leaving soils vulnerable to erosion. Some specific degradation problems exacerbated by use interactions are soil loss (Whinam and Comfort 1996) or the widening of a trail tread (Bright 1986). Use interactions may have a stronger influence on trail tread width than incision (Dixon et al. 2004, Farrell and Marion
2001/2002).
Trampling of trailside vegetation as hikers use trails can damage and remove trailside vegetation resulting widening of the trail width. Trampling of trailside vegetation had greater impact on trail widths more than slope or soil type (Bright 1986). The examination of
vegetation as a factor of trail degradation can be approached in two ways: first, the impact of
the presence of a trail and its use on the surrounding vege tation, and second, the effect of trailside vegetation type on the likelihood of degradation. Most of the literature focuses on the former dynamic rather than the latter, and this bias is reflected in this literature review. However, it is important to note that both processes will ultimately influence the width of a trail.
communities by increasing the number of some species while decreasing the number of others (Dale and Weaver 1974).
A species ability to withstand or resist initial impact by trampling and later regenerate (resistance) is affected by the plant structure. Hall and Kuss (1989) noted that low growth forms, early bloomers, graminoids, hemicryptophyte, therophyte, or chamaephyte are the characteristic plant types along trail borders. On the other hand, undisturbed areas are characterized by scattered cover and frequency of woody growth forms, delicate herbaceous, phanerophyte, or geophyte life forms.
Low shrubs, seedlings, and lichens are highly susceptible to damage. More mature trees and thorny shrubs are generally affected very little (Cole 1987). Vegetation cover decreases in trampled areas as opposed to undisturbed sites (Bhuju and Ohsawa 1998). Also, growth differences have been observed in tree seedlings after the first two years of growth at sites where soils were compacted due to trampling (Bhuju and Ohsawa 1998, Pritchett and Fisher 1987).
Bayfield (1973) reports that tread widths in grassy areas are consistently narrower than wooded areas. However later studies by Dale and Weaver (1974) and Farrell and
Marion (2001/2002) contradict Bayfield’s finding and note that trail widening and braiding is more likely in grasslands. Nepal (2003) corroborates Farrell and Marion’s findings and notes in his study that the development of secondary trails is more likely on grasslands.
Weaver et al. (1978) report that wooded areas, spruce - fir, xeric oak and pine, gray beech, mesic hemlock hardwoods, hemlock, and early successional forest types are
northern hardwoods are generally less degraded, although most of the study trails in northern hardwoods are located on old railroad beds, explaining in part their better condition. Bratton also notes that some of the worst degradation can be found in old growth or “virgin” forests. Herbaceous understories are comparatively more damaged than shrub and ericaceous
communities.
Longer-term effects of trail construction and use can be seen in plant community composition. It can be difficult for vegetation to recover from trailside trampling. Regeneration is especially slow for species that rely on the presence of topsoil for reproduction (Coleman 1981).
2.1.1.2 Soil
Lutz 1945). The cycle of compaction and trail degradation is depicted in Figure 1 adapted from Manning’s (1979) seven-step cycle of recreational impacts on soils.
Increase in soil erosion
Increase in water runoff
Reduction in water infiltration rate
Loss of organic material
Reduction in soil macroporosity
Reduction in air and water permeability Loss of leaf
litter
Figure 1. Seven-step cycle of recreational impact on soils. Manning (1979).
meadow environments, and 50 percent recovery in shrubby understory forests. Parikesit et al. (1995) found that compacted soil environments on cliff-edge trails did not completely recover even after 10 years. An analysis of the compaction of soils caused by frontier wagon traffic shows that compacted soils can persist for more than 100 years (Sharratt et al. 1998). Other factors that interact with soil to degrade a trail are rainfall amount and intensity, slope length, steepness, aspect, elevation, parent material, soil characteristics, and vegetation characteristics (Kuss and Morgan 1980). Even the mechanics related to walking can have an affect on trail degradation. As a person walks on soil, the heel of the foot compacts, then the toe shears and breaks loose particles making them more susceptible to erosion (Quinn et al. 1980).
Some distinctions are made in the literature between specific soil properties and their propensity for trail degradation. A study by Bryan (1977) showed that with equal use on any two trails, soil properties were the main determinant of trail degradation. The main
properties of soil that relate to trail degradation are particle size, stoniness, and shear strength (Coleman 1981). Soils with homo genous fine particles are more prone to degradation
(Hammitt and Cole 1998, Helgath 1975).
Clayey, spongy, silty, and organic soils should be avoided for trail construction (Birchard and Proudman 1981, Whinam et al. 2003, Stewart and Cameron 1992, Summer 1980, Bryan 1977). Especially when they are wet, even minimal trampling of these soil types can lead to mud puddles (Bryan 1977), or incision (Summer 1980). A sandy-clay loam mixed with gravel is an ideal soil type for trail construction (Birchard and Proudman 1981).
2.1.2 Landform Related Factors
2.1.2.1 Grade and Slope
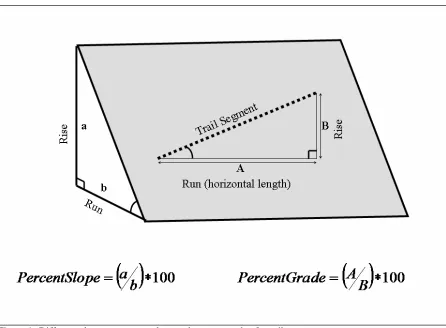
The grade of a trail can be expressed by the change in elevation divided by the length of trail segment (rise/run). This is different from the slope of the landform upon which the trail is constructed, which is sometimes referred to as sideslope. A trail can have a grade of zero, yet be located across any slope from 0 to 100 percent theoretically. The relationship between the grade of trail and degradation is different for various vegetative habitats, however; in general, as grade increases, degradation increases (Helgath 1975).
the trail, thereby increasing erosion potential. Table 1 compiles figures of recommended trail grades according to type of trail.
Table 1. Recommended grade classes for different trail types.
Type of Trail Acceptable
Slope Additional Comments Citation
Wheelchair 1% Hesselbarth
(2004) Unspecified 5 to 12% Recommended for most trails Hesselbarth
(2004) <15% even in steep terrain Birchard and
Proudman (1981) Hiking Trail
up to 30% only if section of trail is short Birchard and Proudman (1981) Scramble
Route 20 to 50% Only on durable soils
Hesselbarth (2004) <9% keep a steady grade with small breaks where slope <5% Vogel (1982) Equestrian
Trail
up to 15% only on short segments Vogel (1982)
The U.S. Department of the Interior reports that a 10-70 percent slope of the landform is acceptable when designing trails (U.S. Department of Interior 1992). Erosion risk is categorized as risk scores according to slope parameters by Garland (1990). Table 2 below shows risk scores that numerically increase with risk, and the slope category associated with each score. The index only holds true under the listed maximum daily rainfall (MDR) conditions.
Table 2. Risk score and slope categories based on maximum daily rainfall (MDR).
Risk Maximum Daily Rainfall (mm) Slope
1 < 300 <6
2 300-400 6-10
3 401-500 11-15
4 501-600 16-20
5 > 600 21-25
6 --- >25
Source: Garland (1990)
2.1.2.2 Trail Alignment
the slope can act as gulleys or channels for water runoff (Yoda and Watanabe 2000, Bryan 1977).
Different trail positions relative to the landform can lead to several site-specific problems. Often, trails are positioned in valley bottoms along streams to take advantage of their scenic beauty. Drainage in this type of setting can be particularly difficult, especially if the trail becomes entrenched. Persistently wet soils lead users to walk around problems like puddles into surrounding vegetation, damaging it and leading to the development of
excessive trail tread widths. These persistently wet soils, and their associated problems, are often found in valley bottoms and other areas of poor drainage (Nepal 2003, Leung and Marion 1999a, Bryan 1977). Cole (1983) and Marion (1994) suggest that unless a trail is re-routed completely out of a valley bottom, major construction of drainage structures and walking surfaces may become necessary.
Trails positioned immediately below the crest of hills in the Rocky Mountains are highly susceptible to erosion, while those located in valley bottoms are least susceptible to erosion and most susceptible to increases in width (Summer 1986). Ridgetop positions aligned (parallel to the slope of the land) are more susceptible to degradation due to the difficulty of draining water from the tread (Leung and Marion 1996). Birkby (1996)
2.1.3 Evaluation of the Literature Related to the Factors of Trail Degradation
The factors of trail degradation and their interaction with each other is complex and multifaceted, however some themes are clear throughout the literature. Obviously it is important to locate trails on soils and through plant communities that can withstand traffic. Use seems to exacerbate the shortcomings of particular vegetative species and soil types leading to degradation. Some studies that examine volume of use and trail degradation (Farrell and Marion 2001/2002, Helgath 1975) point to the possibility that the curvilinear responses noted by other researchers (Dale and Weaver 1974) may be more complex. The concept of a threshold within the relationship between human activity and erosion is well documented in the geomorphology literature (Bocco 1991). Further study of the amount of use and amount of degradation may clarify if thresholds exist within the relationship between volume of use and trail degradation. The presence of thresholds may explain, in part, the conflicting findings related to volume of use and trail degradation.
Another clear theme in the literature is the influence of a trail’s landform location on degradation. The connection between landform location and degradation is established, however past research study areas are located in very diverse environments (alpine, beach, tropical, etc.). Each researcher describes carefully the study area, but little is typically written about how long the dominant degradation processes have been acting on the study sites, and how the introduction of a trail tread, a linear feature on the landform, altered or exacerbated these processes. More description of the natural geomorphic processes acting on each of these environments would make them more comparable.
for water, then the age of the trail may be closely related to the severity of degradation
problems. When multiple trails are examined in a single study, the date of construction could be a confounding factor when comparing the trails.
Some studies, like Dixon et al. (2004), attempt to control for the age of a study trail. Few others, like Bryan (1977), mention time as a factor in the geomorphic process, these cases, however, are not the norm.
The next step in the examination of the factors of trail degradation is a statistical examination of the relationships between these factors and specific indicators of trail degradation. The following section examines studies tha t have focused on these relationships.
2.2
Models of Trail Degradation
Models are representations of reality. Some models not only represent reality, but attempt to express the relationships between different phenomena (Mandel 1964). The two most common predictive statistical model types for trail degradation are multiple regression and logistic models.
Standard regression models predict a continuous dependent variable as a function of explanatory independent variables. Logistic regression analysis is ofte n used to investigate relationships between a discrete dependent variable and a set of explanatory variables. These discrete responses are pre-defined. Logistic regression returns the probability that a
2.2.1 Multiple Regression Models
Coleman (1981) uses multiple regression to model three dependent variables that are indicators of trail degradation (incision, path width, and bare ground width). Independent variables included are recreation pressure, grade of trail slope, and elevation, ridge
alignment, vegetation type, unrestricted path and, soil type. Coleman was able to predict 66 percent of the variability in a trail’s path width, 52 percent of the variability in bare ground width, and 46 percent of the variability in a trails maximum incision. Coleman’s models for each dependent variable are presented in Table 3 below.
Table 3. Results of models of path width, bare ground width, and incision.
Dependent Variable Independent Variables R-square
Path Width recreation estimate, grade, slope, unrestricted vegetation type
calluna heath, interaction between recreation estimate and slope 0.66 Bare Ground Width recreation estimate, altitude, vegetation type calluna heath,
ridge location, and interaction between recreation estimate and slope 0.52 Maximum incision slope, soil type of brown earth, podsol soil type,
and interaction between recreation estimate and slope 0.46 Source: Coleman (1981).
Another model of cross-sectional trail soil loss is developed by Jubenville and O’Sullivan (1987). Slope is first measured for barren and various types of vegetated plots, then an ANOVA table is developed to analyze the effects of the nested soil/vegetation independent variables. Slope within vegetation type is found to be a statistically significant predictor, and accounted for 35.2 percent of the total variability in cross-sectional soil loss. Jubenville and O’Sullivan note that other variables not included in their model may account for more of the variability in soil loss.
A predictive model of cross sectional area soil loss using multiple regression is developed by Godwin (2000). A stepwise regression is used to select from a pool of
available variables those that best explain the variability in the dependent variable. Several versions of the dependent variable (cross sectional area adjusted in different ways for compaction) are assessed. Available independent variables included in the model are
measures of trail grade, soil water content, percent vegetative cover, slope, profile curvature, plan curvature, aspect, elevation, catchment area, trail alignment angle, and several soil particle size categories. Slope, soil water content, and aspect explain 43 percent of the variability in the dependent variable of incision with no adjustment. When the same analysis is performed for a dependent variable adjusted for compaction, 60 percent of the dependent variable is explained by grade, particle size > 2 mm, and percentage of understory vegetation cover.
outcrops, landform unit, slope position, slope length, slope of landform, micro-topography, and note the presence or effectiveness of any runoff diversion drains. Correlations are computed between soil loss and each of the site factors and between erosion severity and each of the site factors. Independent variables statistically significant correlated to the dependent variables are included in a pool for a stepwise regression analysis. The stepwise analysis is constrained to include only independent variables significant at the 0.05 level, and removed from the model if significance reaches 0.1. The only independent variables that satisfy this criteria are site gradient (a measure of the grade of the track), and upslope track length. These two variables account for 48.2 percent of the variability in cross-sectional soil loss, and 49.5 percent of the variability in erosion severity class.
2.2.2 Logistic Regression Models
In recent years, logistic regression is utilized by Nepal (2003) and Dixon et al. (2004) to predict trail degradation. Nepal (2003) uses multinomial logistic regression to model degradation severity classes. Each degradation class is computed based on the frequency and severity of degradation problems. Independent predictor variables are trail position, altitude, aspect, trail grade, soil moisture, soil type, tread type, vegetation type, frequency of visitors, packstock use, frequency of lodges, natural hazard type and potential. Trails are found to be more severely degraded in erosion prone high hazard potential areas and on flat or steep grades with high levels of use and frequent lodges.
age, and confinement are predictors of width. No effective predictors are found for rate of change in trail width.
2.2.3 Evaluation of the Literature Related to Models of Trail Degradation
It is difficult to draw conclusions from the success or failure of various models of trail degradation because there is an overall lack of consistency in the dependent and independent variables included in the models. However, there does appear to be some consistency in the selection of statistical techniques. Multiple regression seems to be the preferred method when the dependent variable is a continuous type of measurement, and logistic regression is utilized where the dependent variable is categorical in nature.
Overall, models that use a composite measure of incision and width are less successful than models that predict each of the measures independently. Further research may clarify the nature of the relationships between various independent variables and incision and width. It is possible that specific independent variables could be positively correlated with one and negatively correlated with the other. This would confound a model’s ability to predict a composite incision/width dependent variable like cross-sectional (volume of) soil loss.
2.3
Trail Degradation Assessment Methods
The scope of trail assessment may include visual, social, and resource degradation. This dissertation focuses on resource conditions only. To collect data to measure trail degradation, two decisions must be made. First, a sampling frequency or design must be developed, and then a method to assess the degradation at sample locations must be determined. Often, the sampling design and method of measurement is only briefly mentioned in a trail degradation study. Relatively few studies comparatively assess the accuracy or precision of a particular method. The following is a review first of sampling designs, then of degradation measurement techniques.
2.3.1 Sampling Design
Over the past 30 years, trail researchers have developed and employed several different field-sampling methods. Sampling designs utilized for trail assessments in the past can be classified into three major categories: replicable measurements, rapid surveys, and complete census.
Table 4. Advantages and disadvantages of different survey designs.
Type of survey Advantages Disadvantages
Replicable survey (permanent point survey)
• Provides accurate and precise data on changing trail conditions.
• Very time consuming.
• Does not characterize overall trail condition Rapid survey
(systematic sampling based)
• Permits rapid assessments of general trail conditions.
• May not accurately characterize trail problems unless a large number of sample points are used.
• Not sensitive to small changes Census survey (problem
assessment)
• Permits rapid assessments focused on trail problems of greatest management concern. • Characterizes the condition of the entire trail.
• Focuses on trail problems.
• Not able to characterize average conditions for indicators such as trail width or muddiness. • Not sensitive to small changes.
Source: Monz (2000).
The sampling method selected often reflects the objectives of the research. For example, a trail transect system spaced 100 meters apart is used by Leonard and Whitney (1977) to study trail changes over time. Permanent markers allow researchers to re-visit the sample locations at a later date to record changes both on and near the trail. Leonard and Whitney note that the objective is not to measure and represent all trail conditions, but to track critical trail conditions over time. Most longitudinal studies require the installation of permanent markers.
Sharratt et al. (1998) also use a trail transect when assessing soil structural modifications along a historic wagon trail, but only place them in areas that meet certain criteria. A systematic sample is then performed along the transect to characterize the changes in soil structure.
states that a random sample would be preferred, but the size of his study area makes this impractical.
Sometimes, samples are located purposefully to measure pre-defined conditions within the landscape. Sites within alluvial and residual soils are hand selected by Wallin and Hardin (1996) for their study of trail-related soil erosion in Ecuador to make comparisons between degradation found in each environment.
Some procedures take a census of pre-defined trail degradation problems. For example, a problem assessment method is employed by Marion (1994) to target and
characterize problems and management efforts on trails in Great Smoky Mountains National Park. The problem assessment method measures and records every obvious and severe trail degradation problem, and any management efforts (e.g. muddy soils, excessive incision, water bars, drainage dips, mud puddles, and excessive width).
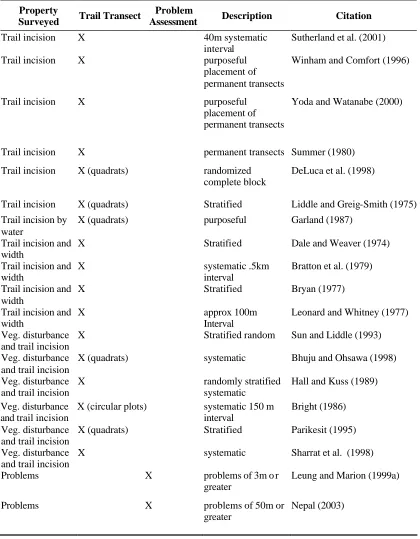
Systematic point sampling is more appropriate when the objective is to characterize a continuous type of phenomena, while a complete census of problems is more appropriate when a characteristic can be pre-defined and occurs infrequently (Marion and Leung 2001, Farrell and Marion 2001/2002). Leung and Marion (1999b) examine the influence of systematic point sampling interval in the accuracy of trail impact (problem) assessment. Their study indicates that sampling intervals less than 100 m result in only a 10% accuracy loss, while sampling intervals of 100 to 500 m result in approximately 50% accuracy loss.
Table 5. Summary of sampling procedures.
Property
Surveyed Trail Transect
Problem
Assessment Description Citation
Trail incision X 40m systematic interval
Sutherland et al. (2001) Trail incision X purposeful
placement of permanent transects
Winham and Comfort (1996)
Trail incision X purposeful placement of permanent transects
Yoda and Watanabe (2000)
Trail incision X permanent transects Summer (1980) Trail incision X (quadrats) randomized
complete block
DeLuca et al. (1998)
Trail incision X (quadrats) Stratified Liddle and Greig-Smith (1975) Trail incision by
water
X (quadrats) purposeful Garland (1987) Trail incision and
width
X Stratified Dale and Weaver (1974) Trail incision and
width
X systematic .5km interval
Bratton et al. (1979) Trail incision and
width
X Stratified Bryan (1977) Trail incision and
width
X approx 100m
Interval
Leonard and Whitney (1977) Veg. disturbance
and trail incision
X Stratified random Sun and Liddle (1993) Veg. disturbance
and trail incision
X (quadrats) systematic Bhuju and Ohsawa (1998) Veg. disturbance
and trail incision
X randomly stratified systematic
Hall and Kuss (1989) Veg. disturbance
and trail incision
X (circular plots) systematic 150 m interval
Bright (1986) Veg. disturbance
and trail incision
X (quadrats) Stratified Parikesit (1995) Veg. disturbance
and trail incision
X systematic Sharrat et al. (1998) Problems X problems of 3m o r
greater
Leung and Marion (1999a) Problems X problems of 50m or
greater
2.3.2 Measurement of Trail Degradation
There are several ways to measure trail degradation. Most measurement techniques attempt to quantify the incision or width of a trail. Some studies describe in detail the technique utilized, but only one (Farrell and Marion 2001/2002) comparatively assesses the applicability of more than one measurement.
2.3.2.1 Incision
Deluca et al. (1998) and Sutherland et al. (2001) measure incision and trail roughness. A link chain is laid across the trail tread to conform to the profile of the trail tread. The total length of the chain is measured, and then the straight-line distance between the trail edges is measured. Determination of the edge of the trail is a qualitative judgment. The two
measurements are then used to calculate a Saleh roughness factor (SRF) (Saleh 1993) using the following formula:
− = pd sld
SRF 100 1 Equation 1
where, (sld) is the straight line distance and (pd) is the profile distance.
these two methods by comparing the maximum incision measurements from the current trail tread surface and the post trail creation surface, measures from both methods are significantly related to the trail grade (Farrell and Marion 2001/2002).
Warner and Kvaerner (1998) take a more technical approach to measuring trail incision by photographing the trail’s tread simultaneously with two cameras. The
photographs are then used to develop digital terrain models of the trail tread. The accuracy of their measurements is found to be within 1% of total volume. While this method is highly precise, it is time consuming and requires a high level of technical expertise.
2.3.2.2 Width
A few studies describe in detail the methods used to measure trail tread width. Leonard and Whitney (1977) establish permanent trail transects to measure changes in a trail’s tread, they state that the trail boundary is the point between exposed soil or bedrock and trailside vegetation. Dale and Weaver (1974) mention the measurement of width (measured with a rigid pole), but not the criteria for deciding the boundaries of a trail. The pole is then used as a baseline from which the depth of the trail is measured.
The border between a trail’s tread and the surrounding landscape is not discreet in nature, but should be thought as a transition zone where the density of plant litter increases along with a gradual colonization of plant seedlings. The difficulty of measuring the incision and width of a trail due to the lack of clear–cut boundaries on the trail tread is first noted by Dale and Weaver (1974). Lance et al. (1989) further clarifies the nature of a trail tread boundary as a “transition zone” outside a zone of bare soil on the sides of the trail tread. The transition zone where plant litter becomes more prevalent is where the surveyor must
delineate the trail tread boundaries.
2.3.3 Evaluation of the Literature Related to Trail Assessment Methods
One of the most significant gaps in the literature on trail assessment methods is related to the measurement of incision and width. While it has been established that the boundary of a trail’s tread is not discrete, but there has been little discussion about how measurement of this boundary can influence other measures of trail degradation.
Figure 2. Delineation of the trail tread boundary can influence measurements of incision and width.
Farrell and Marion (2001/2002) touch on this issue in their analysis of post
construction incision vs. traditionally measured incision. However, within other studies, the subjective delineation of a trail tread boundary by multiple surveyors working on a single study could result in artificially introduced variability within measures of incision and width. Subsequent models developed to predict incision and width as dependent variables would lose power due to the introduced uncertainty.
One way to avoid this problem is to ensure consistency in the inevitably subjective placement of a trail tread boundary. As long as the surveyor(s) is(are) consistent in the subjective placement of the border of the trail tread, the measurements should be more comparable to each other and more useful in statistical analyses.
and position on the landform to be measured as precisely as possible. Computing measurements in a GIS system may be one way to eliminate the inevitably introduced artificial variability due to minor error introduced when these variables are measured in the field. The following section reviews how GIS has been used in the past in the study of trail degradation.
2.4
Geographic Information Systems (GIS)
A recent survey of approximately 350 trail managers notes that over 75 percent of their representative agencies have found value in the use of GIS for inventory, planning, and management purposes (Lynch et al. 2002). Half of the trail managers that did not already have internal GIS capabilities plan to use GIS in the future (Lynch et al. 2002).
Even though the usefulness of GIS is well established within the park management community, only a few studies have used data derived from GIS to model trail degradation. For a more comprehensive literature review, studies related to geomorphic models of general landscape degradation are included. The idea that trail degradation is, in part, due to natural geomorphic processes is well established within the field of trail degradation (Chappell 1996, Coleman 1981, Bryan 1977). Therefore, the inclusion of GIS and geomorphology related literature is a natural extension of the GIS and trail degradation literature review.
2.4.1 GIS and Recreational Hiking Trails
The literature related to GIS and recreation hiking trails extends from applications to management problems, to applications to trail design and the prediction of trail degradation problems. The following review of GIS and trail literature discusses the types of GIS applications found within the trail literature.
2.4.1.1 Application to Trail Manageme nt
Much of the GIS and management literature is related to the analysis and tracking of visitor use and park resources. Wing and Shelby (1999) survey visitation in McDonald Forest, Oregon and apply the data to linear features representing trails using a GIS dynamic segmentation technique. The result is a spatial representation of density of use within the park.
McIntyre and Weeks (2002) use GIS to study the impacts of illegal immigration on Cleveland National Forest in California. Maps of the existing formal trail network
maintained by park personnel are entered into the GIS system. Social trails, campsites, and other impacts by immigrants are mapped with the use of a Global Positioning System (GPS) and then entered into the GIS system. GIS is then used to determine the total length of new trails and amount of disturbed ground cover. This descriptive information of impacts is then combined with estimates of numbers of illegal immigrants to calculate a per-immigrant impact on the park.
collected are social trails, which are classified into four categories. Intersections between social and formal trails are identified with the use of aerial photographs. The locations of social trails are then compared with mapped environments sensitive to visitor impacts.
Aporta (2003) combines the use of GPS with GIS applications to record the
traditional routes and places used by the Inuit of Igloolik eastern Canada. The author notes that use of a GPS unit to record coordinates of trails and places used by the Inuit is
straightforward, flexible, and inexpensive. The GPS coordinates are then used to map Igloolik trails and resources.
GIS is also used as a tool to predict use patterns and wildlife conflicts. Harris et al. (1995) use GIS to model locations where human activities are likely to intersect with sensitive wildlife. Use data and wildlife habitat data are mapped. Areas where use and habitat overlap are considered potential areas of conflict. Schumacher et al. (2000) apply GIS techniques to predict spatial patterns of public land use. They use GIS techniques to determine locations where human activity is likely to conflict with sensitive species in Lolo National Forest. U.S. Census Bureau data, 30 m resolution Digital Elevation Models (DEMs), land ownership, and transportation infrastructure geographic data are analyzed using raster GIS techniques in a 90 m grid resolution to predict the intensity of human use in the park. This is compared with spatially predicted locations of sensitive species to
determine where conflicts are likely to occur.
encounters with the landscape and other users on a pixel basis along an existing or proposed trail network.
2.4.1.2 Application to Trail Planning and Design
One way GIS has been applied to trail planning and design is through the
identification of areas suitable for the location of trails. Bridgeland et al. (2002) survey trails in Nova Scotia, Canada, and then map their biophysical factors (aspect, drainage, slope, elevation, soil, vegetation, land district, and surface material) that may be correlated with classes of trail degradation. The geographic layers found to be correlated with degradation classes are then used to assess suitability for hiking trail development. In Bridgeland’s study, aspect, elevation, and slope are computed from 1:50,000 DEMs.
Several researchers have investigated the usefulness of least cost pathway algorithms in delineating initial trail alignments. Xiang et al. (1996) incorporates aspect, soil types, vegetation types, construction costs, land acquisition costs, and visibility to develop a score for each 16-meter resolution pixel, and then uses a least cost pathway algorithm to delineate a new trail alignment. Tamerius and Xiang (1997) apply a similar technique for the location of cross country ski trails. Ferguson (1998) also applies least cost pathway algorithms based entirely on landform slope to generate a GIS-designed trail alignment.
slightly. The cattle are thought to be better at averaging over long distances, while the GIS is restricted by the ability to look only “one step” ahead. Even though Ganskopp’s
application is to cattle trails, the methods used in the study may be of interest to trail designers, especially in the assessment of the level of energy (or difficulty) required by humans to hike trails.
2.4.1.3 Application to Trail Degradation Models
Lu et al. (1994) develop a model for new trail alignment that weights each land parcel by its suitability to both support degradation-resistant trail treads and the availability of scenic views. Factors used to develop suitability scores are slope, soil type, vegetation type, and frequency of viewshed opportunities. The land parcels with associated suitability scores are then converted to polygon centroids. The centroids are then connected using network analysis procedures. A report is generated that shows the route with the highest suitability score.
new aesthetic opportunities (visual experiences). The model is only recommended for implementation in resolutions or scales larger than 1:24,000.
Arrowsmith and Inbakaran (2002) use GIS to derive variables for use in a model of environmental resiliency for the location of hiking trails. Various environmental variables are surveyed, and then GIS is used to interpolate the survey data across space to a 100 m raster grid. Slope and aspect are derived for survey locations by computing a triangular irregular network (TIN) from contour lines. Amount of sunlight is computed using a sunshade algorithm that takes into account the position of the sun and terrain. Digital vegetation data is obtained from a recent draft management plan. Soil type data is derived from the vegetation classes. No evaluation of the effectiveness or accuracy of GIS derived data is performed.
A model of hiking trail trampling sensitivity is developed by Whinam et al. (2003). The model is based on data derived from experimental trampling sensitivity in several vegetation communities and GIS derived slope categories. The slope categories are
developed based on 10 m DEMs computed from contours. Vegetation and slope classes are combined to model trampling sensitivity. Whinam et al. point out that the scale of
geographic information available affects the application and use of sensitivity maps, and that their study results in regionally, not locally, applicable sensitivity maps. They also note that small geographic scale variability of local drainage can influence trampling sensitivity. Whinam et al. are not able to resolve these small geographic details with the 1:25,000 scale vegetation maps.
where data about incision, tread width, width of vegetation impact, drainage, tread surface, geology, soil depth, and terrain gradients are recorded. Dixon et al. note that much of the data included in the model can be derived in a GIS system, however GIS derived data would represent regional, as opposed to local scale data. For this reason, Dixon et al. survey in the field all of the variables used in their degradation model.
2.4.2 Use of GIS in Geomorphic Models of Landform Degradation
The literature related to models of landform degradation, and the use of GIS derived data within these models is comparatively well developed. The following review focuses on how GIS techniques are used to resolve problems associated with landform degradation (the transport of soil from one location to another).
The use of various scales of DEMs in the study of geomorphology is gaining
popularity (Dehn et al. 2001). Chappell (1996)uses DEMs to study the spatial variation of processes in the redistribution of soil. Chappell’s study creates indices of erosion that help to identify areas susceptible to water and aeolian processes. Elevation values are used from a 30 m DEM to interpolate a new 5 m resolution DEM. The new 5 m DEM is then used to model erosional processes by computing slope gradients and catchment areas. Chappell does not evaluate the effectiveness of the use of the DEM, but does indicate that the transport model is effective.
model is found to be superior for practical application and the prediction of spatially sampled observations from a continuous type surface. When selecting the scale of resolution of the DEM from which to survey, McKenzie and Ryan note that the scales at which the process operate should be the guide.
McMillan et al. (2000) use DEMs to classify soil-landform elements automatically. The most commonly computed landform attributes of slope, aspect, and curvature among other landform attributes are computed based on “high resolution” DEMs. The DEM based measureme nts are then used in a fuzzy classification system to classify various landforms for precision farming.
2.4.3 Evaluation of the Literature Related to GIS, Trails, and Degradation
The usefulness of GIS in recreation planning and management is firmly established, however the use of GIS to derive variables for input into trail degradation models is still in its infancy. Where GIS has been used to derive variables for use in statistical degradation
models, there has been no assessment of the validity or applicability of the derived
3.0
OBJECTIVES
The literature review presents the existing body of research that is focused on the factors influencing trail degradation, trail assessments, and trail survey methodologies. GIS has been applied to some trail research, but its full capabilities in this arena have yet to be explored. This study attempts to complete the linkages between trail degradation, trail assessments and surveys, and GIS to model trail degradation. In this dissertation, three general objectives build upon each other to form an exploratory study that develops models of trail degradation indicators (incision, width, and specific extreme problems), and quickly and efficiently populates those models with acceptable landform data.
These objectives are to:
1. Determine which of the manually field measured land form variables can be replaced with GIS-derived measures.
2. Explore the effect of replacing field measured landform variables with GIS-derived landform variables in trail degradation models.
3. Describe the spatial distribution of extreme trail degradation problems in relation to landform characteristics.
4.0
METHODS
To fulfill the objectives of this research, field surveys were performed in the April of 2004 to collect information about degradation (incision, width, and a census of problems) experienced on an existing 5 km loop trail in William B. Umstead State Park in North Carolina. Landform characteristics that were found in the literature to influence trail degradation (slope, trail grade, trail alignment angle, soil texture, aspect of landform, surrounding vegetation, trail position (valley, ridgetop, midslope), spreading/collecting landform shape, and soil moisture) are surveyed in the field. The field assessment consists of two separate surveys, one based on systematic point sampling to characterize general trail conditions, and the other based on a census of extreme degradation problems. These surveys yield two populations of data that will be treated separately in the following statistical models.
The statistical models are based on data related to landform characteristics measured at the sample locations in the field and from digital data sources in the GIS environment. A significant aspect of this research is the comparison of models using these field measures to models employing readily available digital data (e.g., USGS Digital Elevation Models) at different resolutions.
4.1
Study Area
4.1.1 Location
1934, when federal and state agencies purchased the land to create the park. At that time, most of the tracts purchased were depleted farmlands. In 1934 the Civilian Conservation Corps constructed the park and forests have since returned. The park was selected for this study because it receives heavy use and has trails with significant degradation problems. Figure 3 shows the location of William B. Umstead State Park in the State of North Carolina, and a more detailed map of the area and the location of the trail.
4.1.2 Physical and Ecological Characteristics
The forest around the trail is a mix of deciduous and evergreen, but is not considered “old growth” (North Carolina Division of Parks and Recreation 2005). William B. Umstead State Park is located is the Southern Mixed Forest ecological province (Bailey 1995). The loop portion of Sycamore trail is approximately 5 km long and is not surfaced with any manufactured or man-made material. The trail travels through valley, mid-slope, and ridge landform locations. Figure 4 shows the trail and the surrounding topography. A vertical exaggeration factor of 2 has been applied to highlight topographic differences.
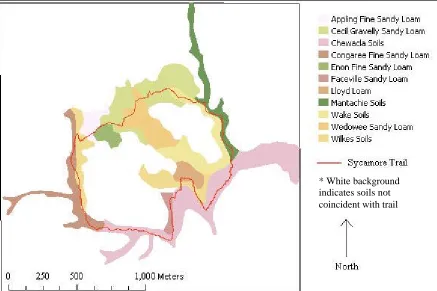
The soils upon which the trail was built are mostly sandy loams. These loams range in texture from finer sandy loams to more coarse gravelly sandy loams. Figure 5 below shows detailed soil types around the trail (Wake County 2005).
* White background indicates soils not coincident with trail
Figure 5. Soil types upon which Sycamore Trail is constructed (Wake County 2005).
4.1.3 Use and Management
Summer 1980, Bryan 1977, Dale and Weaver 1974). To study an existing trail, one must either quantify the amount and type of past and present use, or control for it. Helgath (1975) notes that trails “with the same amount of use throughout still would have variable amounts of deterioration dependent on site factors.” The only practical way to examine these site factors is to select a loop trail with a restricted type of use. This does not mean that a bicycle, horse, or motorized vehicle has never been used on the trail, but we can infer that these types of use are only occasional.
In May of 2002, a census of trail degradation problems was performed by some summer interns from local universities under the direction of park management staff. At that time, the trail showed a variety of problems. Table 6 below lists the problems found, the number of incidences, and the total length of each problem type surveyed.
Table 6. Summary of Sycamore Trail Problem Assessment Survey performed in 2002 by park management and interns (Bouldin 2004).
Problem Number of incidences Total Length of problem (m)
Braiding 4 0
Compaction 63 2457
Cupping 72 1934
Other Damage 1 0
Puddles 3 59
Social Trails 63 0
Trail Creep 21 0