Scheduled Castes Literacy In Telangana –A Spatial
Perspective
Dr. B. Srinagesh
Associate Professor, Department of Geography,
Osmania University, Hyderabad-500007,TelanganaABSTRACT
“To ensure that, by the same date, children everywhere, boys and girls alike, will be able to complete a full course of primary schooling and that girls and boys will
have equal access to all levels of education” 19th point,
United Nations Millennium Declaration, 2000.
A person who is able to read and write with understanding in any language is recorded as literate. Literacy is the best possible barometer to judge the level of educational awakening in a state, leading to a minimum capacity for self-learning. Education is one of the important needs of life. Education is considered as a key indicator of human development and progress. Education is the most important pre-requisite for achieving the goals of personal, social, political, economic, and cultural development. In other words, education is the most effective instrument for meeting the challenges that dalits are facing. Education is the most important element for the development of human being. So, vast inequalities exist within the education system in India. Historical evidences in this regard indicate that Dalit community has been excluded from the whole process of education since centuries. In comparison to other developed countries our literacy percentage is not so satisfactory. Telangana is the newly formed state of India. It is the 12th largest state with a population of more than 300 millions. Dalits constitute about 17 percent of the total population in Telangana. The main objectives of the study area are as follows: To study the spatio-temporal analysis of literacy levels of Scheduled caste; To study the present educational status of scheduled caste; To study the differential levels of literacy with others Methodology: The Main data source for the study area is from secondary data, taken from various Govt. and Non govt. organizations like; Census of India, Directorate of Economics and Statistics, DISE, SSA etc
Key Words: Spatial analysis ,Scheduled Castes, Literacy,SSA,RMSA
1. Introduction:
A person who is able to read and write with understanding in any language is recorded as literate. Literacy is the best possible barometer to judge the level of educational awakening in a state, leading to a minimum capacity for self-learning. Education is one of the important needs of life.Education is considered as a
key indicator of human development and progress . Education is the most important pre-requisite for achieving the goals of personal, social, political, economic, and cultural development. In other words, education is the most effective instrument for meeting the challenges that dalits are facing. Education is the most important element for the development of human being. So, vast inequalities exist within the education system in India.Historical evidences in this regard indicate that Dalit community has been excluded from the whole process of education since centuries. In comparison to other developed countries our literacy percentage is not so satisfactory. Giving importance to education the framers of our constitution included it in the Directive principles of state policy provisions for free and compulsory education up to the age of 14 years for all children and for promotion and special care of educational and economic interest of the weaker sections of the people, and in particular of the Scheduled Castes and Scheduled Tribe and their protection from social injustice and forms of exploitation. Scheduled caste consist nearly 17% (2011) of the total population of our country.The last two decades have spelt the decline of the Welfare State under the powerful impact of global economic forces and neo-liberal economic policies. The egalitarian ethic underlying planned change and development is being rapidly decimated. The ideology of the Indian State’s New Economic Policy emphasizes the pre-eminence of markets and profits. In the context of an elite directed consensus on the inevitability of liberalisation and structural adjustment, the predominant problems and debates of education have undergone major shifts. Structural adjustment have provided the legitimacy and impetus for a number of educational reforms that pose a direct threat to the mission of universalising elementary education and equalising educational opportunity for SC/ST, especially those left behind. The state is withdrawing from social sectors of education and health and delegating its social commitments and responsibilities to private agencies and non-governmental organizations.
chances of vast sections of those who have yet to make the shift to first generation learning. Literacy and educational attainment level are considered as significant factors influencing the socio-economic development of any society. The quality of human society can be judged through educational attainment level. Literacy and educational attainment are fundamental features of social uplift of a region. The traits of modern society such as urbanisation, industrialisation, and modernisation are closely associated with the level of literacy and education. The scheduled caste population is socially a backward class in Indian society. In the past they were downtrodden illiterate people of the Indian fabric. Even in the middle part of twentieth century the literacy rate among them was very low.
2.Review of Literature
Shah (1982) in his book “The Educational Problems of Scheduled castes and Scheduled Tribe School and college Students in India” tried to examine various programmes and problems for the educational development of the scheduled castes and scheduled tribes in the country. RafiqueAlam (1998) in his study suggested that in view of diverse societal and ecological conditions, the problem of deprivation and enrichment in India has to be tackled in a different manner. Scheduled Castes should be trained to be become more active and aspiring so that they themselves may be able to procure the enriching facilities for better quality of life.
Sankaran (1998) in his study analyzed the development of different groups/castes among the Scheduled Castes in Andhra Pradesh. He also analyzed the movements going on between mala and madiga communities in the State regarding categorization of the Scheduled Castes to breakdown the total reservation available for the Scheduled Castes as a whole into proportionate allotment to different groups among the Scheduled Castes particularly between malas and madigas. Madigas are in favour of categorization, while malas are against categorization of Scheduled Castes. Mala and madiga are the dominant communities within the Scheduled Castes in Andhra Pradesh. He stated that the madigas are somewhat more backward and are lagging behind compared to the malas in terms of the space occupied in the services and in higher education and in terms of other socio-economic indicators. However, both malas and madigas are bound together by their common suffering.
Chatterjee (2000) in his study entitled „Educational
Development of Scheduled Castes Looking Ahead‟
described the constitutional provisions for educational development for scheduled castes (S.Cs.) literacy, special facilities for educational advancement of the SCs, advancement of SCs in higher education, educational inequalities, and reservation for SCs in educational institutions and educational development and social integration. In his book he highlighted on enrolment ratio, disparities among SCs in the educational attainments, eradication of child labour and effect of education on marriage of SCs. Maurya (2001) found that in spite of various protective, promotive and developmental measures initiated by the government for the social and economic upliftment of scheduled castes, the target groups are not able to overcome the age old deprivation of caste system. The problem of illiteracy, poverty, unemployment, malnutrition, social oppression, and atrocities are still haunting the dalits in Indian society.
3. Aims and Objectives
The study of the pattern of literacy among various social groups of scheduled castes in the study area provides an insight into the socio-economic situations. An attempt has been made in this paper to analyse the variation and pattern of literacy among the scheduled caste population. The main objectives are as follows:
(1) To study the spatio-temporal analysis of literacy levels of Scheduled caste
(2) To study the present educational status of scheduled caste
(3) To study the differential levels of literacy with others
4. Methodology: The Main data source is from secondary data, taken from various Govt. and Non govt. organizations like; Census of India, Directorate of Economics and Statistics, DISE, SSA etc.
5. Study Area: Telangana is the 29th state of India, formed on the 2nd of June 2014. The state has an area of 1,14,840Sq Km and has a population of 3,52,86,757. The Telangana region was part of the Hyderabad state from Sept 17th 1948 to Nov 1st 1956, until it was merged with Andhra state to form the Andhra Pradesh state.
5.1 Literacy and Educational level
not necessary that a person should have received any formal education.
The State of Telangana with a literacy rate of 66.46% has 207.84 lakh literates, of which 117.49 lakh are males
and 90.35 lakhs females. In terms of proportions the literacy rate stands at 74.95% for males and 57.92% for females.
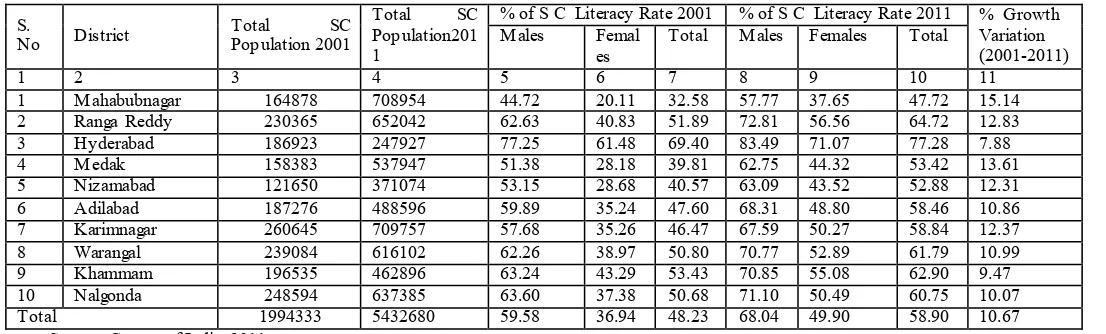
Table 1. District wise SC’s Literacy Rate in Telangana
S.
No District Total Population 2001 SC
Total SC Population201 1
% of S C Literacy Rate 2001 % of S C Literacy Rate 2011 % Growth Variation (2001-2011) Males Femal
es
Total Males Females Total
1 2 3 4 5 6 7 8 9 10 11
1 Mahabubnagar 164878 708954 44.72 20.11 32.58 57.77 37.65 47.72 15.14
2 Ranga Reddy 230365 652042 62.63 40.83 51.89 72.81 56.56 64.72 12.83
3 Hyderabad 186923 247927 77.25 61.48 69.40 83.49 71.07 77.28 7.88
4 Medak 158383 537947 51.38 28.18 39.81 62.75 44.32 53.42 13.61
5 Nizamabad 121650 371074 53.15 28.68 40.57 63.09 43.52 52.88 12.31
6 Adilabad 187276 488596 59.89 35.24 47.60 68.31 48.80 58.46 10.86
7 Karimnagar 260645 709757 57.68 35.26 46.47 67.59 50.27 58.84 12.37
8 Warangal 239084 616102 62.26 38.97 50.80 70.77 52.89 61.79 10.99
9 Khammam 196535 462896 63.24 43.29 53.43 70.85 55.08 62.90 9.47
10 Nalgonda 248594 637385 63.60 37.38 50.68 71.10 50.49 60.75 10.07
Total 1994333 5432680 59.58 36.94 48.23 68.04 49.90 58.90 10.67
Source: Census of India, 2011
According to 2011 Census, percentage of SC literates, (who can read and write with understan ding) aged 7 years and above is 58.90 per cent, which is lower than 66.46 per cent reported for the state population as a whole, which is also lower than 74.04 per cent recorded at the national level. The literacy data show that the SC population of the st ate has made a significant improvement during the decade 2001-2011. The literacy rate, table1 which was 48.2 per cent in 2001, has increased by 32.4 percent in 2011. The female literacy rate of 49.9 per cent among SC population is lower compared to the total females of the state (57.92 per cent) as well their male counterparts (68.04 per cent).
Out of total literates, 54.9 per cent are literates having attained educational level below the Primary level. The literates, who have attained education up to Primary and Middle levels, constitute 32 per cent and 10.6 per cent respectively. 17.8 per cent are having educational level up to Matric/Higher Secondary etc. levels, implying that every 6th SC literate is a Matriculate. The table 3 shows that the drop out is conspicuous after the primarily level and again after Metric/Secondary levels. This pattern is consistent among all the major SCs. Population in the age group 5-14 years are the potential students. 72.8 per cent of the SC children of Telangana in this age group have been attending various educational institutions. Mahabubnagar district is a drought prone and highly outgoing migration population has the highest dropout rate in the state with 57.02 percent followed by Medak with 50.44 percent.The girl dropo ut is more in the secondary levels as compared with the primary levels. Karimnagar and Khammam have the lowest Girl dropout rate in the state of Telangana with 27.16 and 33.86 respectively.
Fig.1 SC’s Gross Enrolment ratio among 2011 Fig.2 Literacy rate among SC’s 2011
Fig.4 Growth Variation among SC’s 2001-2011
Table 2. Gross Enrolment Ratio of Scheduled Caste in Classes I-X S.No
District
Gross Enrolment Ratio 2011
Classes I-V Classes I-VII Classes I-X
1 Mahabubnagar 122.87 90.70 69.87
2 Ranga Reddy 152.92 142.95 112.43
3 Hyderabad 111.01 100.00 76.73
4 Medak 115.94 97.73 80.26
5 Nizamabad 109.39 95.13 81.43
6 Adilabad 125.59 98.30 75.62
7 Karimnagar 93.46 95.27 87.86
8 Warangal 105.54 98.40 84.97
9 Khammam 98.88 92.28 71.35
10 Nalgonda 102.43 90.16 78.84
Source: Commissioner and Directorate of School Education, Hyderabad-2011 5.2 SCHOOL EDUCATION
One of the primary goals for human development as identified by the UNDP Millennium Development Goals (MDG’s) is ‘Education for All’ which is enshrined in Article 21A of the Constitution of India. Education is a fundamental right post the 93rd Constitutional Amendment in 2009. In order to achieve this goal, need exists for ensuring access to education, gender parity in school enrolment, overall enrolment and retention and the quality of education being imparted. To effectively implement this constitutional mandate, elementary education in India is brought under the ‘SarvaSikshaAbhiyaan’ (SSA) which seeks to universalize elementary education. Similarly, secondary education has been brought under the flagship programme ‘RashtriyaMadhyamikSikshaAb hiyaan’ (RMSA).
Table 3. Dropout Rates of Scheduled Caste in Classes I-X S.No
District
Scheduled Caste Drop-out Rate 2011
Classes I-V Classes I-VII Classes I-X
1 Mahabubnagar 35.26 45.55 57.02
2 Ranga Reddy 21.59 24.91 32.75
3 Hyderabad 19.05 30.90 41.30
4 Medak 30.83 38.99 50.44
5 Nizamabad 14.26 22.90 36.07
6 Adilabad 27.21 36.01 43.86
7 Karimnagar 15.89 23.41 27.16
8 Warangal 27.64 39.17 47.04
9 Khammam 14.40 21.95 33.86
10 Nalgonda 30.19 36.51 45.17
Source: Commissioner and Directorate of School Education, Hyderabad- 2011 Mid-Day Meal Scheme
The Government of India is supporting the scheme for supply of mid -day meal to students of Classes I-VIII, and the State Government extended the scheme with their own funds for classes IX and X. The State Government is also providing Egg / Banana twice a week to improve the nutritional standards of the students. Mid -Day Meal is being served with superfine ne rice to all the students in the state. 30.44 lakh students were covered under the Mid-Day Meal scheme during 2014-15. SarvaShikshaAbhiyan
SarvaShikshaAbhiyan (SSA) aims at providing useful and relevant Elementary Education for all children in the age group of 6 to 14. SSA intends to bridge social, regional and gender gaps, with the act ive participation of the community in the management of schools with a funding pattern of 65:35 for the year 2014-15.
Table 4. Dropout Rates of Scheduled Caste in Classes I-X S.No
District
Scheduled Caste Drop-out Rate 2011
Classes I-V Classes I-VII Classes I-X
1 Mahabubnagar 35.26 45.55 57.02
2 Ranga Reddy 21.59 24.91 32.75
3 Hyderabad 19.05 30.90 41.30
4 Medak 30.83 38.99 50.44
5 Nizamabad 14.26 22.90 36.07
6 Adilabad 27.21 36.01 43.86
7 Karimnagar 15.89 23.41 27.16
8 Warangal 27.64 39.17 47.04
9 Khammam 14.40 21.95 33.86
10 Nalgonda 30.19 36.51 45.17
Fig.4 Map showing Gross Enrolment ratio among SC Fig.5 Map showing Drop out ratio among SC
5.3 Literacy Rate – Scheduled Castes Vs. General
The data on decadal growth rate in literacy rate of the Scheduled Castes and general population from 1961 to 2011 is presented in Table 5. It is evident from the data that the Scheduled Castes literacy is 8.47 per cent in 1961 against the general literacy rate of 21.19 per cent. The SC literacy rate was increased to 10.65 in 1971, while the general literacy rate was 24.57. It is increased to 17.65 in 1981, whereas general literacy rate is 29.94. Thus, there is a little percentage increase in SC population literacy rate in 1981. In 1991, SC literacy rate is 31.59, whereas general literacy rate is 44.09.
Thus, there is a considerable increase in SC literacy rate from 17.65 per cent in 1981 to 31.59 per cent in 1991. There is further significant increase in the SC literacy rate during 2001-2011 decade. By 2011, SC literate rate stands at 58.90, while general literacy rate stands at 66.46. Therefore, it is inferred from the data that during the past four decades, the literacy rate of Scheduled Castes is steadily increased. Comparatively, it seems that there is a faster growth in literacy ra te among SCs than general population.
Table 5 Literacy rate among Social groups
Sl. no Social
Group
1961 1971 1981 1991 2001 2011
Male Female Total Male Female Total Male Female Total Male Female Total Male Female Total Male Female Total
1 SC 13.43 3.4 8.47 15.9 5.3 10.65 24.8 10.25 17.65 41.88 20.92 31.59 63.51 43.35 53.52 68.04 49.90 58.90
2 ST 7.26 1.48 4.41 8.47 2.12 5.34 12.02 3.46 7.82 25.52 8.68 17.16 47.66 26.11 37.04 59.49 39.44 49.51
Results and Conclusion:
The analysis of literacy and educational levels of Scheduled Caste in Telangana shows that there is still lot of gap is there when compared with the other castes. With the initiatives of the state government the following could be achieved
• Around 38 new primary schools opened during 2014-15 in school-less habitations. • About 22, 41,785 children were provided 2 sets of uniforms.
• About 99.4% schools are implementing the Mid-day meal scheme, thereby placing the State ofTelangana at 2nd position in the national level.
• Teacher-Pupil Ratio (TPR) has improved and is as per norms at 1:29 at the Class I-V level, 1:24 at the Class I-VII/VIII level, 1: 39 at the class I- XII level.
• About 98.4% schools in the State have functioning School Management Committees.
• Around 52,947 out of school children were given special training for mainstreaming them into regular schools.
REFERNCES
1. Andhra Pradesh Human Development Report, “Marginalised Sections in Andhra Pradesh”, Chapter X, 2007.
2. Census of India, “State of Literacy (Chapter 7), Provisional Population Totals”, Series 1, India, Paper 1 of 2001, 2001.
3. Narayan Mishra (2001), ‘Scheduled Castes Education – Issues and Prospects’, Kalpaz Publications, Delhi 4. Census of India, “Provisional Population Total, Population by Residence- Persons”, Series 1, India, Paper 1 of
2011, 2011.
5. B. N. Ghosh, “Fundamentals of Population Geography’’ Sterling Publisher Private Limited, New Delhi. Pp. 133, 1985.
6. L. T. Ruzicha and T. Kanitkar “Infant Mortality in an Urban Setting, The Case Of Grater Bombay”, K. V. Vaidyanathan (ED.) Studies In
7. S. B. Sawant and A. S. Athawale “Population Geography”, Mehta Publishing House, Pune, Pp.118-119, 1991.
8. www.censusindia.org.in
9. www.education.nic.in