71
Abstract— Longer lead time in small and medium enterprises results in direct impact on delivering the project at the stipulated time period, hence resulting in more costs involved. The reason for the delay in the lead time is because of the various ‗waste‘ factors which can be analyzed by using Failure Mode Effective Analysis (FMEA). The paper discusses on the steps used in FMEA right from listing of potential failure modes to taking necessary actions in eliminating or reducing the high-risk failure modes.
IndexTerms— Longer Lead Time; Smaller and Medium
Enterprises (SMEs); Waste; Failure Mode.
I. INTRODUCTION
As per the definition the ―Lead time‖ refers to the time required for the organization in delivering the order being placed by the customer. The ―Longer Lead Time‖ is delay in delivering the order placed by the client. The reason for the longer lead time is because of various factors:
A. Handoffs
When the requirement flows from one batch to another batch, it flows in the forms of queues. During batch flow the information flows between various departments. The delay in sending information from one batch will lead to delay in receiving the information in another. As a result it will lead to longer lead time, the solution to this is to have an automated approach also to make batches work in parallel so as to save time and hence delivering the order within the stipulated time period.
B. Approval Process
The SMEs handling larger projects, the most important factor here is sharing of the data. The lack of data sharing between the departments leads to the complexity hence resulting in approval process being near to impossible for the delivery tea9m. Thus there is a need of usage of automated tool known as the Jira tool, which is a repository for storing all the codes developed by different departments.
Manuscript revised May 13, 2019 and published on June 5, 2019 Aditya Pai H, Assistant Professor, Department of CSE, K.S. Institute of Technology, Bangalore, India
Sameena H S, Assistant Professor, Department of CSE, Global Academy of Technology, Bangalore, India
Sandhya Soman, Assistant Professor, Department of CSE, KristuJayanti College, Bangalore, India
Dr. Piyush Kumar Pareek, Associate Professor, Department of CSE, East West Institute of Technology, Bangalore, India
C. Environment Management and Provisioning
The development team requires a platform where new feature can be tested. Lack of availability of such environment leads to delay in addressing the problems with different versions of the software. For example, there is a version control software which is a repository of storing multiple versions of the software. The version control provides access the different versions of the code and thus reducing the complexity between various versions of software code.
D. Deployments of the software manually
The deployment of the software manually are prone to errors as it is difficult to handle the large code manually. Thus there is a need of reliable of automated process like Jira tool where different modules of codes are integrated in the common platform.
E. Manual Software Testing
It is always better to have code tested automatically that is in case of the project of huge scale. If manually tested the amount of bug detected is less and amount of investment done will be huge. If automatically tested using automated testing tools like Selenium, we will be to test the code at faster rate and amount of bugs detected will be more.
II. LITERATURE SURVEY
According to the paper by Baiqiao Huang et.al. [1] - it aims at classifying failure modes in the database first one being the general failure and the second being the special failure. The Failure mode databases is one of the prominent analysis techniques for workers analyzing FMEA, where it makes process not only software operate but also improves the efficiency. [6] [7] [8]
According to the paper by Peter L. Goddard [2] - it shows the methods that allows to assess the behavior of the software process. The paper also explains the use of fault tolerant platform. The author of the paper has successfully explained the Failure Mode Effective Analysis in the automotive platforms using brakes etc. The same concept has applied in the Software to find out the hardware failure causing failure of the software operation.
According to John B. Bowles et.al. [3] -The paper explains how FMEA can be effectively used in the embedded chip with not hardware protection. To begin with functionality of the system is being described, followed by the software modules and its interfaces. That is an interface
Analysis of Causes and Effects of Longer Lead Time in
Software Process Using FMEA
between hardware and software. In the end FMEA is done to analyses the cause and effect of the software variables used.
According to Nathaniel Ozarin et.al. [4] - The paper explains how FMEA is performed on the software where there are many errors related to electronic hardware. The author explains the accuracy of the FMEA reduces as there is movement of analysis from lowest level to highest level. Lowest Level are the method to module level coding, highest level is the package level coding. The accuracy level for the package level coding is less when compared to the method level coding.
According to Dong Nguyen et.al. [5] The paper presents very appropriate method of providing solution the problem of causes and effects of the waste using FMEA. This approach provides every information that is required for causing the failure and its effect on the software system in everysoftware process. FMEA also checks for what are the possible failures that are going to occur at each stage in the software process. The author also explains what are the corrective actions need to be taken. [9] [10].
III. RESULTS ON FAILURE MODE EFFECTIVE ANALYSIS
Adopting FMEA - With usage of FMEA used in the three software development firms to assess the Software Development Life Cycle (SDLC). During the course of the cycle nine steps were being followed:
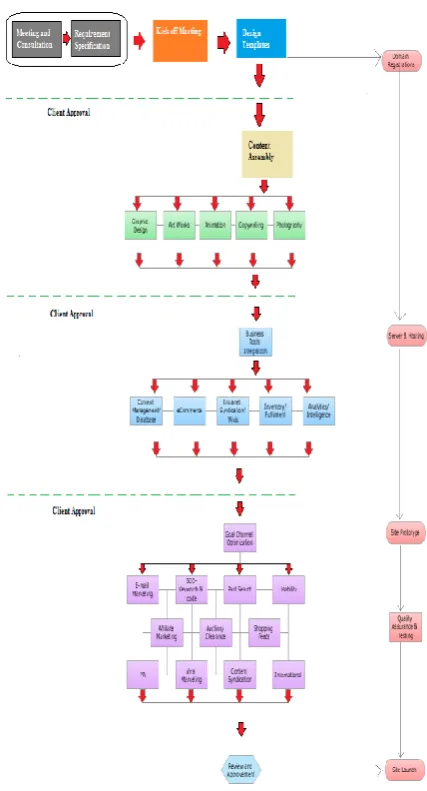
The first step is the process review –To begin with the software team had assessed the complete SDLC to give FMEA team the thorough knowledge of the project development done on the web application. The following Figure 1 shows the step by step analysis of the software development process for the web application.
Figure 1: Step by step analysis for web application development.
73
1. Finding out what are the potential failure modes –
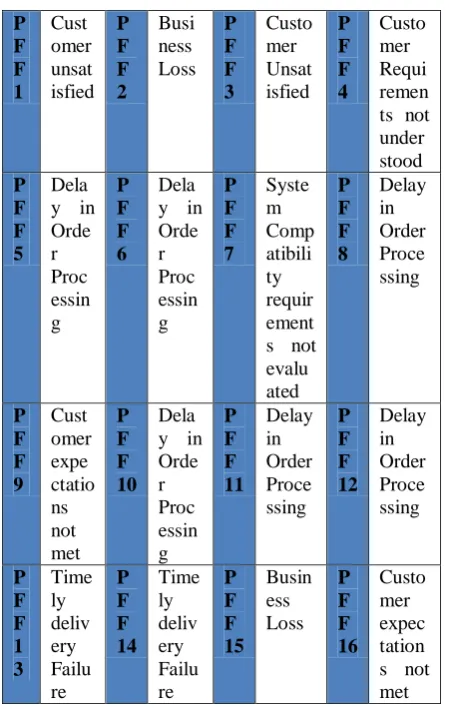
Once the team understand about the software process, the team members started analyzing the causes of the potential failure and that which could influence the software process and its quality. After the rigorous brainstorming session the result of team members expressed the potential failure modes as shown in Table 1
Table 1: Potential Failure Modes for the following codes
Code PotentialFailureForm
PFF1 Requirements defined pending
PFF2 Number of actual requirements and the addressed requirement is different PFF3 Number of errors fixed versus no of errors
pending
PFF4 The actual number of units coded,tested is less than those tested at the execution stage
PFF5 The number of unittesting pending
PFF6 The number of testing stage that was used
PFF7 The total number of errors being after testing
PFF8 Lack of understanding the requirement by the developers from the client
PFF9 Number of errors being rectified or fixed by the developers
PFF10 What are the gaps between every process
PFF11 Technical Skill of the customer is weak
PFF12 Increase in the requirements
PFF13 Lack of knowledge required for current technology
PFF14 Market and technological opportunities not translated into requirement
PFF15 The Defects of the software listed at one instances listed in the later stages. PFF16 Lack of end user participation
What are the impacts for each potential failures caused– As shown in the Table 1 which shows different
potential failure modes, where each failure modes are grouped and assessed for the potential impacts from the existing failure which is shown in the Table 2 below
Table 2: Effects for each failure modes
P given as per the Table 3 below:
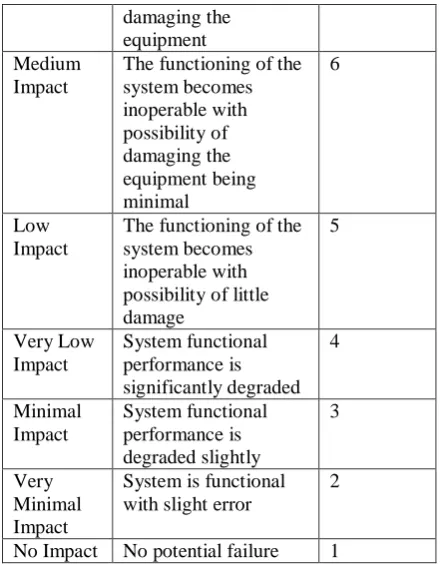
Table 3: Potential Failure Severity Ranking Nature of
the failure impact
The severity of the failure
Rated very high in the severity index as the impact of the failure effects the function of the safe system without warning
10
Dangerous with warning
Severity wise is less effective but still hazardous as it effects the functioning of the safe system with a warning.
9
Impact very high
The functioning of the system is not operable causing destructive failure and not compromising the safety
8
High Impact
The functioning of the system becomes inoperable with possibility of
damaging the equipment Medium
Impact
The functioning of the system becomes inoperable with possibility of damaging the equipment being minimal
6
Low Impact
The functioning of the system becomes inoperable with possibility of little damage
5
Very Low Impact
System functional performance is significantly degraded
4
Minimal Impact
System functional performance is degraded slightly
3
Very Minimal Impact
System is functional with slight error
2
No Impact No potential failure 1
Based on the Table 3, the Figure 2 showing the Pie Chart, ranking severity for each failure is done.
Figure 2: The Severity of Failure
As shown in the Figure 2, the potential failure forms PFF8, PFF13 has severity ranking 4 which means it is very low impact. The potential failure forms PFF1, PFF6, PFF11, PFF12 has severity ranking 5 which means low impact. The potential failure forms PFF3, PFF7, PFF9, PFF10, PFF14, PFF16 has severity ranking 6 which means medium impact. The potential failure forms PFF4, PFF16 has severity ranking 7 which means high impact. The potential failure forms PFF2, PFF5 has severity ranking 8 which means very high impact
Ranking for Occurrences of each Failure – The ranking is done based on the Table 4, which signifies how likely the failure is occurred frequently. The Figure 3 shows the ranking of occurrences of each failure.
Table 4: Frequency of Failure Occurred Ranking Nature of the
failure impact
The severity of the failure Rank ing Very
Hazardous
Rated very high as the failure is occurred frequently leading to failure in system
functionality without warning.
10
Hazardous Rated very high as the failure is occurred frequently leading to failure in system
functionality with warning. 9
Very high occurrences
The functioning of the system is not operable causing destructive failure and not compromising the safety
8
High occurrences
The functioning of the system becomes inoperable with possibility of damaging the equipment
7
Medium occurrences
The functioning of the system becomes inoperable with possibility of damaging the equipment being minimal
6
Low occurrences
The functioning of the system becomes inoperable with possibility of little damage
5
Very low occurrences
System functional
performance is significantly degraded
4
Minimal occurrences
System functional performance is degraded slightly
3
Very Minimal occurrences
System is functional with slight error
2
No
occurrences
No potential failure occurrences
1
Figure 3: The Occurrences of Failure
From the above Figure 3, the occurrences of the failure forms for PFF11 is 4 which means very low. The occurrences
75 failure forms of PFF6, PFF13 is 6 which means medium. The
occurrences of the failure forms of PFF1, PFF2, PPF4, and PFF7 is 7 which means high. The occurrences of the failure forms of PFF3, PFF5, and PFF15 is 8 which means very high.
To identify the ranking for each failure rates – The ordering of the failure is done based by giving ranking to each of the failure modes on the Table 5. As per the Figure 4, the detection of failure mode ranking is shown
Table 5: Frequency of Failure Identified Ranking Nature of the
failure impact
The Identification of the failure
Ran kin g Very
Hazardous
Rated very high as the failure is detected
frequently leading to failure in system functionality without warning.
10
Hazardous Rated very high as the failure is detected
frequently leading to failure in system functionality with warning.
9
Very highlydetecte d
The functioning of the system is not operable causing destructive failure and not compromising the safety
8
Highlydetect ed
The functioning of the system becomes inoperable with possibility of
damaging the equipment 7
Medium detected
The functioning of the system becomes inoperable with possibility of
damaging the equipment being minimal
6
Low detected The functioning of the system becomes inoperable with possibility of little damage
5
Very low detected
System functional performance is significantly degraded
4
Minimal detected
System functional performance is degraded slightly
3
Very Minimal detected
System is functional with slight error
2
Not detected No potential failure detected
1
Figure 4: Detection of the Failure Modes Ranking
From the above Figure 4, the detection of the failure forms PFF3, PFF10, PFF13 is 3 which means minimal. The detection of the failure forms PFF1, PFF11, PFF14, and PFF16 is 4 which means very low. The detection of the failure forms PFF2, PFF4, PFF5, PFF7, and PFF12 is 5 which means low. The detection of the failure forms PFF6, PFF8 is 6 which means medium. The detection of the failure forms PFF9, PFF15 is 7 which means high.
The summary of the ranking for Potential Failure Modes in terms of Occurrences, Severity and Detection is shown in Table 6
Table 6: Summary of Ranking of each Potential Failure Modes in terms of severity, occurrences and detection
Potentia l Failure Forms
Failure Severity Index
Failure Occurr
ence Index
Detection of the Potential
Failure Index
PFF1 7 5 4
PFF2 7 8 5
PFF3 8 6 3
PFF4 7 7 5
PFF5 8 8 5
PFF6 6 5 7
PFF7 7 6 5
PFF8 5 4 6
PFF9 5 6 7
PFF10 5 6 3
PFF12 5 5 5
PFF13 6 4 3
PFF14 5 6 4
PFF15 8 6 7
PFF16 5 7 4
Calculating the priority of the risks for each failure modes –To calculate this we use need to find out The Risk
Precedence Index(RPI) is calculated by
RPI= Severity of the FailureIndex x Occurrence of the FailuresIndex x Detection of the Potential Failure Index
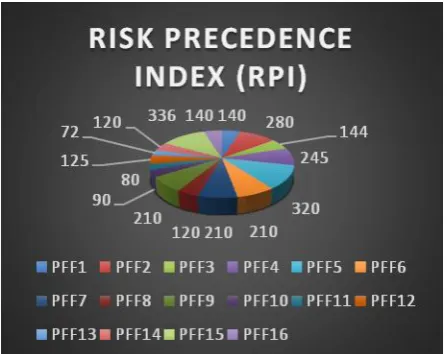
The following Table 7 and Figure 5 shows the Risk Precedence Index for each failure modes
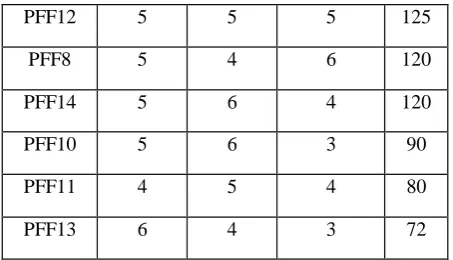
Table 7: Risk Precedence Index Calculation for each potential failure.
Potential Failure
Forms
RPI
PFF1 140
PFF2 280
PFF3 144
PFF4 245
PFF5 320
PFF6 210
PFF7 210
PFF8 120
PFF9 210
PFF10 90
PFF11 80
PFF12 125
PFF13 72
PFF14 120
PFF15 336
PFF16 140
Figure 5: Risk Precedence Index Calculation for each Failure Modes/ Forms
From the above Figure 5, The Risk Precedence Index for PFF1 is 140, PFF2 is 280, PFF3 is 144, PFF4 is 245, PFF5 is 320, PFF6 is 210, PFF7 is 210, PFF8 is 120, PFF9 is 210, PFF10 is 90, PFF11 is 80, PFF12 is 125, PFF13 is 72, PFF14 is 120, PFF15 is 336 and PFF16 is 140.
Prioritize the Failure Forms for Action – Based on the highest Risk Priority Index (RPI) the potential failure forms are being prioritized. As per the Table 8 the highest priority listed to potential failure forms/ modes that is the failure with highest risk to lowest risk is sequenced as
follows – PF15, PF5, PF2, PF4, PF6, PF7, PF9, PF3, PF1, PF16, PF12, PF8, PF14,PF10, PF11, PF13. Table 8 shows the prioritizing of the potential failure forms based on RPI.
Table 8: Priority of Potential Failure Forms based on RPI
Potenti al Failure Forms
Severity of the FailureI ndex
Occurr ence of
the Failure
Index
Detection of the Potential
Failure Index
RPI
PFF15 8 6 7 336
PFF5 8 8 5 320
PFF2 7 8 5 280
PFF4 7 7 5 245
PFF6 6 5 7 210
PFF7 7 6 5 210
PFF9 5 6 7 210
PFF3 8 6 3 144
PFF1 7 5 4 140
77
PFF12 5 5 5 125
PFF8 5 4 6 120
PFF14 5 6 4 120
PFF10 5 6 3 90
PFF11 4 5 4 80
PFF13 6 4 3 72
Take Necessary Action to eliminate the high risk rate – As shown in Table 9 we tried to eliminate the high risk failure modes either completely or reduce to certain extent. Ideally it is not possible to eliminate the risk for all the potential failure modes/forms.
Table 9: Necessary action to eliminate high risk failure forms
Problems SuggestedActions
Pendingtargets Shows the details that are slowing the process. The errors that are found are needed to be fixed and then it is allowed to go the next stage. If there is any irregularity while collecting the data. Then the interview with the client must be stopped and ensure the right data is being collected. Once collected the data needs to be analyzed for practical applicability.
Highnumber ofdetailchang esgotversusn umberfinishe d
As the software process is Agile, which is incremental in nature, with each increments there are prerequisites that stops the advancements of the process. Thus whole process must be split into two Sprints
Moreorlessere rrorsintesting
The outcome of the Tests produces wrong results. An experienced tester ensures that each module is tested to accuracy of the outcomes and regular re-testing are done to ensure the outcome is accurate.
Number of errors being rectified or fixed by the developer
It is a necessary that the staffs who are being involved in the project have worked on the requirement will eventually do the testing and must report the errors to the developers to fix it.
IV. CONCLUSION
The Failure Mode Effective Analysis is technique in which we will be able to know from the potential failures caused during development process and its effects towards the system. As mentioned in this paper from the Table 1 we mentioned what are the Potential Failure Modes identified for the particular development project. With the order of ranking we found out the severity, occurrences and detection of the defects, from which we have prioritized the risk using RPI because of which it was possible as to what caused delay in the lead times or the longer lead time being caused in the software development process as mentioned in Table 2 to 8. To this suggested action is being provided to the problems listed in Table 9. From this we can conclude that although we have prioritized the risks for the potential failure modes, it is not always possible to eliminate high risk failures for all the potential problems.
REFERENCES
[1] Baiqiao HUANG, Hong ZHANG and Minyan LU, "Software FMEA Approach Based on Failure Modes Database",8th International Conference on Reliability, Maintainability and Safety, July 2009. [2] P.L. Goddard, Software FMEA Techniques. Annual Reliability and
Maintainability Symposium, 2000.
[3] J.B. Bowles, and C. Wan, ―Software Failure Modes and Effects Analysis For a Small Embedded Control System,‖ Proceedings Annual Reliability and Maintainability symposium, 2001.
[4] N. Ozarin, ―Failure Modes and Effects Analysis during Design of Computer Software,‖ RAMS, 2004.
[5] Dong Nguyen et.al. "Failure modes and effects analysis for software reliability", Annual Reliability and Maintainability Symposium. 2001 Proceedings. International Symposium on Product Quality and Integrity (Cat. No.01CH37179), Jan. 2001.
[6] W. Dong, J. Wang, C.Z. Zhao, X. Zhang, and J. Tian, ―Automating software FMEA via formal analysis of dependence relations,‖ Annual IEEE International Computer Software and Application Conference,2008.
[7] N. Ozarin, ―The Role of Software Failure Modes and Effects Analysisfor Interfaces in Safety-and Mission-Critical Systems,‖ IEEEInternational Systems Conference, 2008.
[8] B. Wu, and R.Z. Tang, ―Study on software FMEA technology,‖ Mechanical and Electrical Engineering Magazine, Vol.21, No.3.753, 2004.
[9] AmljotHoyland and Marvin Rausand, ―Sysfem Reliability Theov‖, John Wiley & Sons, Inc., pp 73-80, 1994