Translation Quality Indicators for Pivot-based Statistical MT
Michael Paul and Eiichiro Sumita
National Institute of Information and Communications Technology MASTAR Project
Kyoto, Japan
Abstract
Recent research on multilingual statisti-cal machine translation focuses on the us-age of pivot languus-ages in order to over-come resource limitations for certain lan-guage pairs. This paper provides new in-sights into what factors make a good pivot language and investigates the impact of these factors on the overall pivot transla-tion performance. Pivot-based SMT ex-periments translating between 22 Indo-European and Asian languages were used to analyze the impact of eight factors
(lan-guage family, vocabulary, sentence length, language perplexity, translation model en-tropy, reordering, monotonicity, engine performance) on pivot translation
perfor-mance. The results showed that 81% of system performance variations can be ex-plained by these factors.
1 Introduction
The translation quality of statistical machine trans-lation (SMT) approaches heavily depends on the amount and coverage of bilingual language re-sources available to train the statistical models. There exist several data collection initiatives1 amassing and distributing large amounts of tex-tual data. For frequently used language pairs like
French-English, large text data sets are readily
available. However, for less frequently used lan-guage pairs only a limited amount of bilingual re-sources are available, if any at all.
In order to overcome language resource limita-tions, recent research on SMT focuses on the us-age of pivot languus-ages (de Gispert and Marino, 2006; Utiyama and Isahara, 2007; Wu and Wang, 2007; Bertoldi et al., 2008). Instead of a direct translation between two languages where only a
1LDC: http://www.ldc.upenn.edu, ELRA: http://www.elra.info
limited amount of bilingual resources is available, the pivot translation approach makes use of a third language that is more appropriate due to the avail-ability of more bilingual corpora and/or its relat-edness towards either the source or the target lan-guage. For most recent research efforts, English is the pivot language of choice due to the richness of available language resources. However, recent re-search on pivot translation has shown that the us-age of non-English pivot languus-ages can improve translation quality for certain language pairs (Paul et al., 2009; Leusch et al., 2010).
Concerning the contribution of aspects of differ-ent language pairs on the quality of machine trans-lation, (Birch et al., 2008) identified three features (morphological complexity, amount of reordering,
historical relatedness) for predicting success of
MT in translations between the official languages of the European Union. Moreover, (Koehn et al., 2009) investigated an additional feature
(transla-tion model complexity) using the JRC-Aquis
cor-pus covering not only Indo-European languages, but also one semitic and three Finno-Ugric lan-guages.
This paper differs from previous research in the following aspects: we focus on the frame-work of pivot translation, where a target language translation of a source language input is obtained through an intermediate (pivot) language, inves-tigate what factors make a good pivot language and what impact these factors have on the overall translation quality of language pairs not only in-cluding Indo-Euopean languages, but also a large variety of Asian languages. In Section 2, we report on pivot-based SMT experiments translat-ing between 22 Indo-European as well as Asian languages in order to provide new insights into how much language diversity affects the transla-tion performance of pivot translatransla-tion approaches. In Section 3, eight factors (language family,
vo-cabulary, sentence length, language perplexity,
translation model entropy, reordering, monotonic-ity, engine performance) are investigated to
deter-mine the significance of each factor in predicting translation quality using linear regression analysis.
2 Pivot Translation
Pivot translation is a translation from a source
lan-guage (SRC) to a target lanlan-guage (TRG) through an intermediate pivot (or bridging) language (PVT). Within the SMT framework, various coupling strategies like cascading, phrase-table
composi-tion, and pseudo-corpus generation have been
pro-posed. For the experiments reported in this pa-per, we utilized the cascading approach because it is computational less expensive, but still per-forms comparably well compared to the other, more sophisticated pivot translation approaches. Pivot translation using the cascading approach re-quires two translation engines where the first en-gine translates the source language input into the pivot language and the second engine takes the obtained pivot language output as its input and translates it into the target language. Given N lan-guages, a total of 2*N*(N-1) SMT engines have to be built in order to cover all N*(N-1)*(N-2) SRC-PVT-TRGlanguage pair combinations.
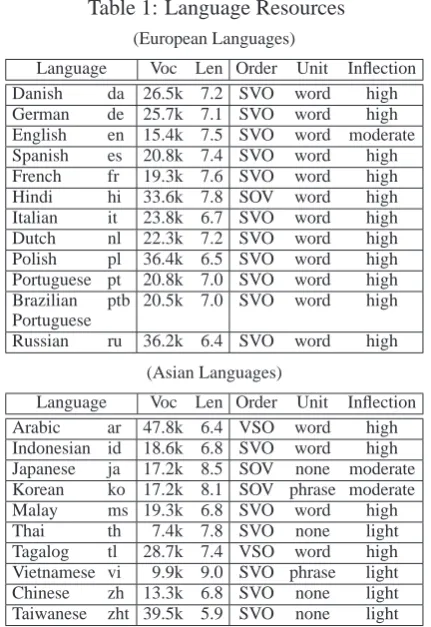
The importance of translation quality factors in pivot translation are investigated using the multilingual Basic Travel Expressions Corpus (BTEC), which is a collection of sentences that bilingual travel experts consider useful for peo-ple going to or coming from another country (Kikui et al., 2006). The sentence-aligned cor-pus consists of 160k sentences pairs covering 22 Indo-European and Asian languages which be-long to a variety of language families including
Germanic (da,de,en,nl), Romance (es,fr,it,pt,ptb), Slavic (pl,ru), Indo-Iranian (hi), Semitic (ar), Aus-tronesian (id,ms,tl), Tai (th), Mon-khmer (vi), and Sinitic (zh,zht) languages. The corpus statis-tics are summarized in Table 1, where Voc specifies the vocabulary size and Len the aver-age sentence length of the respective data sets. These languages differ largely in word order (Order: subject-object-verb (SOV), subject-verb-object (SVO), verb-subject-subject-verb-object (VSO)), segmen-tation unit (Unit: phrase, word, none), and de-gree of inflection (Inflection: high, moderate, light). Very similar characteristics can be seen for Indo-European languages and for certain sub-sets of Asian languages (ja, ko; id, ms). In
addi-Table 1: Language Resources (European Languages)
Language Voc Len Order Unit Inflection Danish da 26.5k 7.2 SVO word high German de 25.7k 7.1 SVO word high English en 15.4k 7.5 SVO word moderate Spanish es 20.8k 7.4 SVO word high French fr 19.3k 7.6 SVO word high Hindi hi 33.6k 7.8 SOV word high Italian it 23.8k 6.7 SVO word high Dutch nl 22.3k 7.2 SVO word high Polish pl 36.4k 6.5 SVO word high Portuguese pt 20.8k 7.0 SVO word high Brazilian ptb 20.5k 7.0 SVO word high Portuguese
Russian ru 36.2k 6.4 SVO word high
(Asian Languages)
Language Voc Len Order Unit Inflection Arabic ar 47.8k 6.4 VSO word high Indonesian id 18.6k 6.8 SVO word high Japanese ja 17.2k 8.5 SOV none moderate Korean ko 17.2k 8.1 SOV phrase moderate Malay ms 19.3k 6.8 SVO word high
Thai th 7.4k 7.8 SVO none light
Tagalog tl 28.7k 7.4 VSO word high Vietnamese vi 9.9k 9.0 SVO phrase light Chinese zh 13.3k 6.8 SVO none light Taiwanese zht 39.5k 5.9 SVO none light
tion, Indo-European languages have, in general, a higher degree of inflection compared to Asian lan-guages. Concerning word segmentation, the cor-pora were preprocessed using language-specific word-segmentation tools for languages that do not use white-space to separate word/phrase tokens (ja,ko,th,zh,zht). For all other languages, simple tokenization tools were applied. All data sets were case-sensitive with punctuation marks preserved.
The language resources were randomly split into three subsets for the evaluation of translation quality (eval, 1000 sentences), the tuning of the SMTmodel weights (dev, 1000 sentences) and the training of the statistical models (train). However, in a real-world application, identical language re-sources covering three or more languages are not necessarily to be expected. In order to avoid a trilingual scenario for the pivot translation exper-iments, the train corpus was randomly split into two subsets of 80k sentences each, whereby the first set of sentence pairs was used to train the SRC-PVT translation models and the second sub-set of sentence pairs was used to train thePVT-TRG translation models. In total, 924 SMT translation engines were built to cover all 9,240 language pair combinations.
Table 3: Oracle Pivot Translation Quality (BLEU)
Table 2: Pivot Language Dependency (European Languages) (Asian Languages)
word alignment (Och and Ney, 2003) and lan-guage modeling (Stolcke, 2002) tools were used. Minimum error rate training (MERT) was used to tune the decoder’s parameters, and was per-formed on the dev set using the technique pro-posed in (Och and Ney, 2003). For the trans-lation, an in-house multi-stack phrase-based
de-coder was used. For the evaluation of translation quality, we applied the standard automatic eval-uation metricBLEU which calculates the geomet-ric mean of n-gram precision by the system out-put with respect to reference translations multi-plied by a brevity penalty to prevent very short candidates from receiving too high a score. Scores range between 0 (worst) and 1 (best) (Papineni et al., 2002). For our experiments, single translation references were used.
Table 2 summarizes theBLEUscore ranges of all pivot translation experiments obtained for a given pivot language. The results show a large varia-tion in BLEU scores for all pivot languages indi-cating that the best pivot choice largely depends on the respective source and target language. For European pivot languages, the best language com-bination scores are in general much higher than the ones obtained for Asian pivot languages.
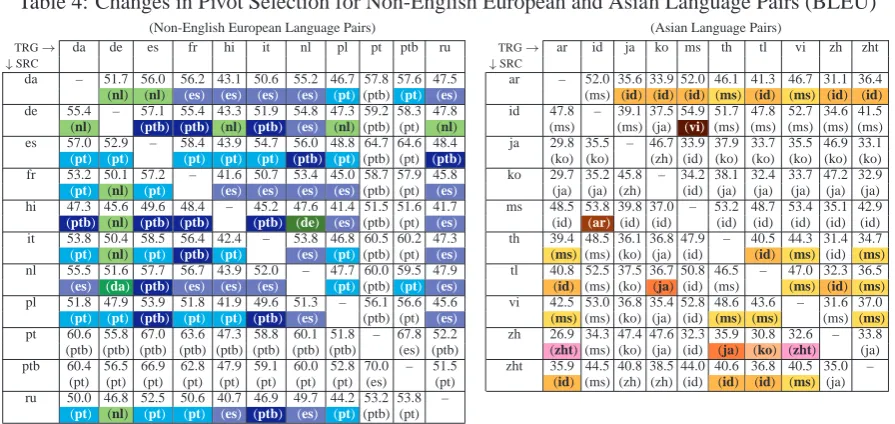
Table 4: Changes in Pivot Selection for Non-English European and Asian Language Pairs (BLEU)
(Non-English European Language Pairs) (Asian Language Pairs)
TRG→ da de es fr hi it nl pl pt ptb ru TRG→ ar id ja ko ms th tl vi zh zht
↓SRC ↓SRC
da – 51.7 56.0 56.2 43.1 50.6 55.2 46.7 57.8 57.6 47.5 ar – 52.0 35.6 33.9 52.0 46.1 41.3 46.7 31.1 36.4 (nl) (nl) (es) (es) (es) (es) (pt) (ptb) (pt) (es) (ms) (id) (id) (id) (ms) (id) (ms) (id) (id) de 55.4 – 57.1 55.4 43.3 51.9 54.8 47.3 59.2 58.3 47.8 id 47.8 – 39.1 37.5 54.9 51.7 47.8 52.7 34.6 41.5 (nl) (ptb) (ptb) (nl) (ptb) (es) (nl) (ptb) (pt) (nl) (ms) (ms) (ja) (vi) (ms) (ms) (ms) (ms) (ms) es 57.0 52.9 – 58.4 43.9 54.7 56.0 48.8 64.7 64.6 48.4 ja 29.8 35.5 – 46.7 33.9 37.9 33.7 35.5 46.9 33.1
(pt) (pt) (pt) (pt) (pt) (ptb) (pt) (ptb) (pt) (ptb) (ko) (ko) (zh) (id) (ko) (ko) (ko) (ko) (ko) fr 53.2 50.1 57.2 – 41.6 50.7 53.4 45.0 58.7 57.9 45.8 ko 29.7 35.2 45.8 – 34.2 38.1 32.4 33.7 47.2 32.9
(pt) (nl) (pt) (es) (es) (es) (es) (ptb) (pt) (es) (ja) (ja) (zh) (id) (ja) (ja) (ja) (ja) (ja) hi 47.3 45.6 49.6 48.4 – 45.2 47.6 41.4 51.5 51.6 41.7 ms 48.5 53.8 39.8 37.0 – 53.2 48.7 53.4 35.1 42.9
(ptb) (nl) (ptb) (ptb) (ptb) (de) (es) (ptb) (pt) (es) (id) (ar) (id) (id) (id) (id) (id) (id) (id) it 53.8 50.4 58.5 56.4 42.4 – 53.8 46.8 60.5 60.2 47.3 th 39.4 48.5 36.1 36.8 47.9 – 40.5 44.3 31.4 34.7
(pt) (nl) (pt) (ptb) (pt) (es) (pt) (ptb) (pt) (es) (ms) (ms) (ko) (ja) (id) (id) (ms) (id) (ms) nl 55.5 51.6 57.7 56.7 43.9 52.0 – 47.7 60.0 59.5 47.9 tl 40.8 52.5 37.5 36.7 50.8 46.5 – 47.0 32.3 36.5
(es) (da) (ptb) (es) (es) (es) (pt) (ptb) (pt) (es) (id) (ms) (ko) (ja) (id) (ms) (ms) (id) (ms) pl 51.8 47.9 53.9 51.8 41.9 49.6 51.3 – 56.1 56.6 45.6 vi 42.5 53.0 36.8 35.4 52.8 48.6 43.6 – 31.6 37.0
(pt) (pt) (ptb) (pt) (pt) (ptb) (es) (ptb) (pt) (es) (ms) (ms) (ko) (ja) (id) (ms) (ms) (ms) (ms) pt 60.6 55.8 67.0 63.6 47.3 58.8 60.1 51.8 – 67.8 52.2 zh 26.9 34.3 47.4 47.6 32.3 35.9 30.8 32.6 – 33.8 (ptb) (ptb) (ptb) (ptb) (ptb) (ptb) (ptb) (ptb) (es) (ptb) (zht) (ms) (ko) (ja) (id) (ja) (ko) (zht) (ja) ptb 60.4 56.5 66.9 62.8 47.9 59.1 60.0 52.8 70.0 – 51.5 zht 35.9 44.5 40.8 38.5 44.0 40.6 36.8 40.5 35.0 –
(pt) (pt) (pt) (pt) (pt) (pt) (pt) (pt) (es) (pt) (id) (ms) (zh) (zh) (id) (id) (id) (ms) (ja) ru 50.0 46.8 52.5 50.6 40.7 46.9 49.7 44.2 53.2 53.8 –
(pt) (nl) (pt) (pt) (es) (ptb) (es) (pt) (ptb) (pt)
the highest scores (oracle pivot) for translating the source (S) language into the target (T) language are given in parantheses. Non-English oracle pivot languages are highlighted in boldface. The figures show that the English pivot approach still achieves the highest scores for the majority of the exam-ined language pairs. However, in 49.8% (230 out of 462) of the cases, a non-English pivot language, mainly Portuguese, Brazilian Portuguese, Malay,
Indonesian, Japanese, Korean, is preferable. For
languages that are closely related like Portuguese vs. Brazilian Portuguese and Malay vs. Indone-sian, the related language should be chosen as the pivot language when either translating from or into the respective language for 88.7% (71 out of 80) and 85.0% (68 out of 80) of the privot translation experiments, respectively. Moreover, Japanese is the dominant pivot language when translating from Korean into an other language (95.0%, 19 out of 20) , but not for the translation into Korean (30.0%, 6 out of 20). These results suggest that in general pivot languages closely related to the source language have a larger impact on the overal pivot translation quality than pivot languages re-lated to the target language.
Interestingly, for European-only language pairs, only European languages are the oracle pivot lan-guage, the majority of which is English. In ad-dition, Spanish is the pivot language of choice when translating from English into another Eu-ropean language and the Dutch pivot achieved the highest BLEU scores for Germanic-only lan-guage pairs. On the other hand, when translat-ing between Asian languages, 65.6% (59 out of 90) of the oracle pivot languages are Asian
guages. The Spanish (Chinese) oracle pivot lan-guages for translations between Portuguese and Brazilian Portuguese (Japanese and Korean) also stresses the importance of language relatedness.
In order to investigate the dependency of pivot language selection and language families further, Table 4 summarizes theBLEUscores of pivot trans-lations between only (a) non-English European and (b) Asian language pairs. The results of the European-only language pairs in the table on the left confirm the findings of Table 3. Portuguese and Brazilian Portuguese are still the dominant pivot languages for non-English European lan-guage pairs. An increase of Spanish/Dutch oracle pivot language pairs can be seen for the transla-tion between only Romance/Germanic languages, respectively. Similarly, Malay and Indonesian are the dominant pivot languages, followed by Japanese and Korean, for Asian-only language pairs, most of which achieve BLEU scores that are only slightly lower than the ones for the En-glish oracle pivot language experiments reported in Table 3.
Table 5 summarizes the percentages for the lan-guage pairs where the respective pivot lanlan-guage achieved the highest automatic evaluation score for the pivot translation experiments summarized in Table 3 (all language pairs) and Table 4 (non-English European language pairs, Asian language pairs). The results show that English is indeed the pivot language of choice for the majority of the investigated translation directions, but for almost half of the language pairs a non-English pivot lan-guage is preferable.
Table 5: Oracle Pivot Language Distribution
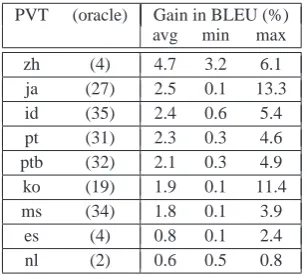
Table 6: Gain of non-English Pivot Languages
PVT (oracle) Gain in BLEU (%) avg min max
in pivot translation performance can be achieved by using non-English pivot languages instead of an English pivot, we calculated the difference in BLEU scores for all 188 non-English language pairs where the non-English pivot language im-proved translation quality. Table 6 summarizes the average, minimal and maximal gains in BLEU scores for the respective pivot language translation experiments. The pivot languages are sorted ac-cording to the highest average increase in transla-tion performance and the amount of improved lan-guage pairs are given in parantheses. In total, an average gain of 2.2 BLEU points were obtained for the investigated language pairs. The highest gains (13.4/11.4 BLEU points) were achieved for the Japanese/Korean pivots when translating Ko-rean/Japanese into Chinese, respectively.
3 Indicators of Pivot Translation Quality
The diversity of the pivot language selection re-ported in the last section rises the question of what makes a language a good pivot language for a given language pair.
We investigated the following eight factors (comprised of a total of 45 distinct features) based on the language resources andSMTengines (SRC-PVT, PVT-TRG) used for the pivot translation ex-periments described in Section 2 where the total number of features of each factor is given in brack-ets. For SMT-engine-related features, both trans-lation directions (SRC-PVT, PVT-TRG) are taken into account.
• language family [2]: a binary feature verifying whether
the source and target languages of the SMT engines belong to the same family or not.
• vocabulary [15]: the training data vocabulary size
of source and target languages, the ratio of source and target vocabulary sizes, and the overlap between source and target vocabulary.
• sentence length [12]: the average sentence length of
source and target training sets and the ratio of source and target sentence length.
• reordering [6]: the amount and span of word order
differences (reordering) in the training data and the
Reordering Quantity score as proposed in (Birch et al.,
2008).
• language perplexity [4]: perplexity of the utilized language models measured on the dev/eval data sets.
• translation model entropy [2]: amount of uncertainty
involved in choosing candidate translation phrases as proposed in (Koehn et al., 2009).
• engine performance [2]: the BLEU scores of the respective SMT engine used for the pivot translation experiments.
• monotonicity [2]: the BLEU score difference of a
given SMT engine for decoding with and without a reordering model.
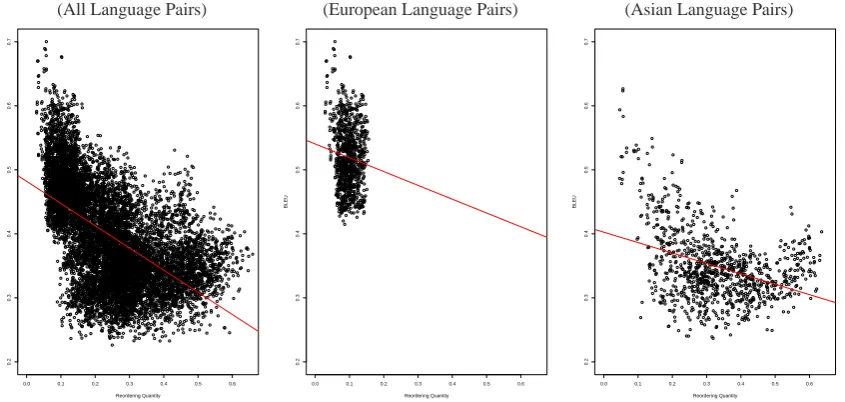
The impact of the above factors in isolation on the translation performance is measured using lin-ear regression which models the relationship be-tween a response variable and one or more ex-planatory variables. Data sets are modeled using linear functions and unknown model parameters are estimated from the data. In this paper, the response variable is defined by the BLEU metric (measuring the pivot translation performance) and the explanatory variables are given by the feature values obtained for each of the respective language pair combinations. Figure 1 gives an example for a simple linear regression using the reordering
quantity feature as the explanatory variable for (a)
(All Language Pairs)
0.0 0.1 0.2 0.3 0.4 0.5 0.6
0.2
0.3
0.4
0.5
0.6
0.7
Reordering Quantity
BLEU
(European Language Pairs)
0.0 0.1 0.2 0.3 0.4 0.5 0.6
0.2
0.3
0.4
0.5
0.6
0.7
Reordering Quantity
BLEU
(Asian Language Pairs)
0.0 0.1 0.2 0.3 0.4 0.5 0.6
0.2
0.3
0.4
0.5
0.6
0.7
Reordering Quantity
BLEU
Figure 1: Linear Regression Example (Reordering Quantity)
fit” of the explanatory variable(s) is calculated us-ing theR2 coefficient of determination, which is a statistical measure of how well the regression line approximates the real data points. An R2 of 1.0 indicates that the regression line perfectly fits the data. For the translation model entropy factor, for example, we obtain an R2 of 0.4604 for all lan-guage pairs, which indicates that 46.04% of the differences in translation performance can be ex-plained by this factor.
3.1 Predictive Power of Single Factors
Table 7 summarizes the R2 scores of the multi-ple linear regression analysis of the respective in-vestigated factors, i.e. all features of a given fac-tor are combined and treated as multiple explana-tory variables. In total, 81% of the system per-formance variations can be explained when all in-vestigated factors are taken into account. For Eu-ropean language pairs, the impact is even larger (91%). However, for Asian language pairs, the in-vestigated factors have much less correlation (R2
of 0.5888) with the overall pivot translation trans-lation quality, indicating the difficulty of selecting an appropriate pivot language for translation tasks including Asian languages.
The impact of each factor on the translation per-formance is also given in Table 7. The results show that engine performance is the most corre-lated factor, followed by translation model entropy and reordering when all language combinations are taken into account. Language family and
lan-guage perplexity seems to have the least impact on
translation performance. However, when applying linear regression on language subsets (only
Euro-Table 7: Impact on Translation Performance
Explanatory R2
Variable All European Asian
all factors 0.8102 0.9106 0.5880
engine performance 0.7438 0.7906 0.5151 translation model entropy 0.4604 0.3669 0.1661 reordering 0.4383 0.4593 0.1806 vocabulary 0.3112 0.3867 0.2389 monotonicity 0.2682 0.0149 0.1323 sentence length 0.1717 0.6052 0.0724 language family 0.1204 0.1280 0.0982 language perplexity 0.0826 0.1100 0.0337
pean vs. only Asian languages), the impact of fac-tors largely differs. Similar to all language pairs, the engine performance factor is most relevant for both European and Asian language subsets.
For pivot translations between European lan-guages, sentence length, reordering and
vocabu-lary are more predictive than the translation model entropy factor. Moreover, the monotonicity factor
obtains the lowest R2 score indicating that word order differences between European languages oc-cur mainly on the phrase-level (local reordering) and that only minor gains can be achieved when reordering successive phrases. The high R2 score for sentence length also suggests that the ratio of sentence length is an important feature when se-lecting an appropriate pivot language for closely related languages.
On the other hand, looking at the Asian lan-guage pair regression results, the lowerR2 scores underline the large diversity between the Asian languages. Relatively highR2 scores for
lan-Table 8: Factor Contribution
Explanatory R2
Variable All European Asian
all factors 0.8102 0.9106 0.5880
w/o engine performance 0.5621 0.8755 0.3683 w/o language perplexity 0.7734 0.8895 0.5488 w/o sentence length 0.7856 0.8989 0.5501 w/o reordering 0.7958 0.8999 0.5712 w/o vocabulary 0.7961 0.8766 0.5669 w/o translation model entropy 0.8004 0.9024 0.5748 w/o monotonicity 0.8026 0.9024 0.5768 w/o language family 0.8035 0.9022 0.5793
guages, indicating that structural differences be-tween the pivot language and the source/target lan-guage largely affects the overal pivot translation quality.
3.2 Contribution of Single Factors
Besides the predictive power of each factor, we calculated theR2scores of all the factors besides one (leave-one-out) in order to investigate the con-tribution of each factor to the multiple linear re-gression analysis. In general, the smaller the R2
score after omitting a given factor, the larger the contribution of this factor on the explanation of the overall translation performance is supposed to be. The results summarized in Table 8 show that the largest contribution for all language pairs is obtained for the engine performance factor, fol-lowed by language perplexity and sentence length. Interestingly, the vocabulary factor contributes as much as the engine performance factor for Euro-pean languages, but not for Asian languages. This confirms that morphological similarities between highly inflected languages are important to iden-tify an appropriate pivot language. Moreover, for European-only and Asian-only language pairs, the omission of any of these factors led to lower R2
scores, but the difference towards the complete factor set is much smaller. This shows the impor-tance of all the investigated features for the task of pivot language selection, especially if languages of large diversity are to be taken into account.
3.3 Translation Direction Dependency
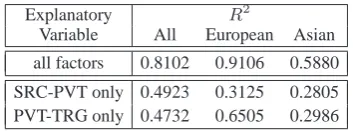
In order to investigate whether the selection of a pivot language depends more on its relation-ship towards the source language or the target lan-guage, we carried out a linear regression anal-ysis based on all factors using (a) only source-language-related features (SRC-PVT only) and (b)
Table 9: Source vs. Target Language Dependency
Explanatory R2
Variable All European Asian
all factors 0.8102 0.9106 0.5880
SRC-PVT only 0.4923 0.3125 0.2805 PVT-TRG only 0.4732 0.6505 0.2986
only target-language-related features (PVT-TRG
only). The results are summarized in Table 9.
In order to distinguish between languages of large diversity, the source language features seem to be more predictive than the target language features. However, for more coherent language pairs, like in the case of European languages, the impact on how much language diversity af-fects pivot translation performance shifts towards target-language-related features. However, the re-striction to either the source or the target features leads to a large decrease in the R2 scores for all language data sets, underlining the importance of both source-language-related and target-language-related feature sets to identify an appropriate pivot language for a given language pair.
4 Conclusion
lan-guage for new lanlan-guage pairs largely depends on the availability of structurally similar languages.
As future work, we are planning to investigate the importance of the factors analyzed in Section 3 in the selection of pivot languages for new lan-guage pairs by applying a machine learning al-gorithm like Support Vector Machines (SVM) to train discriminative models for the task of pre-dicting a pivot language that achieves the high-est translation performance for a given translation task.
References
Nicola Bertoldi, Madalina Barbaiani, Marcello Fed-erico, and Roldano Cattoni. 2008. Phrase-Based Statistical Machine Translation with Pivot Languages. In Proceedings of the 5th
Interna-tional Workshop on Spoken Language Translation (IWSLT), pages 143–149, Hawaii, USA.
Alexandra Birch, Miles Osborne, and Philipp Koehn. 2008. Predicting success in machine translation. In
Proceedings of the Conference on Empirical Meth-ods in Natural Language Processing (EMNLP),
pages 745–754, Honolulu, Hawaii.
Adria de Gispert and Jose B. Marino. 2006. Catalan-english statistical machine translation without par-allel corpus: bridging through spanish. In
Pro-ceedings of 5th International Conference on Lan-guage Resources and Evaluation (LREC), pages 65–
68, Genoa, Italy.
Genichiro Kikui, Seiichi Yamamoto, Toshiyuki Takezawa, and Eiichiro Sumita. 2006. Comparative study on corpora for speech translation. IEEE Transactions on Audio, Speech and Language,
14(5):1674–1682.
Philipp Koehn, Alexandra Birch, and Ralf Steinberger. 2009. 462 Machine Translation Systems for Europe. In Proceedings of the Machine Translation Summit
XII, Ottawa, Canada.
Gregor Leusch, Aur´elien Max, Josep Maria Crego, and Hermann Ney. 2010. Multi-Pivot Translation by System Combination. In Proceedings of 7th
Inter-national Workshop on Spoken Language Translation (IWSLT), pages 299–306, Paris, France.
Franz Josef Och and Hermann Ney. 2003. A System-atic Comparison of Various Statistical Alignment Models. Computational Linguistics, 29(1):19–51.
Kishore Papineni, Salim Roukos, Todd Ward, and Wei-Jing Zhu. 2002. BLEU: a Method for Automatic Evaluation of Machine Translation. In Proceedings
of the 40th Annual Meeting of the Association for Computational Linguistics (ACL), pages 311–318,
Philadelphia, USA.
Michael Paul, Hirofumi Yamamoto, Eiichiro Sumita, and Satoshi Nakamura. 2009. On the Impor-tance of Pivot Language Selection for Statistical Machine Translation. In Proceedings of the North
American Chapter of the Association for Computa-tional Linguistics - Human Language Technologies (NAACL/HLT), pages 221–224, Boulder, USA.
Andreas Stolcke. 2002. SRILM - an extensible lan-guage modeling toolkit. In Proceedings of the 7th
International Conference on Spoken Language Pro-cessing (ICSLP), pages 901–904, Denver.
Masao Utiyama and Hitoshi Isahara. 2007. A com-parison of pivot methods for phrase-based statisti-cal machine translation. In Proceedings of Human
Language Technologies (HLT), pages 484–491, New
York, USA.
Hua Wu and Haifeng Wang. 2007. Pivot
Lan-guage Approach for Phrase-Based Statistical Ma-chine Translation. In Proceedings of 45th Annual
Meeting of the Association for Computational Lin-guistics (ACL), pages 856–863, Prague, Czech