Editor’s key points
} Despite knowledge that reducing inappropriate antibiotic use is important to decrease resistance, meaningful physician behaviour change has remained difficult to achieve.} The findings suggest that a substantial amount of variability in antibiotic prescribing among physicians remains unexplained by observed factors, and might be more strongly related to individual practice styles. Efforts to measure prescriptions, and to target physicians with higher propensities to prescribe, might be the most promising interventions.
} There might be a potential benefit from focusing on physicians who have been in practice longer and on internationally trained physicians, as they were more likely to prescribe antibiotics for pediatric respiratory tract infections.
Antibiotic prescribing
for pediatric respiratory
infections
What explains a large variation among physicians?
Rachel McKay PhD David M. Patrick MD FRCPC MHScKimberlyn McGrail PhD Michael R. Law PhD
Abstract
Objective To explore whether there are observable physician characteristics associated with antibiotic prescribing for pediatric respiratory tract infections (RTIs).
Design Population-based cohort study using a hierarchical generalized linear mixed-model analysis.
Setting British Columbia.
Participants All pediatric visits for RTIs between 2005 and 2011.
Main outcome measures The association between an antibiotic prescription being dispensed within 5 days after each visit and patient, physician, and regional characteristics.
Results Overall, 27.9% of RTI visits were followed by an antibiotic prescription. After accounting for observed patient, physician, and regional factors, median 2-fold variation was found across physicians in their odds of prescribing. Observable physician characteristics explained nearly half of the variation between them. Higher prescribing was evident among physicians with more years of clinical experience (odds ratio [OR] of 1.46, 95% CI 1.33 to 1.61), international medical graduates (OR = 1.73, 95% CI 1.63 to 1.83), and physicians with proportionally fewer recent visits for RTIs (OR = 1.45, 95% CI 1.38 to 1.52). Female physicians prescribed less often than male physicians did (OR 0.91, 95% CI 0.86 to 0.96).
Résumé
Objectif Examiner s’il existe, chez les médecins, des caractéristiques observables associées à la prescription d’antibiotiques pour des infections pédiatriques des voies respiratoires (IVR).
Type d’étude Études de cohortes dans la population au moyen d’une analyse des modèles mixtes linéaires généralisés et log-linéaires hiérarchiques.
Contexte Colombie-Britannique.
Participants Toutes les visites pédiatriques pour une IVR entre 2005 et 2011.
Principaux paramètres à l’étude L’association entre une ordonnance d’antibiotiques exécutée dans les 5 jours suivant chaque visite, et les caractéristiques du patient, du médecin et de la région.
Résultats Dans l’ensemble, une ordonnance d’antibiotiques était prescrite à la suite de 27,9 % des visites pour une IVR. Après avoir tenu compte des facteurs observés chez le patient, le médecin et la région, une variation médiane du double a été cernée chez les médecins dans la probabilité qu’ils rédigent une ordonnance. Des caractéristiques observables des médecins ont expliqué près de la moitié de la variation entre eux. Un taux plus élevé de prescription était évident chez les médecins comptant plus d’années d’expérience clinique (rapport de cotes [RC] de 1,46, IC à 95 % de 1,33 à 1,61), chez les diplômés en médecine de l’étranger (RC = 1,73, IC à 95 % de 1,63 à 1,83), de même que chez les médecins qui avaient reçu proportionnellement moins de visites récentes pour une IVR (RC = 1,45, IC à 95 % de 1,38 à 1,52). Les femmes médecins prescrivaient moins souvent que leurs homologues masculins (RC = 0,91, IC à 95 % de 0,86 à 0,96).
Conclusion Des variations considérables ont été observées entre les médecins quant à laprescription d’antibiotiques pour une IVR pédiatrique. Une proportion significative de cette variation est attribuable à des caractéristiques observables; toutefois, certains médecins ont une plus forte propension à prescrire que d’autres, ce qui demeure inexpliqué. Les caractéristiques des patients et des régions n’ont pas permis d’expliquer cette variation entre les médecins. À l’avenir, des interventions comportementales devraient être élaborées et évaluées pour cibler les médecins les plus enclins à prescrire.
Points de repère
du rédacteur
} Même si limportance de réduire le recours inapproprié aux antibiotiques pour freiner la résistance est bien connue, il est demeuré difficile de changer le comportement des médecins de manière significative.
} Les constatations de létude font valoir que la variation considérable entre les médecins dans la
prescription dantibiotiques demeure inexpliquée par les facteurs observés, et pourrait être plus fortement liée aux styles de pratique individuels. Des efforts pour mesurer le nombre de prescriptions et pour cibler les médecins plus enclins à prescrire des antibiotiques pourraient se révéler les
interventions les plus prometteuses.
} Il y aurait peut-être lieu de cibler les médecins qui exercent depuis plus longtemps et ceux formés à létranger, car ils ont une plus forte propension à prescrire des
antibiotiques pour une infection des voies respiratoires chez les enfants.
Prescription d’antibiotiques
pour les infections respiratoires
pédiatriques
Pourquoi cette grande variation
entre les médecins?
A
ntibiotic resistance is an important and growing public health issue. Antibiotic use is one of the most important drivers of antibiotic resistance.1 Recent estimates suggest that up to 50% of antibiotic use for respiratory tract infections (RTIs) in children2 and adults3 is likely unnecessary or inappropriate.Prescribing decisions are complex, and there are documented variations in antibiotic prescribing both across medical practice networks4 and across individual physicians5,6 that cannot be fully explained by patients’ clinical presentations. Patient,7 physician,8-10 and geo-graphic11-13 characteristics have been previously associ-ated with antibiotic prescribing, both for RTIs and more generally. However, investigations of these factors with consideration of patient and physician characteristics simultaneously are sparse,5,6 as are studies specifically of children. Given the high rate of potentially inappro-priate prescriptions for this common set of syndromes,2 understanding antibiotic prescribing for pediatric RTIs is important for improvements in practice and policy to support the judicious use of these medicines.
Therefore, we used population-based data to study variations in antibiotic prescribing for children with RTIs to assess which observable physician characteristics are associated with prescribing after controlling for relevant patient and regional variables. In particular, we sought to identify demographic and practice-related character-istics that would help inform the design and targeting of future interventions.
——
Methods
——
Data sources
We used administrative data for all residents of British Columbia (BC).14 Population Data BC provided de- identified data sets with common unique study iden-tifiers attached. We linked data on physician visits,15 prescription drug dispensing,16 hospitalizations,17 and patient14 and physician demographic characteristics.18
Study cohort
We identified all pediatric visits for RTIs between 2005 and 2011 using existing methods.19 We then identified a sub-set of visits for acute syndromes less likely to require an antibiotic prescription: nasopharyngitis, sinusitis, pharyn-gitis, tonsillitis, laryngitis and tracheitis, upper respiratory infections of multiple or unspecified sites, bronchitis or bronchiolitis, viral pneumonia, or influenza (ICD-9 codes 460 to 466, 480, or 487).20 To ensure stability and ade-quate follow-up time, we restricted our cohort to indi-viduals registered with the provincial public insurance program for 275 or more days in each studied year.21
Measurements
Outcome. To determine whether an encounter resulted
in prescribing, we identified the closest prescription
matching both patient and prescriber for an antibiotic (ATC [Anatomic Therapeutic Chemical] code J01) filled within 5 days of a physician visit.
Factors. The selection of factors was informed by
socioecologic frameworks of behaviour,22 health promo-tion models,23 a health services research approach to understanding variations in care,24 and a previous sys-tematic review of factors associated with antibiotic pre-scribing decisions for RTIs.25
Patient level: Patient demographic characteristics included age, sex, and neighbourhood income quin-tile as an indicator of socioeconomic status. As a proxy for patient attachment with the GP, we calculated the proportion of GP visits in the previous 3 years with the same physician as the RTI visit,26 and dichotomized this variable at the median (0.1). We used 2 measures of comorbidity. First, we summed the number of Johns Hopkins Adjusted Clinical Groups System aggregated diagnosis groups as a measure of general comorbidity.27 Second, we identified individuals with 1 of 8 high-risk indications within the past 2 years (≥ 2 physician visits or ≥ 1 hospitalization): asthma, chronic kidney disease, chronic liver disease, chronic obstructive pulmonary dis-ease, congestive heart failure, cystic fibrosis, diabetes, and immunosuppression. Finally, we defined recent anti-biotic users as those with any antianti-biotic prescription in the 6 months before the RTI visit, and follow-up visits as any visit within 14 days of another RTI visit.
Physician level: Physician demographic variables
included sex, place of medical school graduation (Canada vs elsewhere), specialty, and years since medi-cal school graduation. We medi-calculated daily volume as the total number of claims billed on the day of the RTI visit, and frequency of RTI management as the propor-tion and number of visits in the past 30 days and the past year, respectively, with an RTI diagnosis.
Regional level: There are 89 local health areas (LHAs) nested within 5 geographic health authorities in BC. We calculated annual measures of LHA population demo-graphic characteristics, and used meteorologic temper-ature readings assigned to each LHA28 to calculate a 28-day moving average for each visit day.
Statistical analysis
We used generalized linear mixed models to estimate variance parameters for the physician clustering level, and log-odds parameters for the covariates. We randomly selected 1 visit per child to overcome issues of modeling patient-level variation, in line with previous analyses.6
physician-level variables; and finally regional-level vari-ables. All variables were retained in subsequent models, regardless of statistical significance.
We describe the variation in several ways. First, we calculated the intraclass correlation (ICC) according to the latent variable method.30 We also report the median odds ratio (OR), which can be interpreted as the median of the distribution of ORs that could theoretically be obtained by comparing 2 randomly chosen patients (with the same covariate values) from 2 different phy-sicians.29,31,32 Finally, we report the proportion change in the variance as the relative change in the physician-level variance parameter between different models.33
——
Results
——
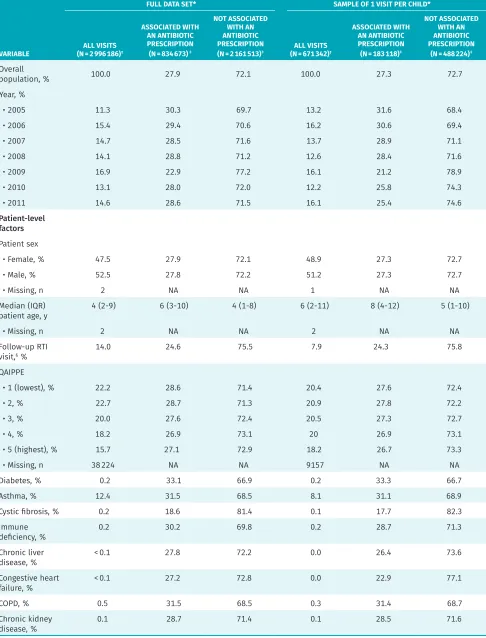
Between 2005 and 2011, we identified about 3 million pediatric RTI visits. Randomly selecting 1 visit per per-son left 671 342 observations, of which 27.3% were asso-ciated with an antibiotic dispensing. Table 1 shows descriptive statistics for both the complete data set and the analytic subset. Half of the visits in the complete data set were with female patients (47.5%), and the median patient age was 4 years (interquartile range [IQR] of 2 to 9). Figure 1 shows overall monthly trends in RTI visits.
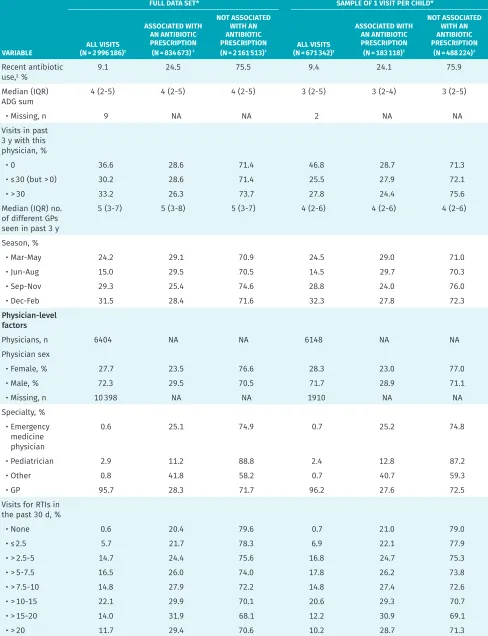
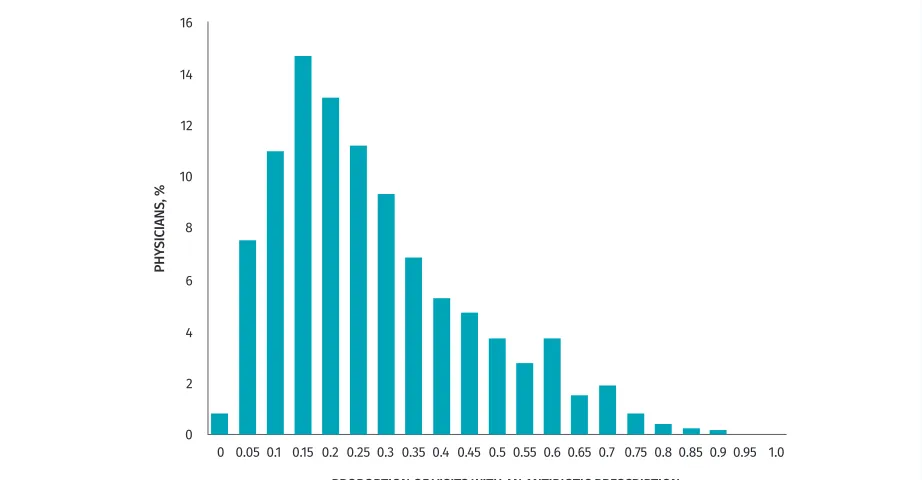
These visits were conducted by 6404 unique physi-cians. In 27.7% of visits the physician was female, 95.7% of visits were with a GP, and across visits, physicians had an average of 22.5 years of experience. In the com-plete data set, 8.2% of practitioners (527 of 6404) never prescribed antibiotics. These practitioners had fewer vis-its overall (median [IQR] 3 [1 to 8]). Figure 2 shows the variation in prescribing rates by physician; the median proportion of visits associated with a prescription was 19.2% (IQR 10.0% to 33.1%).
Model results
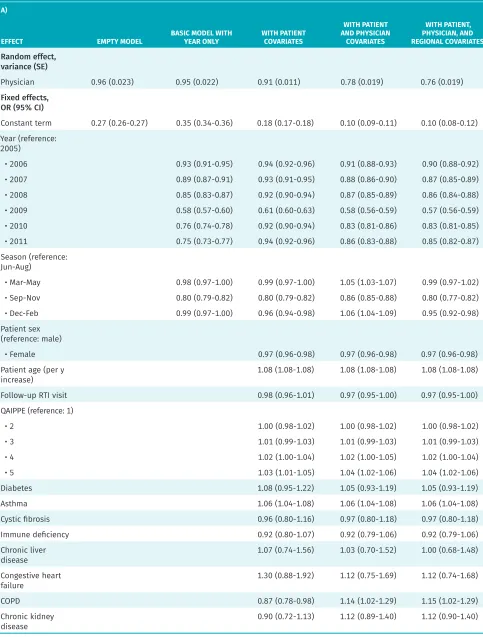
Results of the series of models are presented in Table 2. The final model, with all covariates, was based on 645 094 observations owing to missing data (3.9% of the observations were excluded).
Model variation
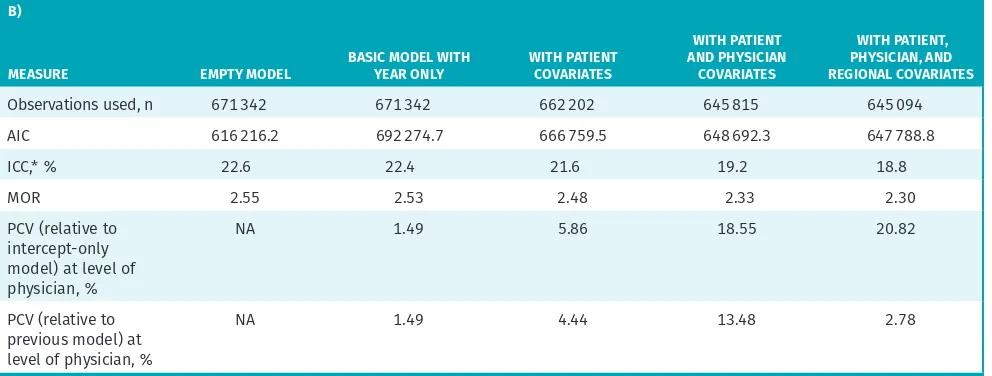
Before accounting for other variables, the ICC was 22.6%, indicating that between-physician differences accounted for nearly one-quarter of the total variation in antibiotic prescribing. Patients seen by higher-prescribing physi-cians had a median 2.55 times higher odds of receiving a prescription compared with peers seen by a lower- prescribing physician.
After adjusting for patient, physician, and regional factors, the between-physician differences (ie, ICC) accounted for 18.8% of the total variation. Patients seen by higher-prescribing physicians had a median 2.30 times higher odds of receiving a prescription compared with peers seen by another physician. We observed the
largest decrease in between-physician variation when the physician-level characteristics were included in the model. Controlling for these characteristics explained nearly one-fifth of the variation attributed to physicians (the proportional change in variance relative to the empty model is 18.55%), whereas controlling for patient-level characteristics only explained 5.96%. The inclusion of a few select regional-level variables, including gross-level geographic indicators, while statistically significant, did not explain much of the physician-level variation. Overall, this suggests that most variation was random (according to the characteristics that we measured), and thus more likely to be driven by individual physician practice styles.
Patient-level factors
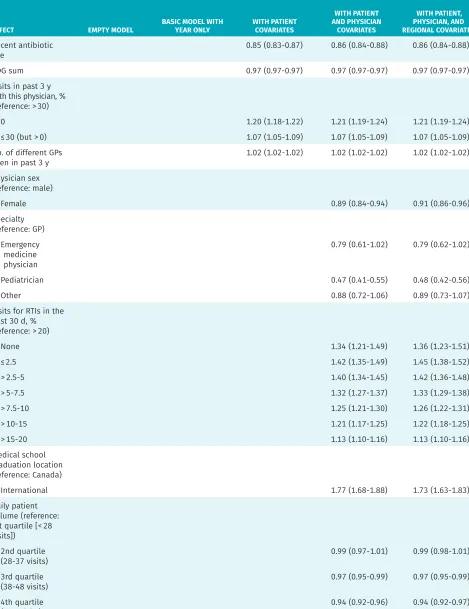
As shown in our final model, having a recent outpa-tient antibiotic prescription (at any time in the past 6 months) was associated with a lower probability of pre-scribing. Older children, and children with asthma or chronic obstructive pulmonary disease, had higher odds of receiving a prescription. A lack of physician familiar-ity was also associated with more prescribing: patients who had less than 30% of their medical visits in the past 3 years with the RTI visit physician had a higher likeli-hood of prescribing (OR = 1.07, 95% CI 1.05 to 1.09), as did those with no documented visits with any provider in the past 3 years (OR = 1.21, 95% CI 1.19 to 1.24).
Clinician-level factors
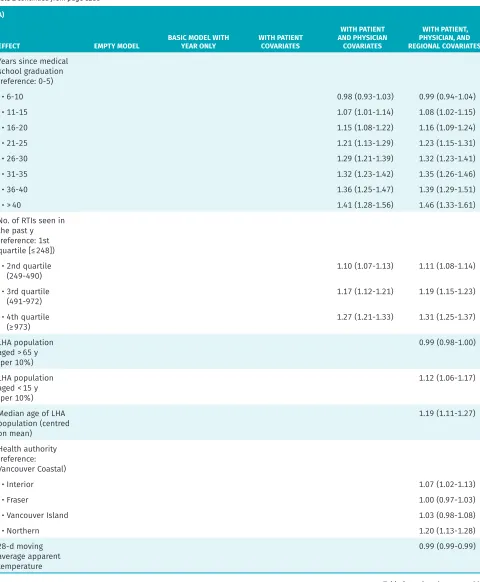
Pediatricians had lower odds of prescribing compared with GPs (OR = 0.48, 95% CI 0.42 to 0.56). Physicians who graduated medical school outside of Canada had 1.73 times greater odds of prescribing (95% CI 1.63 to 1.83). The number of US-trained physicians was small, and grouping them with Canadian graduates did not change the results (data not shown). The number of years in practice was also associated with higher prescribing: physicians with more than 40 years of experience had odds of prescribing 1.46 times higher (95% CI 1.33 to 1.61) than newly graduated physicians had. Finally,
phy-sicians who had seen relatively fewer RTIs in the past 30 days were more likely to prescribe compared with those for whom 20% or more of their visits were coded as RTIs.
——
Discussion
——
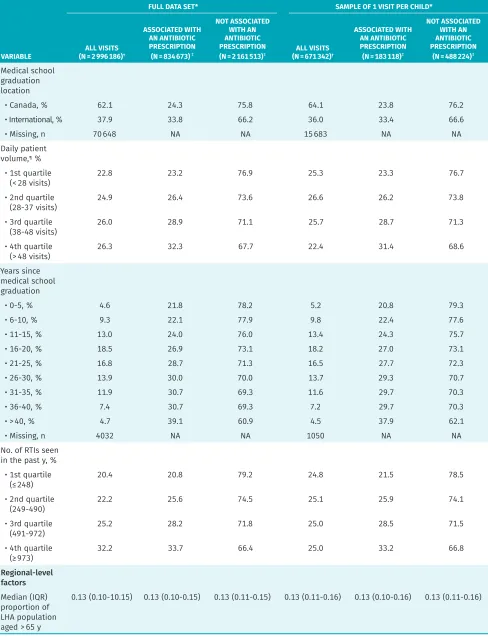
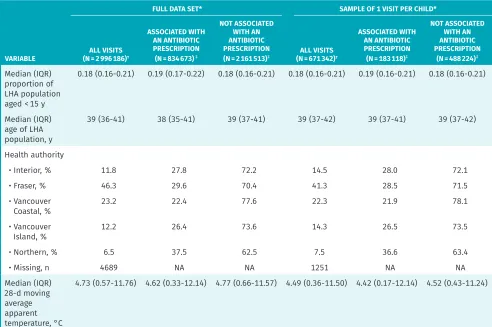
Table 1. Distribution of variables by antibiotic prescription for RTI visits in children
VARIABLE
FULL DATA SET* SAMPLE OF 1 VISIT PER CHILD*
ALL VISITS (N = 2 996 186)†
ASSOCIATED WITH AN ANTIBIOTIC PRESCRIPTION (N = 834 673)‡
NOT ASSOCIATED WITH AN ANTIBIOTIC PRESCRIPTION
(N = 2 161 513)‡ (N = 671 342)ALL VISITS †
ASSOCIATED WITH AN ANTIBIOTIC PRESCRIPTION (N = 183 118)‡
NOT ASSOCIATED WITH AN ANTIBIOTIC PRESCRIPTION
(N = 488 224)‡ Overall
population, % 100.0 27.9 72.1 100.0 27.3 72.7
Year, %
• 2005 11.3 30.3 69.7 13.2 31.6 68.4
• 2006 15.4 29.4 70.6 16.2 30.6 69.4
• 2007 14.7 28.5 71.6 13.7 28.9 71.1
• 2008 14.1 28.8 71.2 12.6 28.4 71.6
• 2009 16.9 22.9 77.2 16.1 21.2 78.9
• 2010 13.1 28.0 72.0 12.2 25.8 74.3
• 2011 14.6 28.6 71.5 16.1 25.4 74.6
Patient-level factors
Patient sex
• Female, % 47.5 27.9 72.1 48.9 27.3 72.7
• Male, % 52.5 27.8 72.2 51.2 27.3 72.7
• Missing, n 2 NA NA 1 NA NA
Median (IQR)
patient age, y 4 (2-9) 6 (3-10) 4 (1-8) 6 (2-11) 8 (4-12) 5 (1-10)
• Missing, n 2 NA NA 2 NA NA
Follow-up RTI
visit,§ % 14.0 24.6 75.5 7.9 24.3 75.8
QAIPPE
• 1 (lowest), % 22.2 28.6 71.4 20.4 27.6 72.4
• 2, % 22.7 28.7 71.3 20.9 27.8 72.2
• 3, % 20.0 27.6 72.4 20.5 27.3 72.7
• 4, % 18.2 26.9 73.1 20 26.9 73.1
• 5 (highest), % 15.7 27.1 72.9 18.2 26.7 73.3
• Missing, n 38 224 NA NA 9157 NA NA
Diabetes, % 0.2 33.1 66.9 0.2 33.3 66.7
Asthma, % 12.4 31.5 68.5 8.1 31.1 68.9
Cystic fibrosis, % 0.2 18.6 81.4 0.1 17.7 82.3
Immune
deficiency, % 0.2 30.2 69.8 0.2 28.7 71.3
Chronic liver
disease, % < 0.1 27.8 72.2 0.0 26.4 73.6
Congestive heart
failure, % < 0.1 27.2 72.8 0.0 22.9 77.1
COPD, % 0.5 31.5 68.5 0.3 31.4 68.7
Chronic kidney
disease, % 0.1 28.7 71.4 0.1 28.5 71.6
VARIABLE
FULL DATA SET* SAMPLE OF 1 VISIT PER CHILD*
ALL VISITS (N = 2 996 186)†
ASSOCIATED WITH AN ANTIBIOTIC PRESCRIPTION (N = 834 673)‡
NOT ASSOCIATED WITH AN ANTIBIOTIC PRESCRIPTION
(N = 2 161 513)‡ (N = 671 342)ALL VISITS †
ASSOCIATED WITH AN ANTIBIOTIC PRESCRIPTION (N = 183 118)‡
NOT ASSOCIATED WITH AN ANTIBIOTIC PRESCRIPTION
(N = 488 224)‡ Recent antibiotic
use,‖ %
9.1 24.5 75.5 9.4 24.1 75.9
Median (IQR)
ADG sum 4 (2-5) 4 (2-5) 4 (2-5) 3 (2-5) 3 (2-4) 3 (2-5)
• Missing, n 9 NA NA 2 NA NA
Visits in past 3 y with this physician, %
• 0 36.6 28.6 71.4 46.8 28.7 71.3
• ≤ 30 (but > 0) 30.2 28.6 71.4 25.5 27.9 72.1
• > 30 33.2 26.3 73.7 27.8 24.4 75.6
Median (IQR) no. of different GPs seen in past 3 y
5 (3-7) 5 (3-8) 5 (3-7) 4 (2-6) 4 (2-6) 4 (2-6)
Season, %
• Mar-May 24.2 29.1 70.9 24.5 29.0 71.0
• Jun-Aug 15.0 29.5 70.5 14.5 29.7 70.3
• Sep-Nov 29.3 25.4 74.6 28.8 24.0 76.0
• Dec-Feb 31.5 28.4 71.6 32.3 27.8 72.3
Physician-level factors
Physicians, n 6404 NA NA 6148 NA NA
Physician sex
• Female, % 27.7 23.5 76.6 28.3 23.0 77.0
• Male, % 72.3 29.5 70.5 71.7 28.9 71.1
• Missing, n 10 398 NA NA 1910 NA NA
Specialty, % • Emergency
medicine physician
0.6 25.1 74.9 0.7 25.2 74.8
• Pediatrician 2.9 11.2 88.8 2.4 12.8 87.2
• Other 0.8 41.8 58.2 0.7 40.7 59.3
• GP 95.7 28.3 71.7 96.2 27.6 72.5
Visits for RTIs in the past 30 d, %
• None 0.6 20.4 79.6 0.7 21.0 79.0
• ≤ 2.5 5.7 21.7 78.3 6.9 22.1 77.9
• > 2.5-5 14.7 24.4 75.6 16.8 24.7 75.3
• > 5-7.5 16.5 26.0 74.0 17.8 26.2 73.8
• > 7.5-10 14.8 27.9 72.2 14.8 27.4 72.6
• > 10-15 22.1 29.9 70.1 20.6 29.3 70.7
• > 15-20 14.0 31.9 68.1 12.2 30.9 69.1
• > 20 11.7 29.4 70.6 10.2 28.7 71.3
Table 1 continued from page e282
VARIABLE
FULL DATA SET* SAMPLE OF 1 VISIT PER CHILD*
ALL VISITS (N = 2 996 186)†
ASSOCIATED WITH AN ANTIBIOTIC PRESCRIPTION (N = 834 673)‡
NOT ASSOCIATED WITH AN ANTIBIOTIC PRESCRIPTION
(N = 2 161 513)‡ (N = 671 342)ALL VISITS †
ASSOCIATED WITH AN ANTIBIOTIC PRESCRIPTION (N = 183 118)‡
NOT ASSOCIATED WITH AN ANTIBIOTIC PRESCRIPTION
(N = 488 224)‡ Medical school
graduation location
• Canada, % 62.1 24.3 75.8 64.1 23.8 76.2
• International, % 37.9 33.8 66.2 36.0 33.4 66.6
• Missing, n 70 648 NA NA 15 683 NA NA
Daily patient volume,¶ %
• 1st quartile
(< 28 visits) 22.8 23.2 76.9 25.3 23.3 76.7
• 2nd quartile
(28-37 visits) 24.9 26.4 73.6 26.6 26.2 73.8
• 3rd quartile
(38-48 visits) 26.0 28.9 71.1 25.7 28.7 71.3
• 4th quartile
(> 48 visits) 26.3 32.3 67.7 22.4 31.4 68.6
Years since medical school graduation
• 0-5, % 4.6 21.8 78.2 5.2 20.8 79.3
• 6-10, % 9.3 22.1 77.9 9.8 22.4 77.6
• 11-15, % 13.0 24.0 76.0 13.4 24.3 75.7
• 16-20, % 18.5 26.9 73.1 18.2 27.0 73.1
• 21-25, % 16.8 28.7 71.3 16.5 27.7 72.3
• 26-30, % 13.9 30.0 70.0 13.7 29.3 70.7
• 31-35, % 11.9 30.7 69.3 11.6 29.7 70.3
• 36-40, % 7.4 30.7 69.3 7.2 29.7 70.3
• > 40, % 4.7 39.1 60.9 4.5 37.9 62.1
• Missing, n 4032 NA NA 1050 NA NA
No. of RTIs seen in the past y, %
• 1st quartile
(≤ 248) 20.4 20.8 79.2 24.8 21.5 78.5
• 2nd quartile
(249-490) 22.2 25.6 74.5 25.1 25.9 74.1
• 3rd quartile
(491-972) 25.2 28.2 71.8 25.0 28.5 71.5
• 4th quartile
(≥ 973) 32.2 33.7 66.4 25.0 33.2 66.8
Regional-level factors
Median (IQR) proportion of LHA population aged > 65 y
0.13 (0.10-10.15) 0.13 (0.10-0.15) 0.13 (0.11-0.15) 0.13 (0.11-0.16) 0.13 (0.10-0.16) 0.13 (0.11-0.16) Table 1 continued from page e283
decreased the between-physician variance by 18.55%, but more important, the rest of the variation remains unaccounted for. This suggests that individual physician practice style is driving a notable amount of the varia-tion in antibiotic prescribing for RTIs. In comparison, patient and regional effects were relatively small.
Evidence of provider-level variation in prescrib-ing has been previously reported5,6,35; the current study extends these findings with a population-based analy-sis of children across 7 years of data using a multi-level modeling framework. Additionally, we were able to include measures of health care usage and clinician practice characteristics.
Our findings suggest that a substantial amount of variability in antibiotic prescribing among physicians remains unexplained by observed factors, and might be more strongly related to individual practice styles. Efforts to measure prescriptions, and to target physi-cians with higher propensities to prescribe, might be
the most promising interventions. Our findings also suggest a potential benefit from focusing on physicians who have been in practice longer and internationally trained physicians. Provision of individualized feedback via prescription database extracts, targeting of continu-ing education and academic detailcontinu-ing efforts, and tailor-ing our foreign-trained licenstailor-ing requirements might be relevant approaches in these respects.
Limitations
Several limitations are worth bearing in mind as our results are interpreted. A previous systematic review of factors associated with antibiotic prescribing for RTI identified a number of patient-clinical and patient- physician communication factors as relevant.25 The pres-ent study was unable to include many of these meas-ures owing to the nature of our data, and their inclusion could have explained more of the variation. However, we have addressed many known determinants in our model. VARIABLE
FULL DATA SET* SAMPLE OF 1 VISIT PER CHILD*
ALL VISITS (N = 2 996 186)†
ASSOCIATED WITH AN ANTIBIOTIC PRESCRIPTION (N = 834 673)‡
NOT ASSOCIATED WITH AN ANTIBIOTIC PRESCRIPTION
(N = 2 161 513)‡ (N = 671 342)ALL VISITS †
ASSOCIATED WITH AN ANTIBIOTIC PRESCRIPTION (N = 183 118)‡
NOT ASSOCIATED WITH AN ANTIBIOTIC PRESCRIPTION
(N = 488 224)‡ Median (IQR)
proportion of LHA population aged < 15 y
0.18 (0.16-0.21) 0.19 (0.17-0.22) 0.18 (0.16-0.21) 0.18 (0.16-0.21) 0.19 (0.16-0.21) 0.18 (0.16-0.21)
Median (IQR) age of LHA population, y
39 (36-41) 38 (35-41) 39 (37-41) 39 (37-42) 39 (37-41) 39 (37-42)
Health authority
• Interior, % 11.8 27.8 72.2 14.5 28.0 72.1
• Fraser, % 46.3 29.6 70.4 41.3 28.5 71.5
• Vancouver
Coastal, % 23.2 22.4 77.6 22.3 21.9 78.1
• Vancouver
Island, % 12.2 26.4 73.6 14.3 26.5 73.5
• Northern, % 6.5 37.5 62.5 7.5 36.6 63.4
• Missing, n 4689 NA NA 1251 NA NA
Median (IQR) 28-d moving average apparent temperature, °C
4.73 (0.57-11.76) 4.62 (0.33-12.14) 4.77 (0.66-11.57) 4.49 (0.36-11.50) 4.42 (0.17-12.14) 4.52 (0.43-11.24)
ADG—aggregated diagnosis group, COPD—chronic obstructive pulmonary disease, IQR—interquartile range, LHA—local health area, NA—not applicable, QAIPPE—Quintile of Annual Income Per Person Equivalent, RTI—respiratory tract infection.
*Not all percentages add to 100 owing to rounding. †Overall values.
‡Within-category values.
§A follow-up visit is any visit within 14 d of another RTI visit.
Figure 1. Monthly number of visits and visits with antibiotic prescriptions, and monthly proportions of visits with antibiotic prescriptions, from 2005 to 2011 in British Columbia: The spike in RTI visits at the end of 2009, and related decrease in proportion of visits associated with a prescription, is likely attributable to the H1N1 influenza pandemic.
RTI—respiratory tract infection.
80000
70000
60000
50000
40000
30000
2005 2006 2007 2008 2009 2010 2011 10000
1.0 0.9 0.8 0.7 0.6 0.5 0.4 0.3 0.2 0.1 0 20000
0
NO
. OF R
TI VISIT
S
YEAR
RTI visits RTI visits with antibiotic prescription Proportion of visits with antibiotic prescription
PR
OPOR
TION OF VISIT
S WITH AN
ANTIBIO
TIC PRE
SCRIP
TION
Figure 2. Histogram of proportion of pediatric RTI visits associated with an antibiotic prescription, per physician, between 2005 and 2011:
Frequencies are weighted by the total number of RTI visits.
RTI—respiratory tract infection.
PHY
SICIANS, %
PROPORTION OF VISITS WITH AN ANTIBIOTIC PRESCRIPTION
16
14
12
10
0.050.1 0.15 0.20.250.3 0.350.40.45 0.50.550.60.650.7 0.750.80.85 0.90.95 1.0 8
6
4
2
Table 2. Generalized linear mixed model of antibiotic prescription for pediatric RTIs: A) Effect estimates and B) measures of model fit and variance.
A)
EFFECT EMPTY MODEL BASIC MODEL WITH YEAR ONLY WITH PATIENT COVARIATES
WITH PATIENT AND PHYSICIAN
COVARIATES
WITH PATIENT, PHYSICIAN, AND REGIONAL COVARIATES
Random effect, variance (SE)
Physician 0.96 (0.023) 0.95 (0.022) 0.91 (0.011) 0.78 (0.019) 0.76 (0.019)
Fixed effects, OR (95% CI)
Constant term 0.27 (0.26-0.27) 0.35 (0.34-0.36) 0.18 (0.17-0.18) 0.10 (0.09-0.11) 0.10 (0.08-0.12) Year (reference:
2005)
• 2006 0.93 (0.91-0.95) 0.94 (0.92-0.96) 0.91 (0.88-0.93) 0.90 (0.88-0.92)
• 2007 0.89 (0.87-0.91) 0.93 (0.91-0.95) 0.88 (0.86-0.90) 0.87 (0.85-0.89)
• 2008 0.85 (0.83-0.87) 0.92 (0.90-0.94) 0.87 (0.85-0.89) 0.86 (0.84-0.88)
• 2009 0.58 (0.57-0.60) 0.61 (0.60-0.63) 0.58 (0.56-0.59) 0.57 (0.56-0.59)
• 2010 0.76 (0.74-0.78) 0.92 (0.90-0.94) 0.83 (0.81-0.86) 0.83 (0.81-0.85)
• 2011 0.75 (0.73-0.77) 0.94 (0.92-0.96) 0.86 (0.83-0.88) 0.85 (0.82-0.87)
Season (reference: Jun-Aug)
• Mar-May 0.98 (0.97-1.00) 0.99 (0.97-1.00) 1.05 (1.03-1.07) 0.99 (0.97-1.02)
• Sep-Nov 0.80 (0.79-0.82) 0.80 (0.79-0.82) 0.86 (0.85-0.88) 0.80 (0.77-0.82)
• Dec-Feb 0.99 (0.97-1.00) 0.96 (0.94-0.98) 1.06 (1.04-1.09) 0.95 (0.92-0.98)
Patient sex (reference: male)
• Female 0.97 (0.96-0.98) 0.97 (0.96-0.98) 0.97 (0.96-0.98)
Patient age (per y
increase) 1.08 (1.08-1.08) 1.08 (1.08-1.08) 1.08 (1.08-1.08)
Follow-up RTI visit 0.98 (0.96-1.01) 0.97 (0.95-1.00) 0.97 (0.95-1.00)
QAIPPE (reference: 1)
• 2 1.00 (0.98-1.02) 1.00 (0.98-1.02) 1.00 (0.98-1.02)
• 3 1.01 (0.99-1.03) 1.01 (0.99-1.03) 1.01 (0.99-1.03)
• 4 1.02 (1.00-1.04) 1.02 (1.00-1.05) 1.02 (1.00-1.04)
• 5 1.03 (1.01-1.05) 1.04 (1.02-1.06) 1.04 (1.02-1.06)
Diabetes 1.08 (0.95-1.22) 1.05 (0.93-1.19) 1.05 (0.93-1.19)
Asthma 1.06 (1.04-1.08) 1.06 (1.04-1.08) 1.06 (1.04-1.08)
Cystic fibrosis 0.96 (0.80-1.16) 0.97 (0.80-1.18) 0.97 (0.80-1.18)
Immune deficiency 0.92 (0.80-1.07) 0.92 (0.79-1.06) 0.92 (0.79-1.06)
Chronic liver
disease 1.07 (0.74-1.56) 1.03 (0.70-1.52) 1.00 (0.68-1.48)
Congestive heart
failure 1.30 (0.88-1.92) 1.12 (0.75-1.69) 1.12 (0.74-1.68)
COPD 0.87 (0.78-0.98) 1.14 (1.02-1.29) 1.15 (1.02-1.29)
Chronic kidney
disease 0.90 (0.72-1.13) 1.12 (0.89-1.40) 1.12 (0.90-1.40)
A)
EFFECT EMPTY MODEL BASIC MODEL WITH YEAR ONLY WITH PATIENT COVARIATES
WITH PATIENT AND PHYSICIAN
COVARIATES
WITH PATIENT, PHYSICIAN, AND REGIONAL COVARIATES Recent antibiotic
use 0.85 (0.83-0.87) 0.86 (0.84-0.88) 0.86 (0.84-0.88)
ADG sum 0.97 (0.97-0.97) 0.97 (0.97-0.97) 0.97 (0.97-0.97)
Visits in past 3 y with this physician, % (reference: > 30)
• 0 1.20 (1.18-1.22) 1.21 (1.19-1.24) 1.21 (1.19-1.24)
• ≤ 30 (but > 0) 1.07 (1.05-1.09) 1.07 (1.05-1.09) 1.07 (1.05-1.09)
No. of different GPs
seen in past 3 y 1.02 (1.02-1.02) 1.02 (1.02-1.02) 1.02 (1.02-1.02)
Physician sex (reference: male)
• Female 0.89 (0.84-0.94) 0.91 (0.86-0.96)
Specialty (reference: GP)
• Emergency medicine physician
0.79 (0.61-1.02) 0.79 (0.62-1.02)
• Pediatrician 0.47 (0.41-0.55) 0.48 (0.42-0.56)
• Other 0.88 (0.72-1.06) 0.89 (0.73-1.07)
Visits for RTIs in the past 30 d, % (reference: > 20)
• None 1.34 (1.21-1.49) 1.36 (1.23-1.51)
• ≤ 2.5 1.42 (1.35-1.49) 1.45 (1.38-1.52)
• > 2.5-5 1.40 (1.34-1.45) 1.42 (1.36-1.48)
• > 5-7.5 1.32 (1.27-1.37) 1.33 (1.29-1.38)
• > 7.5-10 1.25 (1.21-1.30) 1.26 (1.22-1.31)
• > 10-15 1.21 (1.17-1.25) 1.22 (1.18-1.25)
• > 15-20 1.13 (1.10-1.16) 1.13 (1.10-1.16)
Medical school graduation location (reference: Canada)
• International 1.77 (1.68-1.88) 1.73 (1.63-1.83)
Daily patient volume (reference: 1st quartile [< 28 visits])
• 2nd quartile
(28-37 visits) 0.99 (0.97-1.01) 0.99 (0.98-1.01)
• 3rd quartile
(38-48 visits) 0.97 (0.95-0.99) 0.97 (0.95-0.99)
• 4th quartile
(> 48 visits) 0.94 (0.92-0.96) 0.94 (0.92-0.97)
Table 2 continued from page e287
A)
EFFECT EMPTY MODEL BASIC MODEL WITH YEAR ONLY WITH PATIENT COVARIATES
WITH PATIENT AND PHYSICIAN
COVARIATES
WITH PATIENT, PHYSICIAN, AND REGIONAL COVARIATES Years since medical
school graduation (reference: 0-5)
• 6-10 0.98 (0.93-1.03) 0.99 (0.94-1.04)
• 11-15 1.07 (1.01-1.14) 1.08 (1.02-1.15)
• 16-20 1.15 (1.08-1.22) 1.16 (1.09-1.24)
• 21-25 1.21 (1.13-1.29) 1.23 (1.15-1.31)
• 26-30 1.29 (1.21-1.39) 1.32 (1.23-1.41)
• 31-35 1.32 (1.23-1.42) 1.35 (1.26-1.46)
• 36-40 1.36 (1.25-1.47) 1.39 (1.29-1.51)
• > 40 1.41 (1.28-1.56) 1.46 (1.33-1.61)
No. of RTIs seen in the past y (reference: 1st quartile [≤ 248])
• 2nd quartile
(249-490) 1.10 (1.07-1.13) 1.11 (1.08-1.14)
• 3rd quartile
(491-972) 1.17 (1.12-1.21) 1.19 (1.15-1.23)
• 4th quartile
(≥ 973) 1.27 (1.21-1.33) 1.31 (1.25-1.37)
LHA population aged > 65 y (per 10%)
0.99 (0.98-1.00)
LHA population aged < 15 y (per 10%)
1.12 (1.06-1.17)
Median age of LHA population (centred on mean)
1.19 (1.11-1.27)
Health authority (reference: Vancouver Coastal)
• Interior 1.07 (1.02-1.13)
• Fraser 1.00 (0.97-1.03)
• Vancouver Island 1.03 (0.98-1.08)
• Northern 1.20 (1.13-1.28)
28-d moving average apparent temperature
0.99 (0.99-0.99) Table 2 continued from page e288
B)
MEASURE EMPTY MODEL BASIC MODEL WITH YEAR ONLY WITH PATIENT COVARIATES
WITH PATIENT AND PHYSICIAN COVARIATES WITH PATIENT, PHYSICIAN, AND REGIONAL COVARIATES
Observations used, n 671 342 671 342 662 202 645 815 645 094
AIC 616 216.2 692 274.7 666 759.5 648 692.3 647 788.8
ICC,* % 22.6 22.4 21.6 19.2 18.8
MOR 2.55 2.53 2.48 2.33 2.30
PCV (relative to intercept-only model) at level of physician, %
NA 1.49 5.86 18.55 20.82
PCV (relative to previous model) at level of physician, %
NA 1.49 4.44 13.48 2.78
ADG—aggregated diagnosis group, AIC—Akaike information criterion, COPD—chronic obstructive pulmonary disease, ICC—intraclass correlation, IQR—interquartile range, LHA—local health area, MOR—median odds ratio, NA—not applicable, OR—odds ratio, PCV—percent change in variance, QAIPPE—Quintile of Annual Income Per Person Equivalent, RTI—respiratory tract infection.
*ICC is the proportion of total variance attributable to between-physician differences.
A number of variables had missing data, as is com-mon with administrative data. Physician demographic variables, in particular, had a higher rate of missing values. We did not specifically aim to assess the appropriateness of prescriptions. Rather, we considered any prescrip-tion for RTIs as potentially unnecessary, for the purpose of exploring factors associated with prescribing. In this regard, we caution against an interpretation of these find-ings as relating to inappropriate antibiotic prescriptions.
Conclusion
This population-level analysis demonstrated that variations exist among physicians in the antibiotic management of pediatric RTIs. Physician characteristics account for some, but not all, of the observed variations. The design of effec-tive community-oriented programs and policies should aim to address variations in use of these essential drugs by focusing on physicians with higher-prescribing practices. Dr McKay is a postdoctoral fellow in the Department of Epidemiology, Biostatistics and Occupational Health at McGill University in Montreal, Que. Dr Patrick is Professor in the School of Population and Public Health and Medical Epidemiology Lead for Antimicrobial Resistance in the British Columbia Centre for Disease Control at the University of British Columbia in Vancouver. Dr McGrail is Associate Professor in the School of Population and Public Health and in the Centre for Health Services and Policy Research at the University of British Columbia. Dr Law is Associate Professor in the School of Population and Public Health and in the Centre for Health Services and Policy Research at the University of British Columbia.
Acknowledgment
Dr McKay was supported by a Canadian Institutes of Health Research Doctoral Award (Frederick Banting and Charles Best Canada Graduate Scholarship). A University of British Columbia Centre for Disease Control Communal Fund Grant was awarded to
Drs Patrick and McKay for this project. This study was also supported by a Canadian Institutes of Health Research Foundation Scheme Grant (Improving Access to Medicines in Canada and Abroad). Dr Law received salary support through a Canada Research Chair and a Michael Smith Foundation for Health Research Scholar Award. Population Data BC also granted a student waiver of some costs associated with the acquisition of the data. The British Columbia Ministry of Health approved access to and use of the data facilitated by Population Data BC for this study. All inferences, opinions, and conclusions drawn in this article are those of the authors and do not reflect the opinions or policies of the data stewards.
Contributors
Dr McKay, whotakes responsibility for the integrity of the work as a whole, from inception to published article, led the conception and design of the study and acquisi-tion of data; conducted the analysis and preliminary interpretaacquisi-tion; and drafted the article and gave final approval of the version to be published. Drs Patrick, McGrail, and
Law contributed to the conception and design of the study, acquisition of data, and interpretation of the results; and revised the article critically for important intellectual content and gave final approval of the version to be published.
Competing interests
None declared
Correspondence
Dr Rachel McKay; e-mail rachel.mckay@mail.mcgill.ca References
1. Davies J, Davies D. Origins and evolution of antibiotic resistance. Microbiol Mol Biol Rev 2010;74(3):417-33.
2. Kronman MP, Zhou C, Mangione-Smith R. Bacterial prevalence and antimicrobial prescribing trends for acute respiratory tract infections. Pediatrics 2014;134(4):e956-65. Epub 2014 Sep 15.
3. Fleming-Dutra KE, Hersh AL, Shapiro DJ, Bartoces M, Enns EA, File TM Jr, et al. Preva-lence of inappropriate antibiotic prescriptions among US ambulatory care visits, 2010-2011. JAMA 2016;315(17):1864-73.
4. Butler CC, Hood K, Verheij T, Little P, Melbye H, Nuttall J, et al. Variation in antibiotic prescribing and its impact on recovery in patients with acute cough in primary care: prospective study in 13 countries. BMJ 2009;338:b2242.
5. Jones BE, Sauer B, Jones MM, Campo J, Damal K, He T, et al. Variation in outpatient antibiotic prescribing for acute respiratory infections in the veteran population: a cross-sectional study. Ann Intern Med 2015;163(2):73-80.
6. Mousquès J, Renaud T, Scemama O. Is the “practice style” hypothesis relevant for general practitioners? An analysis of antibiotics prescription for acute rhinopharyn-gitis. Soc Sci Med 2010;70(8):1176-84.
7. Brookes-Howell L, Hood K, Cooper L, Coenen S, Little P, Verheij T, et al. Clinical influences on antibiotic prescribing decisions for lower respiratory tract infection: a nine country qualitative study of variation in care. BMJ Open 2012;2(3):pii:e000795. 8. Arnold SR, To T, McIsaac WJ, Wang EE. Antibiotic prescribing for upper respiratory
tract infection: the importance of diagnostic uncertainty. J Pediatr 2005;146(2):222-6. 9. Rutschmann OT, Domino ME. Antibiotics for upper respiratory tract infections in
ambulatory practice in the United States, 1997-1999: does physician specialty mat-ter? J Am Board Fam Pract 2004;17(3):196-200.
10. Petursson P. GPs’ reasons for “non-pharmacological” prescribing of antibiotics. A phenomenological study. Scand J Prim Health Care 2005;23(2):120-5.
11. Mueller T, Östergren PO. The correlation between regulatory conditions and antibi-otic consumption within the WHO European Region. Health Policy 2016;120(8):882-9. Epub 2016 Jul 12.
12. Koller D, Hoffmann F, Maier W, Tholen K, Windt R, Glaeske G. Variation in antibiotic prescriptions: is area deprivation an explanation? Analysis of 1.2 million children in Germany. Infection 2013;41(1):121-7. Epub 2012 Jul 24.
13. Marra F, Mak S, Chong M, Patrick DM. The relationship among antibiotic consump-tion, socioeconomic factors and climatic conditions. Can J Infect Dis Med Microbiol
2010;21(3):e99-106.
14. British Columbia Ministry of Health. Consolidation file [data extract]. Vancouver, BC: Population Data BC; 2013. Available from: www.popdata.bc.ca/data. Accessed 2019 May 10. 15. British Columbia Ministry of Health. Medical Services Plan (MSP) payment
informa-tion file [data extract]. Vancouver, BC: Population Data BC; 2014. Available from:
www.popdata.bc.ca/data. Accessed 2019 May 10.
16. British Columbia Ministry of Health. PharmaNet [data extract]. Vancouver, BC: British Columbia Ministry of Health; 2011. Available from: www.popdata.bc.ca/data. Accessed 2019 May 10.
17. Canadian Institute for Health Information. Discharge Abstract Database (hospital separations) [data extract]. Vancouver, BC: Population Data BC; 2014. Available from:
www.popdata.bc.ca/data. Accessed 2017 Jul 25.
18. British Columbia Ministry of Health. Medical Services Plan (MSP) practitioner file.
Vancouver, BC: Population Data BC; 2014. Available from: www.popdata.bc.ca/data. Accessed 2019 May 28.
19. Cadieux G, Tamblyn R. Accuracy of physician billing claims for identifying acute respi-ratory infections in primary care. Health Serv Res 2008;43(6):2223-38. Epub 2008 Jul 28. 20. Blondel-Hill E, Fryters S. Bugs & drugs: an antimicrobial/infectious diseases
refer-ence. Edmonton, AB: Alberta Health Services; 2012.
21. Morgan SG, Cunningham CM, Hanley GE. Individual and contextual determinants of regional variation in prescription drug use: an analysis of administrative data from British Columbia. PLoS One 2010;5(12):e15883.
22. Weissman J, Besser RE. Promoting appropriate antibiotic use for pediatric patients: a social ecological framework. Semin Pediatr Infect Dis 2004;15(1):41-51.
23. Green LW, Kreuter MW. Health promotion planning. An educational and environmen-tal approach. 2nd ed. Mountainview, CA: Mayfield Publishing Company; 1991. 24. Wennberg JE, Barnes BA, Zubkoff M. Professional uncertainty and the problem of
supplier-induced demand. Soc Sci Med 1982;16(7):811-24.
25. McKay R, Mah A, Law MR, McGrail K, Patrick DM. Systematic review of factors associ-ated with antibiotic prescribing for respiratory tract infections. Antimicrob Agents Chemother 2016;60(7):4106-18.
26. Breslau N, Reeb KG. Continuity of care in a university-based practice. J Med Educ
1975;50(10):965-9.
27. Weiner JP, Starfield BH, Steinwachs DM, Mumford LM. Development and applica-tion of a populaapplica-tion-oriented measure of ambulatory care case-mix. Med Care
1991;29(5):452-72.
28. Henderson SB, Wan V, Kosatsky T. Differences in heat-related mortality across four ecological regions with diverse urban, rural, and remote populations in British Columbia, Canada. Health Place 2013;23:48-53. Epub 2013 Apr 29.
29. Merlo J, Chaix B, Ohlsson H, Beckman A, Johnell K, Hjerpe P, et al. A brief conceptual tutorial of multilevel analysis in social epidemiology: using measures of clustering in multilevel logistic regression to investigate contextual phenomena. J Epidemiol Community Health 2006;60(4):290-7.
30. Goldstein H, Browne W, Rasbash J. Partitioning variation in multilevel models.
Understanding Stat 2002;1(4):223-31.
31. Larsen K, Petersen JH, Budtz-Jørgensen E, Endahl L. Interpreting parameters in the logistic regression model with random effects. Biometrics 2000;56(3):909-14. 32. Larsen K, Merlo J. Appropriate assessment of neighborhood effects on individual
health: integrating random and fixed effects in multilevel logistic regression. Am J Epidemiol 2005;161(1):81-8.
33. Nakagawa S, Schielzeth H. A general and simple method for obtaining R2 from
general-ized linear mixed-effects models. Methods Ecol Evol 2013;4(2):133-42. Epub 2012 Dec 3. 34. Dekker AR, Verheij TJ, van der Velden AW. Inappropriate antibiotic prescription
for respiratory tract indications: most prominent in adult patients. Fam Pract
2015;32(4):401-7. Epub 2015 Apr 24.
35. Cordoba G, Siersma V, Lopez-Valcarcel B, Bjerrum L, Llor C, Aabenhus R, et al. Prescribing style and variation in antibiotic prescriptions for sore throat: cross-sectional study across six countries. BMC Fam Pract 2015;16:7.
This article has been peer reviewed.
Cet article a fait l’objet d’une révision par des pairs.