THE
OF QUANTITATIVE CHARACTERST. M. CHOO
Research Station, Agriculture Canada, P . 0 . Box 1210, Charlottetown, Prince Edward Island, Canada, C I A 7M8
Manuscript received August 20, 1980 Revised copy received August 25, 1981
ABSTRACT
By using a doubled-haploid population derived from F, plants, additive and additive x additive genetic variances, as well as the number of segregating genes, can be estimated. An F,-derived doubled-haploid population may contain almost 50% more of the best recombinant than a n F,-derived population. How- ever, the best recombinant occurs in the same frequency in the two populations when there is no linkage between genes. The difference in the frequency of the best recombinant between F,- and F,-derived populations is small. This implies that the doubled-haploid method using F, plants provides only slightly less op- portunity for recombination than the conventional breeding methods of self- pollinating crops. In the absence of additive epistasis, a weighted mean of re- combination values can be estimated using a n F,-derived population and its parental lines. When additive epistasis is present, it can be estimated from doubled-haploid populations derived from two backcrosses. Studies on the link- age of quantitative characters are needed for determining whether doubled haploids should be produced from F, or from F, plants in a breeding program.
H A P L O I D S can be produced by means of various production techniques such as anther culture, interspecific hybridization, and so on. They form doubled haploids after their chromosomes are doubled by colchicine. Using doubled- haploid techniques, truly homozygous lines can be obtained from the gametes of
F, hybrids; thereby, the time required to develop new varieties may be shortened by 2 to 3 generations. The first doubled-haploid variety of barley, Mingo, was developed by Ciba Geigy Seeds Ltd., Ontario, and was licensed for sale in Canada in 1979, only five years after its parental lines were crossed (Ho and
JONES
1980).Doubled-haploid techniques also off er tremendous potential for the study of quantitative inheritance. It has been shown that the number of segregating genes in a single cross can be estimated from a doubled- haploid population produced from F, plants ( CHOO and REINBERGS, unpublished), and that the nature of addi- tive epistasis, if present, can be revealed by studying the skewness of a biparental doubled-haploid population ( CHOO and REINBERGS, unpublished). If doubled hap- loids are derived from a diallel set of crosses, estimates of both additive and addi- tive x additive genetic variances can be obtained; in addition, the mean and
1 Contribution No. 457 from Agriculture Canada Research Station, Charlottetown, Prince Edward Island, Canada
C1A 71118.
526
variance of recombiflation values can also be estimated from the diallel (CHOO
1981).
When diallel crosses are used for estimating genetic variances and parame- ters of recombination values, the numbers of parental lines used in diallel crosses and of doubled-haploid lines produced from each crosses could be limited by the availability of the experimenter’s resources. Both would introduce sampling errors that may seriously affect the accuracy of the estimates of genetic variances and parameters of recombination values. This is further complicated by the fact that genes in the parents may not be at equilibrium. The present paper reports a n ap- proach that is simpler and requires less labor than the diallel f o r studying the inheritance of quantitative characters. The optimum segregating generation f o r the production of doubled haploids from a cross of two parents is also discussed. Eslimation of genetic uariances
Additiue and additive x additiue variances: Suppose that two diploid inbred parents differing in two genes, A-a and B-b, are crossed, nine different genotypic classes with one having two linkage phases can be obtained in the F, generation, as given in Table 1. Using a haploid-production technique (see KASHA 1974), haploids can be extracted from F, plants. These haploids are then used to produce doubled haploids by doubling the chromosomes. For simply inherited characters, JOHNS (1974) observed that doubled-haploid lines of barley represent random samples of gametes from F, plants. Based on the assumption of random gametes, it is thus possible to calculate the expected frequencies of different doubled-haploid
families produced from each genotypic class i n the F, generation (Table 1). Let rn be a constant depending on the action of genes not under consideration, d, and db be half of the differences between AA-aa and BB-bb homozygotes, re- spectively, and
i
be the homozygote X homozygote interaction. These four parameters are defined as:m = ( A A BB
4-
A A bb 4- aa BB f ac* b b ) / 4d , = ( A A BB f A A bb - aa BB - aa b b ) / 4 db = ( A A BB - A A bb
+
aa BB - aa b b ) / 4i = ( A A BB - A A bb - arz BB f atr b b ) / 4
.
They, in turn, are used to describe the genotypic values of the four kinds of doubled haploids; symbolically,
A A BB = m f d,
+
db+
iA A bb = m f d , - db - i
a Q B B = m - d , f d b - i a a b b = m - d d , - d b + i .
Given the expected frequencies and the genotypic values of doubled-haploid families from F, plants, the total variance of doubled-haploid progeny
(aiZDH)
can be obtained as= d i -t dt 3. i - + 2 (1 - r ) ( 1 -2r) d,db - ( 1 - r ) ’ ( I - 2 r ) Y
,
where the upper sign of the L L k ” applies to a cross of two associated parents
TABLE 1
Frequencies and phenotypic means of ten doubled-haploid (DH) families produced from
F , plants of a cross of two associatid parents ( A A BB
x
aa bb)~~~ ____ ~
I’, family Frequency* DH family Mean
A A BB
A A Bb
A A bb
Aa BB
Aa Bb
Aa Bb
Aa bb
aa BB
aa Bb
aa bb
(1--T)2 4 r(1-r) 2 r2 4 r(1-r) 2 (1-r)Z 2
-
r2 2-
r (1-r) 2 r2 4 r(1-r)
--
2 (1-r)z 4A A BB
1 1
2 2
( - A A BB
+
- A A b b )A A bb
1 1
2 2
( - A A BB,+ - aa B B )
1 -r
( = A A BB
+
-aa bb+
L
A A bb+
L a a B B )2 2 2 2
1 -r 1 --T
( : A A BB
+
Laabb+ - A A bb+
-aa B B )2 2 2 2
1 1
2
(
A A bb+
-
aa b b )aa BB
1 I
2 2
(-
aa BB f- - aa bb)aa bb
* r is the recombination value. Mean cf all DH pmgeny = (1--3r+2r?)i.
( A A bh X nz B B ) and r is the rezombination value. (Hereafter, the d.ouble sign with the same application will be used).
This variance can be partitioned into two components; namely, variance among F,-derived doubled-haploid families ( u ; ~ , ~ ~ ) and variance within
F2-
derived doubled-haploid families ) . Mathematically, the two variance components can be expressed as:1 1
d i f - d i
*
( 1 - 21) d,& f I (2- 5r fCl,r2)i’
-
- _
u t F 2 D I i 2
2
In this paper, additive genetic variance (U:) is defined as the summation of variances due to additive effects, e.g., U:= dz
f
d:, and additive x additive ge-netic variance (U:*) as the summation of valrances due to homozygote x homo- zygote interaction, e.g.,
UL
=i2,
in a two-locus system. I n the absence of linkage( T = 0.5 ), the above three equations i n a multiple-locus system can be written as
T. M. CHOO
u 2 = U;
+
F,DH
Therefore, both U: and can be estimated by simultaneously solving any two of
the three equations.
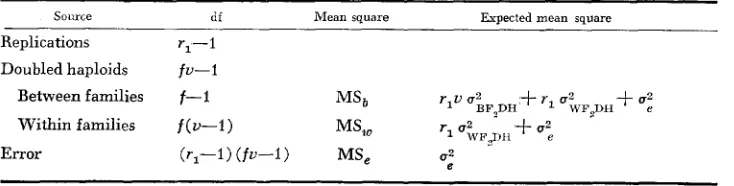
Suppose U doubled haploids are produced from each of F, plants and the total
number, i.e., U times the number (f) of F, plants, of double haploids are evaluated
in a completely randomized block layout with r1 replications. The analysis of variance and the expected mean squares for these doubled haploids are outlined in Table 2. It is clear that
1
= - (MS,-MS,)
,
A 9
u ; ~ ~ 2 ~ ~ ~
where the “hat” ( ) denotes “estimate of.” Hence,
3 1
rlv rl
A ? --
-
(MSb-MS,) - - (MS,-MS,)G . % = 3 G 2 B F ~ D H - u G r ~ 2 ~ ~ ~
To obtain sampling variances of these estimates, it is necessary to make some assumptions about the distribution of doubled-haploid effects and environmental deviations. If they are normally distributed, then the sampling variance of any mean square can be shown to be 2(MS)”(df
4-
2), where MS is the average value of the mean square in question and df is the corresponding degrees of free- dom. Therefore, the sampling variance of GA or G L can be obtained by finding the variance of a linear function of the appropriate mean squares (CRUMP 1946).and
$IA
are relatively large, and both are de- pendent upon variables f, U and rl. The effects of the three variables on the size ofThe sampling variances of
TABLE 2
Analysis of variance for an F,-derived doubled-haploid population
~~
Source df Mean square Expected mean square Replications r,-1
Doubled haploids fu-1 Between families f-I
Within families f ( u - I ) MS, r1 U, WFQII +U:
r l u u 2
MSb BF,DH
sampling variances are illustrated by using two hypothetical populations. Suppose that two doubled-haploid populations, one with :U I=10 and uz = 20 and the other with U; #= 20 and <A'= 10, are evaluated in a field plot vvlth a n environ- mental variance
(U:)
of 70. The sampling standard errors of GiandGiA
for the two populations under various numbers of f, U and rI can be easily calculated. Inboth populations, variables f and U have a greater effect than number of replica-
tions ( r I ) in terms of reduction of the sampling standard errors. Increasing both f and U may result in a decrease of sampling errors. But for a fixed number of
doubled haploids, sampling errors decrease with increasing f and decreasing U, and the smallest sampling errors do not necessarily occur i n the population in which U = 2, suggesting that there is a n optimum combination of f and U for the smallest sampling errors in a fixed number of doubled haploids. With a sample size as large as 300 doubled haploids, only the larger variances, i.e., either u i o r
U;*, is greater than twice its sampling error. Therefore, a large sample size is
needed i n order to detect additive and additive x additive genetic variances by the analysis of variance.
Dominance variance: Dominance variance can be estimated also if F, plants are included along with an F,-derived doubled-haploid population in the test trial. Assuming that the recombination value ( r ) is equal to 0.5, MATHER a d JINKS
(1971) showed that variance of F, in a two-locus system is as follows:
Ap
1 1 1 1 1 1 1 1
=
3
( d a+
-i )
+
- ( d b+
-
k)
'
+
-
(h,+
-
I ) ,
+
-
4 (ha+
1) 2+
2 2
2
4 21 1 1
4 4 8 16
-i,+-(i"kk") + - 1 2
,
where h,, h b are the effects of dominance at the two loci,
i,
k
are the homozygote xheterozygote interactions, respectively, and 1 is the heterozygote x heterozygote interaction. By subtracting from u2 the remainder,
F2'
1 1 1 1 1 1 1
- ( h , f ~ 1 ) 2 + - ( h ~ + ~ 1 ) 2 f - ( j 2 + k 2 ) + - P f - ( d a i + d b k ) 16 2
,
4
4 4is essentially the sum of dominance effects, homozygote
x
heterozygote and heterozygote x heterozygote interaction. W e define dominance variance as the summation of variances due to dominance effects, e.g., U: = h: f h:, and then1 the remainder becomes
-
4 when
i
=k
= 1 = 0.F, diploid and F,-derived doubled-haploid populations may be evaluated i n a split-plot experiment with populations as main plot units and individual plants as subplot units. The presence of dominance effects is clearly indicated if the between-populations mean square is greater than the error b mean square (Table
TABLE 3
Analysis of variance for F , diploid and F,-deriued doubled-haploid popu1a;h’ons
Source df Mean square Expected mean square
~
Replications Between populations Error a
Diploid population
DH population Between families Within families Error b
Types of gene action
FISHER, IMMER and TEDIN (1932) showed that, for a one-locus system, the skewness of the frequency distribution of
Fz
plants is equal to--
Ad2.
AS- suming no epistasis and no linkage, the skewness of Fz plants in a multiple-locus system is simply the sum of --
hd2
terms of each locus. Thus, one can determine whether the average h is positive or negative by studying the skewness of the frequency distribution of F, plants. Positive average h makes the frequency dis- tribution skewed to the left, indicating that desirable alleles are dominant. On the other hand, negative average h produces rightward skewness with the undesirable alleles being dominant.The skewness of the frequency distribution of a doubled-haploid population derived from F, plants in a two-locus system can be shown as
where Q = (1 - 3r 4- 2r2)
.
3
4
3
4
K,,?,, = 6
ida d b
- 6q2id, da
F 24 (1 -q2)is
’= 6id,
db if r = 0.5,
When there is no additive epistasis, KSFzDH is equal to zero, but is greater than or smaller than zero in the presence of complementary or duplicate interaction, respectively
.
Degree of gene action
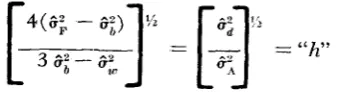
COMSTOCK and ROBINSON ( 1948) presented a method for estimating the degree of dominance. Their method may be modified for use in the doubled haploid materials. Assuming that all j ,
k
and I are negligible, a n estimate of the degreeof dominance (“h”) may be obtained by
there is partial dominance of genes at one or more loci. When
“h“
is unity, com- plete dominance of genes are present. A significance test for the deviation of “h” from any hypothetical value is not available at the present time.An estimate of the degree of additive epistasis (e*) can be obtained by the following relation:
The estimate, d is equal to unity when there is complete additive X additive gene interaction, but i n the presence of super- or partial interactions, it is greater or smaller than unity, respectively. The procedure suggested by W. G. COCHRAN
and outlined in COMSTOCK and ROBINSON ( 1 948) may be used for tests of signifi- cance for the deviation of & from any hypothetical value. We use the analysis of variance i n Table 2 for illustration. The expected value of
MSw’
assuming a specific value of e, can be calculated by using the following equation:MSe
U
MSa
+
(
“,“:=2”
1
MS,,,’ =
(
3 e Z + 2 ) + u e2+
2(
3 e Z + 2 ) + ue2
+
2= CIMSb f C2MSe
.
The degrees of freedom for MS,‘ are
(see COMSTOCK and ROBINSON 1948).
(CIMSa
+
CZMS,)-
_-
C;MS; CiMS;
A n approximate F test can be used to compare MS,’ with the MS, obtained from the analysis of variance table.
Defection of linkage
Two doubled-haploid populations from plants in different generations are needed in order to detect linkage. One way to detect linkage is to produce doubled haploids from both F, and F2 plants and then to compare the mean, variance and skewness of the two populations. The mean (
UFaDH
),
variance(ailDH)
and skew- ness (KZF D,) of a n F,-derived doubled-haploid population in a two-locus system areLJFIDH = m f p
i
u:lDH = d i + d i +
i2
*
2 p d , d b - p zi2
K , F I D , = 6 id, d b - 6 p2 id, d b 7 2 p ( 1 - p 2 )
i3
,
532
I n comparison, the mean (U,,,), variance and skewness of a n F,-derived population are
UF-DH = m
*
qi‘V;pH =d6
+
d i+
z2*
2qdadb - q 2 i 2i 1 3 F L D H = 6 idadb - 6 g 2 idadb 7 2q (1-9’)
i ,
,
where q = (1-11
( 1 -2r)Therefore, if linkage is present, ,ElFzDH #
U,lDH
unlessi
= 0, # uilDH for any value ofi
and K3F,DH # KSFIDH unlessi
= 0. In contrast, at r = 0.5 or r = 0.0, UFsDH -utzDH
= vilDH, and K3F2DH = even in the presence of additiveepistasis.
-
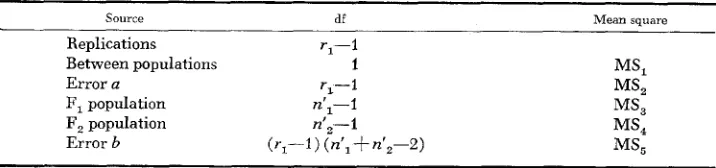
Suppose that an Fl-derived doubled-haploid population with a sample size of
nl’ and a n Fz-derived population with a sample size of n,’ are evaluated in a split- plot experiment. The appropriate analysis of variance for this experiment is given in Table 4. If the between-populations mean square is significantly greater than the error h mean square, as evidenced by an F test, then the F, population mean differs from the F, population mean. Similarly, if the F, population mean square is not equal to the F, population mean square as shown by an F test, then the two mean squares are not homogeneous. The inequalities suggest that linkage is present between genes. It should be noted that tests on variances, such as the F
test, are very sensitive to departures from normality and that doubled-haploid effects are not normally distributed except where additive epistasis is absent and the number of genes controlling the quantitative character under study exceeds 100 (CHOO and REINBERGS, unpublished). I n view of this, it may be desirable to transform the data into normally distributed variates first and then proceed with the analysis of variance. Tests robust to nonnormality (GAMES, KESELMAN and CLINCH 1979) should perhaps be used to compare the two variances.
The frequency distribution of the two populations may also be compared by means of nonparametric tests, for example, the Mann-Whitney U test, Kolmo- gorov-Smirnov two-sample test and Wald-Wolfowitz runs test ( SIEGEL 1956). These nonparametric tests are sensitive to any kind of difference in the dis- tributions, such as difference in mean, in variance, in skewness, etc. In the ab-
TABLE 4
Analysis of variance for F,- and F,-derived doubled-haploid populations
~ ~
Source df Mean square
Replications r,-I
Between populations 1 MSl
Error a r,-1 MS,
F, population nl1-l MS3
F, population n’,--I MS,
sence of linkage, the frequency distribution of the two populations are expected to be similar.
Estimation of average recombination ualue
Without additive epistasis: As mentioned earlier, the presence or absence of
additive epistasis can be determined by studying the skewness
( K
)..,.. of the fre- quency distribution of doubled haploids. The finding based on the analysis of skewness may be further substantiated by studying the kurtosis of the fre- quency distribution of doubled haploids; the distribution of doubled haploids is leptokurtic only in the presence of additive epistasis, and it is always platykurtic or mesokurtic when additive epistasis is absent (CHOO andREINBERGS,
unpub- lished). If additive epistasis is found to be absent according to the analysis of skewness and kurtosis, then the variances among and within F,-derived doubled- haploid families become1 1
_ -
- d:+-di t ( 1 - 2 r ) d,db
%pH 2 2
% F p H 2 2 b ( 1 - 2 r ) , d,db
.
1 1
--d:+-dz
- t
Thus,
aiFzDH
is greater than Q ; ~ , ~ ~ in the doubled-haploid population derivedfrom a cross of two associated parents. The relationship reverses for the doubled- haploid population derived from a cross of two dispersed parents. The two vari- ances are equal at r = 0.5 or r = 0.0. As a result, a comparison of the two variances provides indications of the parental configuration and the presence or absence of linkage. The estimates of the two variances can be obtained from the analysis of variance table (Table 2 ) . When the two parents are also included i n the evaluation trial, then data from the trial provide another statistic: namely, the variance of the parents
Thus,
u i = d i C d i * 2 d a d b
.
1
U&,ur1 -
-
2 U’ p = T 2 r d , db1
&F,DH -
-
2 u p , - - 4 r d , d b - -I- k 4 r 2 d , d b.
Again ~
ukFZDH and U; are estimated from the analysis of variance.
G Z are significantly greater than their respec-
tive sampling errors, then linkage is present between loci. I n such a case, a weighted mean of recombination values (;) may be obtained i n the following manner:
1
-
- 1
- -
With
additive epistasis: I n the presence of additive epistasis, a weighted mean of recombination values may be estimated by generating doubled haploids from two backcrosses. Again, a two-locus system is used to illustrate the backcross ap- proach for estimating means of recombination values. In backcrossing the F, to the A A BB parent, four genotypic classes: AA BB, A a Bb, AA Bb and A a BB can be found i n the backcross generation(Bl).
The other backcross(B,)
produces four other genotypic classes: A a Bb, aa bb, A a bb and aa Bb. Doubled haploids are derived from plants of the two backcrosses (Table5 ) .
Variances among
(aiBlDH
) and within (a&BlDE ) doubled-haploid families for B, backcross can be shown to be1 1
- _
-
[&
*
2 r ( l - r ) i I 2+-
[db + 2 r ( I - r ) i ] 'u I I ~ l ~ ~ i 4 4
1 2
-
(1-2r)dadbf
r(1-7) (1-3r+
3r')i'
1 1
and
-
-
-
( d , ~ if-
) ~(db+
r i ) z If ( 1 - r ) (1-2r) d,db ~ h R l 1 > R 2 2+
r (3-5r+
2 P )'
i
.
TABLE 5
Frequencies and phenotypic means of doubled-haploid ( D H ) families produced fr om plants of two backcrosses
Backcross
family Frequency' DH family hlean
B,: ( A A BB x aa bb)
x
AA BB A A B B _ _ (l-') A A BB2
A a Bb (l-"
2 2 2 2 2
r 1
A A B b -
(1
A A BB + - A A b b )2 2 2
r 1 1
2 2 2
1 -r
('-'AA BB f - aa bb
+
A A b5+
1
:
aa B B )A a B B - ( - A A BB
+
- d I B )5,: ('AA BB X rla b b ) x aa bb
Aa Bb
aa bb m b b
Aa bb -
(k
A A bb f - aa b b )aa Bb
-
(7
aa BB+
- aa b b )1 -r
____
('-')(*AA BB f -- aa bb + : A A bb f L a a B B )
2 2 2 2 2
2
( 1 - r )
r 1
2 2
r 1 1
2 2
d ,
+
d bf
i( 1 -2r) i
d a
db
(1 - 2 r ) i
--d,-db
+
i-'b
-da
~ _ _ _ _ ~~
1 1
2 2
* r is the recombination value. Mean of B, = - d , f - db
+-
( l-r ) 2 i. Mean of B, =-
1 1
- d, - - d , f ( I - r ) z i.
The corresponding variances for B, backcross are
1 1
2
-
( l - % - ) d , d b+
r ( 1 - r ) (1-3r+
3r2) i21 1
+
r (3-5r I+ 2 r 2 ) i2--
-
[ d a 3 2 r ( 1 - r ) i ] 2+-
[db-
2 r ( l - r ) i ] 26 B p 4
4
1 2
-
- _ . (d, 7 r i ) 2 -k
-
( d b-
r i ) 2 -C ( I - r ) (1-2r)dUdb a Y ( . ~ z ~ ~ 2 2-
Then
uiBIDH
%B,DH G B p
u i B Z D H =
*
2r (I-r)id,
+
2r (1 - r ) ida= 2 erid,
+
Bid6.
-
Subsequently
,
-
aiBIDH u k D H 2r2 (I id,
+
idb)
- - r . -- -
1 -
ukBIDH
a&DH 2r ( F id,+
i&)
Extending this to a multiple-locus system,
-
-
r =
Z r t j ( 5 i i j di
+
iij d j )z
rij (I iij di+
i i j d j )I t should be noted that the weighted mean of recombination values can be SO ob-
tained only when additive epistasis is present and it includes the recombination values of interacting genes, but not those of noninteracting genes.
When doubled haploids are evaluated in a split-plot experiment with back- crosses as main plot units and doubled haploids within each backcross as subplot units (Table 6), the estimates of
'
and can be obtained as (M&i
-
M S w i )1
rlul
1
-
--
A 2
OB B %DH
=
-
(MSwl
-
MS,).
u ~ r1 ~ ~ l ~ ~
TABLE 6
Analysis of variance for doubled-haploid populations derived from two backcrosses
Expected mean square
Source df Mean square
Replications r,-1 Between populations 1
Error a r,-1
B, population b,U,-l
Between families b,-1 MSbl ' l U 1 u;~lDH+ ' 1 u 2 m p H ' + Within families b , ( ~ ~ - 1 ) MSWl 1' %BlDH 3-
B, population b2v2-l
Between families b,-1 MSb2 rlu2 u2 BBIDH
+
+1+
r1 (12 + u t
Within families b 2 ( u 2 - l ) MSW, W B P H
Likewise, the estimates of uiBZDH and u & ~ , ~ ~ can be obtained as
-
- 2-
- 2 The presence of linkage is confirmed if G;,,,,significantly greater than their respective sampling errors.
uBBpH or i3&BlDEI ulvB2DIr is
1
I n the absence of additive epistasis,
-
2
aiBlD,
- u & - ~2 ~uiBZDH-
utvBpH = +- r(1--27) d,da.
Thus, in the absence of gene interaction, the above relationship can provide US indications of the parental configuration and of the presence or absence of link- age. Further, a weighted mean of recombination values can be estimated from the equations of U;, uiBIDH and
ugBIDH
o r of U;, uiBSDH and uLBPH.
When linkage is absent, additive and additive
x
additive variances may be esti- mated from either of the two backcrosses. If is the summation of effects of( d +-
-
1i)
,
then in a multiple-locus system, 21 1
1 1
-
- _
u&lDH 4 u i ( i )
+
3
-
~ 2 W B p w
-
u2,(i,+
3
.
Thus,
and
1 1
[I,
( M S W ,-
MS,)s
f
-
rl (MS,, - MS,)]
V( 3:) '= 16V (
,+
16V ( SiBZDH)4-
V ( )+
V ( 6kSpH ).
Apparently, the sampling variances of 3: and S i A are larger in the backcross ap- proach than in the F, approach. Therefore, it is recommended that if estimation of genetic variances is the main objective of the experiment, then doubled haploids produced from F, plants instead from the backcrosses should be used.
It is not possible to obtain estimates of additive and additive
x
additive genetic variances that are free from linkage effects by the backcross approach when link- age is present. However, they can be obtained using diallel crosses provided that genes in the parents are at linkage and Hardy-Weinberg equilibria and either of the following two conditions is true: (1) gene frequencies of one-half at each locus and no homozygote X heterozygote interactions for all pairs of loci, and (2) no dominance at each locus and no homozygote X heterozygote interactions and no heterozygote X heterozygote interactions for all pairs of loci (CHOO 1981). Estimation of the number of segregating gdnesAssuming equal genic effects, CHOO and REINBERGS (unpublished) showed that the number of segregating genes pertinent to a quantitative character can be estimated by dividing the square of the deviation of the most extreme doubled haploid from the population mean by the genotypic variance of doubled haploids. They also determined that, with an F,-derived doubled-haploid population, the estimated number of genes obtained in such a way is biased in the presence of additive epistasis. Further, they found that, with linkage, the number is under- estimated if doubled haploids are produced from a cross of two preponderantly associated parents, and it is overestimated if doubled haploids are produced from a cross of two preponderantly dispersed parents.
extreme doubled haploid and thus increases the accuracy of the deviation. There- fore, to obtain a better estimate of the number of segregating genes, one should produce doubled haploids from F, rather than from
F, plants.
DISCUSSION
When diploid materials are used for quantitative genetic studies, it is common to assume that linkage and epistasis are absent in the materials i n order to in- terpret the experimental results of the studies. These unrealistic assumptions are no longer required when doubled haploids are used for studying quantitative inheritance. Furthermore, not only can epistasis and linkage be detected, but also the types and the amount of additive epistasis, as well as a weighted mean of recombination values, can be estimated. Knowledge of additive epistasis and linkage are of value in improving the efficiency of the conventional breeding meth- ods. If additive epistasis is important, selection should not be too intensive in early stages of a breeding program in order to allow desirable epistatic combina- tions to come together; a large population size is needed when genes are tightly linked. Such knowledge is particularly useful for the doubled-haploid breeding method, since there is only one chance f o r recombination. In case of tight linkage and high additive epistasis, a large number of doubled haploids should be pro- duced from F, plants for the sake of obtaining the best recombinant. The prob- ability of obtaining the best recombinant can also be enhanced by producing doubled haploids from plants in later generations. The former approach requires more effort and facilities, but the latter requires longer time for producing doubled haploids. Therefore, the choice between the two approaches depends upon the availability of resources and the urgency of needs of the plant breeder.
For the latter approach, one would certainly wish to know the optimum stage at which doubled haploids are produced from a single cross. In practice, a plant breeder hybridizes two parental lines in the hope of obtaining a n inbred line that combines most of the desirable alleles from the two parents. Therefore, genes of the parents are usually dispersed. Suppose that two parents, A A bb and aa BB, are crossed, then the respective frequencies of the best recombinant ( A A B B ) i n the
r 1
Fl-, F2-, and F,-derived doubled-haploid populations can be shown to be
-
-
2'
4
1 8
(31.--21.') and
-
( 7 r - W+
4 r 3 ) , respectively. Differences in the frequency ofA A BB in the three populations under various recombination values are illus- trated in Figure 1. At T- = 0 and T- = 0.5, the three populations have the same
m m a a
U
0
0
z
w 3
U
U
W
U
0 0.1 0.2 0.3 0.4 0.5
RECOMBINATION VALUE (r)
FIGURE 1.-The frequency of the best recombinant (AABB) in the F,-derived (solid line), F,-derived (broken line), and F,- derived (broken line with dots) doubled-haploid populations under various recombination values.
less opportunity for recombination than the conventional breeding methods for self-pollinating crops.
The relative efficiency between F,-derived and F2-derived doubled-haploid pop- ulations can be measured in this way. Let nPl and be the sizes of the former and latter populations, respectively. In order to obtain at least the same number of A A BB individuals as in the F,-derived population, 7 . ~ ’ ~ must be equal to (-- r )
n’,. For instance, at r
=
0.04, a size of 100 (= n’,) is required to obtain 2.92 A A BB individuals in an F,-derived population produced from a cross of two dis- persed parents. For an F,-derived population, 146 doubled haploids should be pro- duced if one expects to obtain 2.92 A A BB individuals. An increase in the number of doubled haploids from F1 plants demands more input of manpower and fa- cilities and, furthermore, increases the costs of seed and field tests. I t is thus less desirable than using doubled haploids from F, plants under the tight linkage con- ditions.Few studies, if any, have been conducted to detect the linkage between quanti- tative characters. Until now, there has been no biometrical method proposed for estimating average recombination value. No information is thus available in the literature on average recombination value for quantitative traits. Information on the linkage of quantitative characters is useful for increasing the efficiency of doubled-haploid and other breeding methods. The methods given in this paper
3
for detecting linkage and for estimating average recombination value are un- doubtedly of value for such studies.
The F,-derived doubled-haploid population has a higher frequency of the best recombinant than does the F,-derived one when linkage is present. It is possible to estimate additive and additive x additive genetic variances and provide a good estimate of the number of segregating genes using F,-derived doubled haploids. This assists the breeder in developing effective breeding strategies and procedures. Furthermore, selection efficiency can be increased by using index selection in a n F,-derived doubled-haploid population. The selection index can be constructed on the basis of the performance of both family and individual line.
The backcross approach for estimating average recombination value is simpler and requires less labor than the diallel approach ( CHOO 1981 )
.
More importantly, no major assumptions are needed as with the diallel approach. However, with the backcross approach, the variation of recombination values cannot be measured. The author is grateful to G. C. C . TAI, Research Station, Agriculture Canada, Fredericton, New Brunswick, and the reviewers for their valuable suggestions and critical review on this manuscript.LITERATURE CITED
CHOO, T. M., 1981
COMSTOCK, R, E. and H. F. ROBINSON, 1948
Doubled haploids for estimating mean and variance of recombination values. Genetics 97: 165-172.
The components of genetic variance in populations of biparental progenies and their use in estimating the average degrees of dominance. Bio- metrics 4: 254-266.
CRUMP, S. L., 1946 The estimation of variance components in analysis of variance. Biometrics
FISHER, R. A., F. R. IMMER and OLOF TEDIN, 1932 The genetical interpretation of statistics of tha third degree in the study of quantitative inheritance. Genetics 17: 107-124.
GAMES, P. A., H. J. KESELMAN and J. J. CLINCH, 1979 Tests for homogeneity of variance in factorial designs. Psychol. Bulletin 86: 978-984.
Ho, K. M. and G. E. JONES, 1980
JOHNS, W. A., 1974 A preliminary evaluation of haploidy as a breeding technique in barley
KASHA, K. J. (ed.), 1974 Haploids in Higher PZants. The ofice of Continuing Education, Uni-
MATHER, K. and J. L. JINKS, 1971
SIEGEL, S., 1956 Nonparametric Statistics f o r the Behavioral Sciences. McGraw-Hill Book Co., Corresponding editor: B. S. WEIR Bull. 2: 7-11.
Mingo barley. Can. J. Plant Sci. 60: 279-280.
( H . vulgare L.). Ph.D. Thesis, Univ. of Guelph, Guelph, Ontario. versity of Guelph, Guelph, Ontario.
Biometrical Genetics. Cornell Univ. Press, Ithaca, N.Y.