SELECTION FOR BODY WEIGHT IN
THE
MOUSEAT
THREE TEMPERATURES
AND
THE CORRELATED RESPONSE IN TAIL LENGTHR. L. BAKER1 AND F. R. M. COCKREM2
Massey Uniuersiiy, Palmerston North, New Zealand
Received April 29, 1969
ALCONER and IATYSZEWSKI ( 1 952) and FALCONER ( 1960a) have pointed to Fgenotype-environment interactions in mice based on the comparisons of 6-
week body weights of progeny reared under planes of nutrition the same as and different from those under which their ancestors were selected. The growth per- formance af two lines of mice whose ancestors had been selected for increased body weight under high and low planes of nutrition was compared, and then the progeny of each line reared together in both environments were compared. In both these studies it was shown that the line of mice selected in the low plane of nutrition was the superior of the two lines when tested in both environments.
FALCONER (1960a) also selected for decreased body weight on high and low planes of nutrition and in a similar way tested growth performance in both environ- ments. The result was then reversed, i.e., the mice selected on the high plane were more adaptable when reared in both environments. These studies also showed that mice whose ancestors had been selected for increased body weight in a low plane of nutrition and then reared on a high plane had less fatty tissue than mice from a high plane line when both were reared under high plane conditions. These findings represent a genotype-environment interaction for the character body weight which was selected for directly and for the correlated response of the character amount of carcass fat.
This study is concerned with the correlation between body weight and tail length in mice.
FALCONER
(1954) has shown that in a standard laboratory environment, body weight has a high positive genetic correlation with tail length at six weeks of age. COCKREM (1959) has developed by selection the combinations of short-tailed, high body weight mice and long-tailed, low body weight mice, relationships opposite to those predicted by the genetic correlation in the foundation stock. It has been shown that the mouse tail grows longer at high temperatures (HARRISON, MORTON and WEINER 1959) and that a reduc- tion in tail length occurs at low temperatures (BARNETT 1965a). HARRISON,MORTON and WEINER (1959) suggested that the long hairless tail surface of mice reared in a hot environment may be of adaptive significance for heat loss and thermoregulation. However, COCKREM ( 1963) and BARNETT ( 1 96513) did not
Present address: Department of Genetics, University of Wisconsin, Madison, Wisconsin.
a Present address: Forest Research Institute, Rotorua, New Zealand.
506 R. L. BAKER A N D F. R. M . COCKREM
find that mice with genetically longer or shorter tails had an adaptive advantage as reflected by body weight at high or low temperatures, respectively. Thus these authors concluded that the tail length of mice does not have a genetic thermoregulatory function.
If tail length is of adaptive significance, then its correlated response to selec- tion for body weight might be expected to differ at different temperatures. The experiments described in the present paper were designed to test this possibility and also to obtain further information on genotype-environment interactions in the mouse.
MATERIALS A N D M E T H O D S
The mice used in the present study came from the LCA and LCB lines which had been se- lected for short tails and high body weight and vice versa (COCKREM 1959). These lines had been maintained with some selection to the 35th generation, with an outcross to the Massey CBA stock at the 25th generation. The LCA and LCB lines were reciprocally crossed and selected for high 6-week body weight for two generations and then after random breeding for three generations, they formed the foundation population for the selection experiment.
Three environments were used in this study. The medium environment (19-23°C) was that of the standard mouse room. In the hot environment (29-33°C) cages were kept on hot plates, controlled by a thermostat in standard cages. The cages were moved cyclically to different posi- tions on the same and different plates daily. The cold environment was i n a separate room a t 6 4 ° C . Lighting followed the normal seasonal cycle in all environments. Lighting was natural in the hot and medium environments but was artificial (controlled by an outside photo-cell) i n the cold room. No information could be found in the literature on the interaction of light (artificial us.
natural) and temperature on body weight in rodents. In all environments the mice were kept in plastic cages with wood shavings as the bedding. Food pellets and water were provided ad Zibitum. Experiment I : Selection lines for high 6-week body weight were established in each tempera- ture. From the base population of ten families, eight pairs of mice were obtained at random to form the So generation for each environment. Random allotment was restricted such that of the eight mice of each sex at least one member of each of the base population families would be represented in each line. Mass selection started with the offspring (SI) of the S, populations. The eight heaviest animals of each sex were selected from the dams’ first litters (within litter selec- tion not practiced). Control lines were kept in the medium and cold environments each consisting of eight pairs of mice. Space was not available for a hot control line. The medium environment controls originated from the base population, while the cold controls were started in generation 2 (S,) as a random sample from the medium control line. In each control line parents were chosen at random. In all five lines the selected mice were mated a t random with the avoidance of sib mating. Two additional matings were made for each line each generation and these were just used when infertile matings occurred. The number of mice in the litter was not standardized a t birth. Mice were weaned at three weeks of age and families were then randomly allotted within sexes to storage cages (6 mice per cage). In the cold environment, constant numbers of mice from each family were housed per cage to minimize and randomize possible effects from huddling and nesting behavior. In the hot and medium environments the restriction on random allotment was that all the mice in one cage could not be from one family.
Because of impaired fertility in the hot environment the hot line was mated in the standard environment and females placed in the hot environment four days after parturition. The off- spring were returned to the standard environment after the 6-week measurements were made. The 6-week weights of these offspring did not differ from those of trial mice kept in the hot en- vironment during mating and pregnancy.
T E M P E R A T U R E A N D SELECTION RESPONSE 507
hair and digestive tract contents) by diethyl ether in a Soxhlet extractor. These extractions were done on six males and six females from each line.
Experiment 2: Mice from the second litters of S, of each of the five lines were placed at random into the three temperature environments for rearing from four to seven weeks of age. There were five males and five females in each group. Tail lengths and body weights were re- corded at four and seven weeks of age. Mice were weaned a t three weeks of age but were not moved to another environment for one week to avoid additional stress. This change of experi- mental design from experiment I to experiment I1 (i.e., the 4-7 week gain in weight as compared to the 3-6 week gain) could not be avoided because of the mortality resulting from switching environments, particularly to the cold, at an age earlier than four weeks. Since deaths are most frequent in lighter animals (BIGHAM 1965) natural selection could have invalidated the results. Inbreeding: The effective population size, Ne, was calculated from the formula of GOWE, ROBERTSON and LATTER (1959) :
1/2N, = 1/22n f N ~ 2 , ~ / 2 ( Z n ) *
where N is the number of potential parents from which n gametes are sampled with variance uZn.
Inbreeding was then estimated as AF = 1/2N,. Inbreeding was also estimated by pedigree analy- sis (WRIGHT 1922). The formula of GOWE, ROBERTSON and LATTER allows for the fact that under artificial selection, parents may not have equal pTobability of leaving offspring and that the distribution of family size may not be Poisson.
Genetic correlations: The method of FALCONER (1954) was used to calculate genetic correla- tions.
Correlated response in tail length h,, ugqo
r , =
x - x -
Response for body weight h,, ut2
where: the direct response of body weight and the correlated response of tail length are expressed in grams and centimeters per generation, respectively (each being obtained from their regres- sions on generation number), h,, is the square root of the realized heritability for body weight estimated for all selection lines, h f T is the square root of the realized heritability for tail length. Since no value for htt was available from these data, a value of d 0 . 6 (FALCONER 1954) was used. The standard deviation of body weight (ubw) and the standard deviation of tail length (uti) were estimated from data for all lines.
RESULTS
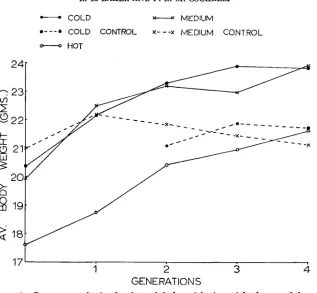
Experiment 1: A . The response of body weight to selection. Figure 1 shows the overall (unweighted mean of the two sexes) line means for the four gen- erations (response to selection was similar in males and females). Although the hot environment depressed body weight, an increase in weight occurred in all environments with a deviation from the respective control lines in the medium and cold environments (no control in the hot environment). The mean weighted and unweighted selection differentials and realized heritabilities are given for each sex and selection line in Table 1. The correspondence between the un- weighted selection differentials and the selection differentials weighted by the offspring born and by the number of offspring alive at 6 weeks suggests that natural selection (acting either prenatally or postnatally) was not of importance in this experiment.
508 R. L. BAKER A N D F. R. M. COCKREM
-
COLD x--x MEDIUM* - - - e COLD CONTROL x- - - x MEDIUM CONTROL
-
HOTI
1 2 3 4
17’
GENE RAT ION S
FIGURE 1.-Response to selection for six week body weight (unweighted mean of the sexes).
TABLE 1
Genetic parameters for body weight estimated from the selection results
Selection line
Hot Medium Cold
Item d 0 d ? d 0
Mean weighted
Mean unweighted
Realized heritability+
AF/generation$ 0.07 0.09 0.07
selection differential* 1.86 1.48 2.46 1.93 1.89 1.56
selection differential 1.89 1.M 2.50 1.87 1.83 1.54 0.67 f 0.06 0.602 0.08 0.41
*
0.05 0.33 f 0.22 0.54+ 0.12 0.49 f 0.07* Weighted by the number of offspring born. Weighting by the number of offspring alive at 6-weeks gave estimates for males and females, respectively, of: Hot-1.81, 1.47, Medium-2.45, 1.87, Cold-1.93, 1.56.
t
Estimated from the regression of response on cumulated weighted (number of progeny born) selection differential.TEMPERATURE A N D SELECTION RESPONSE 509
nificantly different from the value in the hot environment but was larger
(P = 0.12) than the value in the medium environment.
Realized heritability was also estimated by calculating the response to selec- tion as a deviation of the medium and cold selected lines from their respective control lines. In the medium environment this resulted in estimates of 0.35 f .08
for males and 0.44 i .19 for females while in the cold environment estimates
were 0.53 L .13 for males and 0.44 f .14 for females. Similar estimates were not available in the hot environment since no control line was kept there. The overall realized heritabilities (sexes pooled) in medium and cold environments were 0.38
*
.09 and 0.49 +- .09, respectively. The estimates of realized herita-bility in the cold environment obtained in this way are not as reliable as those from the medium environment since the cold control line was only present in the S,, S, and S, generations and interpolated values (the mean of S,, S, and S,
means) were used for control line means in the So and S, generations.
The change in inbreeding per generation ( A F ) is also given in Table 1. It did not differ markedly between the three selection lines. The A F estimate in the control lines was 0.05. The genetic base available in this ,study was con- siderably narrowed since mass selection resulted in the elimination of several families each generation. This resulted in an average
N e
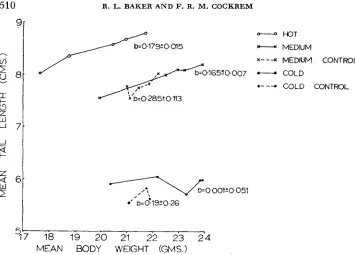
(harmonic mean) per generation of about seven i n the three selected lines and about ten in the two control lines. These values may be compared to the actual number of parents mated per generation which was sixteen (i.e., eight pairs).B. Correlated responses: Tail length at six weeks. The response in tail length resulting from body weight selection was similar for males and females so the overall line means of the sexes are shown in Figure 2. Tail lengths showed a correlated increase in the hot and medium lines (0.18 f .03 and 0.14
*
.04 cmper generation, respectively) but no significant change in the cold line (0.01 f
- - -
-
U
9
I
1 2 3 4
GENERATIONS
510 R. L. BAKER A N D F. R. M. COCKREM
=1 6 I-
5
6 -2
W
51l7 1 8 1 9 20 21 22 23 2'4
MEAN BODY WEIGHT (GMS.)
FIGURE 3.-Mean six week tail lengths plotted against mean six week body weights (un-
weighted sex means) for each generation with regression coefficients and their standard errors shown for each line.
.05 cm per generation) or either of the control lines (medium control -.07 +. .05, cold control 0.14 i- .05 cm per generation). The overall mean tail lengths for the sexes combined plotted against the overall mean body weights for each generation and all lines are shown in Figure 3. The regression coefficients are also given in the figure. It can be seen that correlated increases of tail length occurred, except in the cold environment. The relationship between body weight and tail length in the medium control line was positive but not significantly different from zero (P = 0.09). If this positive relationship is interpreted as being real then it most likely reflects the positive environmental correlation between body weight and tail length which FALCONER (1954) estimated as being in the range of 0.26 to 0.41. There was a positive phenotypic correlation (about 0.50) between tail length and body weight within each generation for all lines.
TABLE 2
Realized genetic correlations between 6-week tail length and bady weight in the three environments
Selection line
Sex Hot Medium Cold
Male Female
0.69 0.91 -0.03
T E M P E R A T U R E A N D SELECTION RESPONSE 511
The genetic correlations between 6-week tail length and body weight in the three selection lines are presented in Table 2. The extent of the response and correlated response was estimated by the appropriate regressions of body weight and tail length on generation number. Realized heritabilities for body weight (Table 1 ) were used in calculating the genetic correlations. The heritability of tail length was taken as 0.6 (FALCONER 1954). No genetic correlation between body weight and tail length was observed in the cold selection line while in the other two selection lines there was reasonable agreement with the estimates of FALCONER (1954). I t should be noted that the realized genetic correlations esti- mated in this study will include an environmental component since absolute responses and correlated responses were used. This is in contrast to FALCONER’S
(1954) study in which he estimated his responses and correlated responses as deviations between up and down selected lines, thus removing most of the environmental trends over the selection period. Additional estimates of realized genetic correlations can be made in this study by utilizing the control lines in the medium and cold environments. When the responses, correlated responses and realized heritabilities were estimated as deviations from a control line, the genetic correlation estimates in the medium line were 1.27 for males and 0.92 for females, while in the cold line the estimates were -0.09 for males and -0.15 for females. Confidence intervals are not available for these realized genetic correlations but these are presumably a function of the standard errors attached to each component part (i.e., responses, heritabilities and standard deviations). Although the confidence intervals are probably fairly wide with considerable sampling variation as shown by ihe genetic correlation greater than one, there is still considerable agreement between these estimates in a standard environ- ment and those estimated by FALCONER (1954). However all four estimates of genetic correlations in the cold line were virtually zero.
Fertility: Litter size (mice born dead o r alive in the first litter) did not change significantly over the four generations of selection in any of the lines. When averaged over all generations the mortality between birth and six weeks of age was 11.5% (as a percentage of live plus dead mice born) in the cold environ- ment, 10.3% in the hot environment and 5.0% in the medium environment. There was also a longer interval between pairing and the birth of the first litter in the hot and cold environments.
512 R. L. BAKER A N D F. R. M. COCKREM
weight because of litter size differences was unlikely to be more than 0.4 grams, assuming that between-line and within-line regressions are approximately simi- lar.
Weaning weight: There was a small correlated response in weaning weight to six week weight selection in all the selected lines showing as a positive deviation from the control lines in the medium and cold environments. Phenotypically, the hot environment led to lower weaning weights.
Fat content: The mean live weights, carcass weights, fat extracts and the percent fat are given in Table 3 for each line and sex. The means of fat weight adjusted by covariance for carcass weight are also given in Table 3. Analyses of variance of fat content and of covariance adjusting for carcass weight showed significant differences between lines within both males and females. These differences arose from the hot line mice having more fat both in absolute terms and relative to carcass weight. I t would appear from the table that the increase in body weight is due more to increased fat than to muscle when selection was practiced in the hot and cold environments.
It should be noted from this table that the mean live weights of the male mice sampled from the selected and control lines in the medium environment were very similar in contrast to the positive deviation in live weight in favor of the selected line illustrated in Figure 1. The mean live weight of the male mice sampled from the hot line was also higher than the hot line mean shown in Figure 1 at generation four. These values were most likely due to the small samples taken.
C . Standard deviations: In several lines variances for both body weight and tail length were heterogeneous between generations. However, to obtain esti- mates of mean variances these were averaged over generations within males and females. Standard deviations for six-week body weight and tail length for all lines and both sexes are presented in Table 4. Variances of both body weight and tail length were heterogeneous between lines but since there was also heterogeneity between generations within lines no specific tests of differences were made.
TABLE 3
Mean live weight (grams) carcass weight (grams) and fat content (grams) for mice at six weeks of age (six 8 and six 0 of each line) *
Line
Adjusted fat Live weight Carcass weight Fat weight Fat percenq weightf
d ? a ? d ? d ? a ?
Hot sel. 24.6 19.5 21.8 17.6 2.47 2.35 11.3 13.4 2.36 2.13
Medium sel. 25.1 20.8 22.0 18.4 1.74 1.87 7.9 10.2 1.63 1.74
Medium control 25.8 19.6 21.5 16.6 1.58 1.28 7.4 7.7 1.55 1.21
Cold sel. 25.2 21.3 21.3 17.9 1.84 1.75 8.6 9.8 1.82 1.67
Cold control 23.6 18.9 19.8 15.6 1.43 1.33 7.2 8.5 1.68 1.55
SE . . . . . . . . . . . . 0.20 0.20 . . . . 0.18 0.18
* Hot line mice from generation S,. All other lines from generation S,.
t
Fat percent = Fat weight/carcass weight.TEMPERATURE AND SELECTION RESPONSE 513
TABLE 4
Standard deviations for males and females averaged over generations at six weeks for weight ( g r a m ) and tail length (em)
Trait
Selection line
L
Hot Medium Cold
Control line
Medium Cold
8 1.87 2.17 1.80 1.95 2.63
0 1.56 1.61 1.40 1.51 1.67
8 0.45 0.35 0.38 0.34 0.41
0 0.40 0.31 0.37 0.29 0.41
Weight
Tail length
D. Analysis of generation 4: Table
5
presents the means and standard devia- tions from the analyses of variance of three and six week body weights and tail lengths in the fourth generation for male mice (females showed similar results). The table covers the analyses between environments for the three selection lines and the 2 X 2 factorial analyses-two lines (selected and control) and two environments (medium and cold). The standard deviations shown in Table 5 are the square root of the appropriate error mean squares.Body weight at six weeks was similar in the cold and medium environments but significantly less in the hot environment. Tail lengths differed in all the three environments and the three 6-week tail lengths were all significantly different. The important analytical result was the interaction between the con- trol and selected lines for the medium and cold environments. This interaction
TABLE 5
Mean body weight ( g r a m ) and tail length (em) at S, with the standard deviations ( S D ) from the analyses of variance (male mice)
Selection line Control line
Trait Hot Medium Cold SDt P Medium Cold SDt PS
3-week
body weight 10.9 12.8 10.2 1.4 ** 10.8 9.7 1.4 I**
6-week
body weight 23.6 26.6 26.1 1.5 * * 23.1 23.6 2.0 L**
3-week
tail length 6.8 6.6 4.9 0.4 * * 6.0 4.9 0.3 I**
6-week
tail length 9.0 8.4 6.0 0.3 ** 7.6 5.8 0.4 I**
Numberofmice 25 25 30 . . . . 22 29 . . . . ,
t
From within selection lines 77 df$ From 2 x 2 analyses 102 df within lines and treatments. Interaction term included in the
** P <O.Ol For test of selection line mean differences L** Line difference P <O.Ol
I** Interaction P <O.Ol
514 R. L. BAKER A N D F. R. M. COCKREM
occurred for 6-week tail length but not 6-week body weight and resulted in a correlated response of tail length in the medium environment only. These ana- lytical results are illustrated in Figures l and 2.
Covariance analyses, adjusting 6-week variables for 3-week variables or 6-
week tail length for 6-week body weight, did not alter these conclusions. These analyses did, however, show that mice in the cold environment gained more weight from 3-6 weeks after adjusting for initial differences in weight at three weeks. Thus both the cold and hot environments caused lower weaning weights but this effect on growth continued in the hot environment only.
Experiment 2: Two sets of analyses were carried out in this experiment. ( 1 ) The effects of the three environments on the performance of three selection lines were tested in a 3 x 3 analysis of variance and covariance including the interaction term, (2) each pair of selected and control lines in the cold and medium environments whose performance was tested in all three environments was analyzed in a separate 3 x 2 design with the interaction term included. These two sets of analyses were necessary as all means could not be tested in one orthogonal analysis. This was due to the lack of a control line in the hot environment and because the presence or absence of the various interactions in the models were essential hypotheses for testing.
A. Analysis of data from the three selected lines reared in each of the three
TABLE 6
The mean body weight (gram.) and tail length (em) at 7-weeks for the selected and control lines in the three enuironments
Line
Hot Medium Cold
d” P d P
Sel. Control Sel. Control Sel. Control Sel. Control
d P
4-7 week environment: Selected
7-week body weight
Hot 24.2 20.2 25.0 23.8 20.8 19.5 25.3 23.4 20.5 20.9
Medium 28.6 21.3 26.5 25.9 22.1 20.2 25.9 25.7 23.1 21.8
Cold 28.0 22.9 27.3 27.5 22.4 21.2 27.8 25.9 22.4 22.2
Standard deviation$ . . 1.2 1.6 1.1 1.3
Mean diff. sel.
>
controls . . 0.53 (3.5) 1.47*(2.1) 1.33**(2.4) 0.37 (1.6)
7-week tail length
Hot 9.16 8.46 8.58 8.32 8.46 8.14 7.62 7.70 7.36 7.54
Medium 8.52 8.14 8.16 7.89 8.00 7.64 6.78 6.66 6.76 6.80
Cold 8.22 8.12 7.74 7.28 7.54 7.36 5.98 6.12 6.06 6.06
Standard deviation$ . . 0.33 0.26 0.28 0.38
Mean diff. sel.
>
controls 0.35** (0.78) 0.29**(0.56) -0.03 (0.25) -0.07(0.07)
t
All environmental effects were significant (P<O.Ol) except Q body weight for the medium$ Each standard deviation is from a 3 x 2 analysis of variance (24 df) lines. There were no significant interactions (P>O.O5)
* P<0.05
* * P<O.O1
T E M P E R A T U R E A N D SELECTION RESPONSE 515
environments: The 3 x 3 analysis of variance of 7-week body weights (Table 6)
for males and females showed that mice of all three selected lines in the hot environment weighed significantly less than mice of the same three lines in the cold and medium environments. There was no significant interaction. For 7-week tail length, there were highly significant (P
<
0.01) line and environment differences and also a significant interaction. This interaction was one of mag- nitude alone. Thus the line differences were not the same between different environments with the greatest differences between environments being shown by the cold line. The line differences were such that the hot line had the longest tails and the cold line the shortest tails in all three environments with the medium line being intermediate between these lines. The environmental effect caused all three selection lines to have longest tails in the hot environment and shortest tails in the cold environment with tail length being of intermediate length in the medium environment.At four wezks, body weights were lower in the hot line in each environment and tail lengths were significantly different among all lines in each environ- ment (Table 7). These line differences in tail length could have resulted from selection or from the original environment in which the mice were reared to four weeks.
Because of these differences, the 7-week values were adjusted by covariance for the 4-week values. The resulting adjusted means are given in Table 8 and the unadjusted values are shown in Table 6. The adjusted weights are presented as adjusted gains from 4- to 7-weeks for ease of interpretation (Table 8).
The adjusted weight gains were different between the three selected lines
( 8 P < 0.01, 0 P = 0.11) and the three environments ( 8 and 0 P < 0.01). All three selected lines showed decreased weight gains in the hot environment com- pared to weight gains in the other two environments. The interaction term in males (P = .IO) was due to no difference in weight gain between lines in the hot environment but positive differences in favor of the hot line (and to some
TABLE 7
The mean body weight (grams) and tail length (em) at 4-weeks for the selected and control lines in the three environments
Line
Hot Medium Cold
d d P
sel. Control sei. 'control Sel. Control sel. control
d ?
Environment Trait Selected
Body weight 16.7 14.5 18.1 18.0 16.7 16.1 18.2 15.7 15.9 16.4
Taillength 7.96 7.40 6.80 6.62 6.98 6.74 5.04 5.02 5.10 5.20
Hot
Body weight 17.6 14.2 18.6 18.3 16.3 15.2 17.6 16.6 16.3 14.0
Tail length 7.94 7.40 6.94 6.70 6.96 6.64 4.96 4.98 5.12 5.18
Medium
Body weight 17.6 15.8 18.7 18.5 16.1 15.8 18.7 18.3 16.0 15.1
Taillength 7.80 7.76 6.94 6.70 6.90 6.80 5.08 5.32 5.10 5.12
516 R. L. BAKER A N D F. R. M. COCKREM
TABLE 8
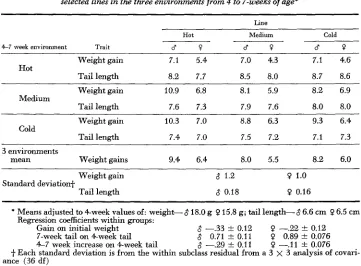
The adjusted mean weight gains (grams) and adjusted m a n tail lengths (cm) for the selected lines in the three environments from 4 to 7-weeks of age*
Line
Hot Medium Cold
4-7 week environment Trait d o d ? d ?
Weight gain 7.1 5.4 7.0 4.3 7.1 4.6
Tail length 8.2 7.7 8.5 8.0 8.7 8.6
Hot
Weight gain 10.9 6.8 8.1 5.9 8.2 6.9 Medium
Tail length 7.6 7.3 7.9 7.6 8.0 8.0
Weight gain 10.3 7.0 8.8 6.3 9.3 6.4
Tail lendh 7.4 7.0 7.5 7.2 7.1 7.3
Cold
3 environments
mean Weight gains 9.4 6.4 8.0 5.5 8.2 6.0
Weight gain 8 1.2 0 1.0
Standard deviation+
' Taillength 8 0.18 0 0.16
* Means adjusted to Cweek values of: weight-818.0 g 0 15.8 g; tail length-8 6.6 cm 0 6.5 cm
7-week tail on 4-week tail 8 0.71 f 0.11 0 0.89 f 0.076
+
Each standard deviation is from the within subclass residual from a 3 x 3 analysis of covari- Regression coefficients within groups:Gain on initial weight 8 -.33
*
0.128 -.29
*
0.110 -.22 f 0.12
0 -.I1 f 0.076 4-7 week increase on 4-week tail
ance (36 df)
extent the cold line) in the medium and cold environments. This effect was not significant in females. The genetic effect (line differences) was such that the hot line mice and, to some extent, the cold line mice made greater gains (relative to a constant 4-week weight) in all environments than the medium line mice.
Seven-week tail lengths adjusted for 4-week tail lengths are also given in Table 8. Line, environment and interaction effects were all significant in both males and females. These differences between environments arose from the longer tails in the warmer environments and from a compensatory growth effect. This compensatory growth effect was such that the mice from the medium and cold lines increased their tail lengths more in the hot environment than did mice from the hot line. This effect is shown graphically in Figure 4 which is discussed further in the next section. This effect of a greater increment of tail length for mice with initially shorter tails also occurred within the groups. This is shown by the appropriate negative regression coefficients in Table 8.
TEMPERATURE AND SELECTION RESPONSE
517
*
SELECTEDCONTROL
cold
medium hotI
4-WEEK TAIL LENGTH (CMS.)
FIGURE 4.-Unweighted means for the two sexes of seven week tail length plotted against 4 week tail length for all subgroups in the crossover experiment (see explanation in text).
females. The selected line had longer tails in all three environments. The differ- ences in 4-week weight between the medium line and their controls and the cold line and their controls points to a correlated effect of 6-week weight selection on 4-week weight.
The 7-week body weights and tail lengths are shown in Table 6 (including the hot line values for overall comparison). From the analyses of variance ( 3
x
2 factorial design) there were no significant interactions between lines and environments in any of the eight combinations analyzed (three environments with medium and medium control and with cold and cold control for body weight and tail length in males and females) i.e., there were similar effects between selected and control lines in each of the three environments.518 R. L. BAKER A N D F. R. M. COCKREM
sampling as each mean involved only five mice. All the environmental effects were highly significant except one (Table S), for both body weight and tail length with both control lines showing the same effects as the selected lines, i.e., lower weights and longer tails in the hot environment. Covariance analyses adjusting these 7-week values for 4-week values or adjusting 7-week tail lengths for 7-week body weights did not change any of these results. It was concluded that actual body weight differences between selected and control lines (cf. adjusted weight gains discussed previously) were similar for both the environ- ments in which the mice were selected and those in which they were reared. For tail length, however, there was no response (measured as the difference between selected and control line values) from mice selected in the cold environ- ment when reared in any of the three environments.
The tail length effects for all lines and environments are summarized in Figure 4 which shows the means for the two sexes of 7-week tail length plotted against 4-week tail length.
This figure illustrates the conclusions froin the analyses of tail lengths shown in Tables 6 and 8. The classification on the X-axis (cold, medium, hot) refers to the environment in which the mice were reared from birth to 4 weeks of age. This is the same as, i.e., confounded with the environment in which the previous four parental generations were selected. The relative positions on the Y-axis (hot, medium, cold) are the environments in which mice were reared from 4 to 7 weeks of age. The control means in the cold and medium environments (X-axis) have been joined to give reference lines. The average slope of these lines corresponds (about 0.8) to the regression within groups (Table 8 ) .
Phenotypically, the shorter the tail length at 4 weeks, the greater was the in- crease when the mice were transferred to an environment more favorable for tail length growth (i.e., warmer environments). This is shown by the differing slopes of the lines and illustrates the cause of the interaction found in the analysis of 'Table 6 ( 3 selection lines X 3 environments).
Results from the 3 x 2 analyses in Table 6 for tail length are illustrated in Fig- ure 4 by the coincidence of 7-week tail length selected and control means for all 4-7 week temperatures (Y) for those mice selected in the cold (X)
.
Th' is contrasts with the consistent difference (selected>
control on the Y-axis) for those mice selected and initially reared in the medium environment (X axis).DISCUSSION
Restrictions of space prevented an ideal plan of experiment and hence a straight- forward analysis of the data. However, the various combinations of analyses gave a clear picture of the result; of selection and the correlated responses.
Selection for six-week body weight was effective in all three temperature en- vironments but the realized heritability was greater in the hot environment al- though this environment depressed body growth. The realized heritability of 6-
TEMPERATURE A N D SELECTION RESPONSE 519
that these estimates are only for the first four generations of selection. Response to selection is usually nonlinear with a gradual decrease in response in later gene- rations of selection (MACARTHUR 1949; FALCONER 1960b). The realized heritabil- ity of 0.32
*
0.04 calculated from the first six generations of selection by FAL- CONER (1954) was very similar to the estimates found here in the medium en-vironment over four generations of selection. When a sample of mice from all five lines were reared in each of the three environments in a crossover experiment, actual weights were similar but relative weight gains were greater for mice se- lected in the extreme environments. This showed particularly for the ‘worst’ or hot environment. Thus a genotype-environment interaction occurred for body weight in males but was only clearly revealed by estimation in terms of a com- ponent, weight gain, when the environments were switched.
If the mice had been reared from birth in the two environments other than that in which they were selected, mice selected in the hot would have been ex-
pected to be the heaviest in the cold and medium environments. This could not be tested because of mortality resulting from switching environments, particularly to the cold, at an earlier age than four weeks. These deaths occur in the lighter animals
(BIGHAM
1965) and such a selection effect could have invalidated the results.This difficulty of experimental design also applied to the tail length results but the appropriate analyses showed that the cold environment prevented the corre- lated response which genetic correlations (FALCONER 1954; COCKREM 1959) might have suggested. That this was a genetic effect was shown by the lack of difference in selected and control lines selected in the cold but switched to the other environments.
520 R. L. BAKER A N D F. R. M. COCKREM
Evidence on vasodilation levels in the tail of the rat and their relationship to heat loss and acclimation (THOMPSON and STEVENSON 1965, 1966; RAND, BUR- TON and ING 1965) suggest that simple explanations of the tail as a heat radiator with its effectiveness proportional to its length (HARRISON et al. 1 x 9 ) are inade- quate. The results of the present experiment indicate that tail length reflects some adaptive function in relation to environmental temperature but the underlying physiological situation may be complex. For example, the physiological balance required for increased body growth in the cold could require greater catecholam- ine secretions for a greater metabolic rate with resulting vasoconstriction and lower mitotic rates in the tail (HEROUX 1959,1960). This could mean the involve- ment of different genes than those required for body weight increases at other temperatures. A somewhat analogous situation has been suggested for wool growth on the face of sheep which has a genetic correlation with fertility and body weight. However, the relationship only holds for particular ambient temperatures as the basic physiological mechanism probably acts through the control of blood supply
(COCKREM 1967; COCKREM and MCDONALD 1969).
The existence of larger proportions of fat in the carcasses of the hot line, and the differences in body composition found in high and low plane selection experi- ments (FOWLER 1958), also show that the interpretation of body weight data themselves is not straightforward.
Two general points arise from this work; the first concerns the choice of en- vironment or range of environments in which phenotypic selection for a particular trait is going to give the greatest progress.
The discussions of experiments on this subject usually imply that some general rule can be determined from them. For example, “neither of the lastest experi- ments places any genetic restrictions on the choice of environment available for selection. However, they do not so much contradict FALCONER’S recommendations as remove their limitations,” DALTON (1967). This refers to an experiment on selection on two planes of nutrition which indicated that selection in either en- vironment was equally effective for performance in either environment. This was in contrast to the result of FALCONER (1960a)
,
the present results for a hot en- vironment and those of HARDIN and BELL (1967) for Tribolium, which all sug- gest that selection in ‘unfavorable’ environments would be better for all environ- ments. However, the results of PARK et al. (1966) and KORKMAN (1961 ) would lead to conclusions similar to those of DALTON (1967).The differences in these conclusions could arise from sampling variations in the few selection lines involved or the different species employed. However, it seems more likely that it is not possible to draw general conclusions on the genetic responses to selection of such complex characters as body weight. Apart from dif- fering responses in terms of such components as fat, the favorable balance of metabolic processes leading to a high body weight could differ for some environ- ments but not others. This could be affected by the actual composition and amount of the low plane diets and the details of the selection methods. Thus DALTON
TEMPERATURE A N D SELECTION RESPONSE 52 1
fertile (DALTON, personal communication) which makes generalization of doubt- ful value. KORKMAN’S (1961) low plane diet was at a lower level than
FALCON-
ER’S ( 1960a) while
PARK
et al. ( 1966) used protein levels and restriction of intakeas their diet criteria. Thus all these experiments could differ in the physiological effects at the different environment levels. Examination of these effects and their genetic bases could be more rewarding than the estimation of more genetic pa- rameters based on complex characters.
The second main point concerns the lack of correlated response in an environ- ment different from that in which the initial genetic correlation was estimated (FALCONER 1954; COCKREM 1959). It is not possible to generalize from this, as prior knowledge of possible physiological relationships of tail length, temperature and body growth, and a prevous selection experiment ( COCKREM 1959), led to the use of these particular variables for this experiment.
Little work has been reported on the changes in genetic correlations in differ- ent environments. BROWN and TURNER (1 968) have reported changes in genetic correlations between wool characters in sheep estimated before and after selec- tion for one of the traits. There was considerable environmental fluctuation (due to drought in some years). ROBERTSON (1960, 1963) showed that selection for large body size in Drosophila on different synthetic diets may result in the presence or absence of a correlated response in the duration of the larval period (i.e., development time). These results led to a study of larval growth along these different developmental pathways (ROBERTSON 1964, 1966). Moreover, BOHREN, HILL and ROBERTSON (1966) concluded from a computer simulation study that “the validity of existing theory for the prediction of correlated re- sponses is likely to be much poorer than in the prediction of direct responses.”
Therefore, when selection plans are being formulated, it would not be wise to place much weight on estimates of genetic correlation. It appears likely from these and other results on mouse selection experiments that accurate prediction will depend on knowledge of the components of the traits concerned and the physiological processes involving them in relation to the expected environments. This knowledge, in conjunction with the genetic parameters, could then be used to formulate appropriate selection policies for the required environments.
The author wish to thank Professor A. L. RAE for helpful advice during the course of this study and Dr. A. B. CHAPMAN for reading the manuscript and making many valuable sugges- tions. We would also like to acknowledge E. ORMSBY, P. SUTCLIFFE and C. FAIRLESS for assistance with the care of the animals and Miss N. GORDON for assistance with the computer programs. This work was performed while one of us (R. L. B.) was working for a Masters degree and was funded in part by the New Zealand Wool Research Organization.
SUMMARY
522 R. L. BAKER A N D F. R. M. COCKREM
pared with mice kept in the two cooler environments. Selection for body weight resulted in a correlated increase in tail length in the hot and medium environ- ments, but no significant change in tail length occurred in the cold environment. Phenotypically, tail lengths were longest in the hot environment and shortest in the cold environment. A genetic correlation between 6-week body weight and tail length was realized within the selected lines in the hot and medium environ- ments but no genetic correlation was found in the selected line in the cold environment. A sample of mice from all lines (selection and control) were switched between environments at the fourth generation of selection. A geno- type-environment interaction was observed for body weight gain for male mice which was due to similar gains by all three selected lines in the hot environment but superior gains by the hot line over both other selected lines in the medium and cold environments. Tail lengths of mice from the cold selection line were longer in the two warmer environments than in the cold environment. That this was not a genetic effect was shown by the lack of difference in tail length between the cold selected and cold control lines in all three environments. I n contrast, the medium selected and control lines showed a significant difference in tail length between the lines in all three environments. It is concluded that the cold environment prevented a correlated response which previous genetic correlation estimates would have suggested. The results are discussed in relation to the physiological function of the tail of the mouse and in relation to other genotype-environment interaction studies.
LITERATURE CITED
BARNETT, S. A., 1965a Adaptation of mice to cold. Biol. Rev, 4.0: 5-51. -, 1965b Geno- type and environment in tail length in mice. Quart. J. Exptl. Physiol. 50: 417429. BIGGERS, J. D., M. R. ASHOUB, A. MCLAREN and D. MICHIE, 1958 The growth and development
of mice i n three climatic environments. J. Exptl. Biol. 35: 144-155.
BIGHAM, M., 1965 Physiological differences in mice resulting from selection for tail length and body weight. M. Agr. Sci. Thesis. Massey University, New Zealand.
BIGHAM, M. L. and F. R. M. COCKREM, 1969 Body weights, tail lengths, body temperatures, food intakes, and some slaughter data for four strains of mice reared at three different environmental temperatures. New Zealand J. Agric. Res. 12: 658-668.
BOHREN, B. B., W. G. HILL and A. ROBERTSON, 1966 Some observations on asymmetrical cor- related responses to selection. Genet. Res. 7: 44-57.
BROWN, G. H. and H. N. TURNER, 1968 Responses to selection in Merino sheep. 11. Estimates of phenotypic and genetic parameters for some production traits in Merino ewes and an analysis of the possible effects of selection on them. Australian J. Agric. Res. 19: 303-322.
Selection for relationships opposite to those predicted by genetic cor- relation between two traits in the house mouse (Mus musculus). Nature 183: 342-343.
-, The effects of temperature on two strains of mice of different body weight and tail length. Proc. 11th Intern. Congr. Genet. 1: 1954. 1967 The effect of tempera- ture on body growth and other traits of open and woolly-faced Romney lambs. Proc. New Zealand Soc. Animal Prod. 27: 193-209.
COCKREM, F. R. M. and M. F. MCDONALD, 1969 An investigation of the relationships between body temperature and implantation and lambing rates in the New Zealand Romney ewe. Proc. New Zealand Soc. Animal Prod. 29: 195-207.
COCKREM, F. R. M., 1959
1963
T E M P E R A T U R E A N D S E L E C T I O N R E S P O N S E 523
DALTON, D. C., 1967
FALCONER, D. S., 1953
Selection for growth in mice on two diets. Animal Prod. 9: 425-434. Selection for large and small size in mice. J. Genet. 51: 470-501.
-,
1954 Validity of the theory of genetic correlation. J. Heredity 45: 4 W 4 . ~ , 1960a Selection for mice for growth on high and low planes of nutrition. Genet. Res. 1: 91-113.-, 1960b Introduction to Quantitative Genetics. Ronald Press, New York. -, 1963 Maternal effects and selection response. Proc. 11th Intern. Congr. Genet. 3: 763-773.
The environment in relation to selection for size in mice. J. Genet. 5 1 : 67-80.
The growth and carcass composition of strains of mice selected for large and small body size. J. Agric. Sci. 51: 137-148.
Environment and poultry breeding prob- lems. 5 . The design of poultry control strains. Poultry Sci. 38: 462471.
Two-way selection for body weight in Tribolium in two levels of nutrition. Genet. Res. 9 : 309-330.
The growth in weight and tail length of inbred and hybrid mice reared at two different temperatures. Proc. Roy. Soc. London B.
242: 479-516.
HEROUX, O . , 1959 Comparison between seasonal and thermal acclimation in white rats. 11.
Surface temperature, vascularization and in uitro respiration of the skin. Canad. J. Biochem. Physiol. 37: 1247-53. ~ , Mitotic rate in the epidermis of warm and cold ac- climated rats. Canad. J. Biochem. Physiol. 38: 135-142.
Selection f o r size in mice in different nutritional environments. Hereditas
47: 342-356.
Selection for small and large body size in the house mouse. Genetics
34: 194-209.
Influence of feeding regime on the effects of selection for post weaning gain in the rat. Genetics 54: 1315-1327.
The tail of the rat, in temperature regulation and acclimatization. Camd. J. Physiol. Pharmacol. 43 : 257-267.
The ecological genetics of growth in Drosophila. I. Body size and de- velopment time in different diets. Genet. Res. 1: 288-304.
-
, 1963 The ecological genetics of growth in Drosophila. 6. The genetic correlation between the duration of larval growth and body size in relation to larval diet. Genet. Res. 4: 74-92. - , 1964 The ecological genetics of growth in Drosophila. 7. The role of canalization in the stability of growth relations. Genet. Res. 5: 107-126. -, 1966 The ecological genetics of growth in Drosophila. 8. Adaptation to a new diet. Genet. Res. 8 : 165-179.The temperature response of the male rat to treadmill exercise, and the effect of anterior hypothalamic lesions. Canad. J. Physiol. Pharmacol. 43: 279-287. --, 1966 The temperature response of acclimatized and un- acclimatized rats to exercise in the cold. Canad. J. Physiol. Pharmacol. 44: 139-146. FALCONER, D. S. and M. LATYSZEWSKI, 1952
FOWLER, R. E., 1958
GOWE, R. S., A. ROBERTSON and B. D. H. LATTER, 1959
HARDIN, R. T. and A. E. BELL, 1967
HARRISON, G. A., R. J. MORTON and J. S. WEINER, 1959
1960
KORKMAN, N., 1961
MACARTHUR, J. W., 1949
PARK, Y. I., C. T. HANSEN, C. S. CHUNG and A. B. CHAPMAN, 1966
RAND, R. P., A. C. BURTON and T. ING, 1965
ROBERTSON, F. W., 1960
THOMPSON, G. E. and J. A. F. STEVENSON, 1965