I N A POPULATION PETER O’DONALD
Diuision of Biological and Medical Sciences, Brown University, Prouidence, Rhode Island 0291 2
Received December 13, 1968
A
gene’s effects on fitness can be determined only if it produces a distinct pheno- type of a known polymorphism. It is then possible to measure the pheno- type’s chances of survival against other phenotypes, as, for example, did CLARKEand SHEPPARD (1966) for the melanic and non-melanic forms of the moth Biston
betularia. But if a character can take any value in a continuous range, there is often complete ignorance of how many genes are causing the variation, of how they are organized into chromosomes, of what pleiotropic effects they may have on other characters and of what their fitnesses may be. The character may be some easily measured part of an organism, like the length of a particular organ. Or it may be the degree of expression of a particular genotype in a polymorphism. For example, the degree of dominance of two alleles is determined by genetic variations in the expression of their heterozygote. The genes that produce quan- titative variation of this sort may be called polygenes or modifying genes or modi- fiers. A particular allele at a particular locus modifies the phenotype by a par- ticular amount on the average. In general the modifiers may interact with each other so that the effect of one modifier may vary according to the other modifiers in the genotype.
To understand how selection may change a character, it is necessary to know how the modifiers are held in the population. Do the modifiers of one character also modify other characters? If so, do their effects on the several characters cause variations in fitness? And how large are the selective coefficients? KIMURA (1968) has shown that one nucleotide must have been substituted for another in the genotype every two years on average during the evolution of the mammals. This rate of replacement implies that many of the mutations can have no effect on fit- ness; for if they did, the genetic load would be intolerable. This means either that many mutations are simply without any phenotypic effect and make no contri- bution to the variance of any character, or that a lot of the variation has no effect on fitness.
Suppose the modifiers do have a considerable pleiotropic effect on fitness. The simplest way of maintaining the modifiers in the population is by a superiority of the heterozygotes over the homozygotes. Frequency-dependent selection could also maintain them. YARBOROUGH and KOJIMA (1967) have shown that fre- quency-dependent selection maintains the polymorphism at the esterase-6 locus in Drosophila melanogaster. If selection is then applied to the modifiers in one
direction or the other, it will be opposed by the heterozygous advantage or fre- quency-dependent selection that maintains the modifiers in the population through their pleiotropic effects. If only weak selection is applied, it will presum- ably have but little effect against the pleiotropic selective forces. This argument has been used to question the validity of FISHER’S (1928) theory of the evolution of dominance: EWENS (1967) has shown that the selective forces acting on the modifiers of a rare deleterious mutant heterozygote are always extremely small. Thus if the modifiers are also being kept in the population by pleiotropic selec- tive forces of a much greater magnitude, they cannot then be selected to improve the fitness of the mutant heterozygote. The wild type will not, therefore, evolve dominance as FISHER thought. But if a rare allele can be shown to have evolved dominance, then it should be possible to calculate the largest possible pleiotropic heterozygous advantage that could maintain a modifier in the population and at the same time be small enough to allow dominance to evolve. If the heterozygous advantage were too great, the modifier would be maintained at a n equilibrium too stable to shifted by the weak selective forces of dominance modification.
Among the many different mimetic forms of the butterfly Pupilio dardanus, there are some rare dominant mimics. Their dominance appears to be determined by modifiers (CLARKE and SHEPPARD 1963). The object of this paper is to show by computer simulation what heterozygous advantages could initially be main- taining the modifiers of dominance and also allow a rare mimic to evolve domi- nance-as the rare mimics of Papilio dardanus appear to have done. The model f o r the evolution of the mimicry was described in detail by SHEPPARD (1962). It is a n elaboration of FISHER’S (1930) original model of the evolution of mimicry: modifiers are selected to improve the mimicry of a new mutation producing initially a poor or imperfect mimic.
437
to produce the
E;
hybrid yellow/hippocoonides. This hybrid was then backcrossed to the mimic cenea from the same stock as hippocoonides. The offspring from the two broods were: 18 more or less like cenea, 10 yellow/hippocoonides, 6 yellow/cenea and 9 hippocoonides. If HyHV is the genotype of meriones and
hh
the geno- type of hippocoonides, then the backcross was Huh X Hch, where H c is the ceneaallele dominant to h. If M is a modifier making H e dominant to h when M is homozygous, then the backcross was M m Hyh
x
M M Hch, where m is the allele corresponding to M in the race m r i o n e s . The 18 offspring like cenea, therefore, had the genotype M M H c h or M m HCh: some of them should be more o r less typical cenea (the M M H c h individuals) and the others (the M m H"h individuals) should have undergone a breakdown of their mimicry. According to CLARKE and SHEPPARD, all the cenea/hippocoonides individuals showed some disruption of the mimetic pattern of cenea, but some were very different from the typical c e m abeing more like one of the other mimics. These results are therefore more or less as expected, but since some disruption of mimicry occurs in all heterozygotes, more than one modifying locus must be involved.
The rate of the evolution of dominance depends on the frequency in the popu- lation of the heterozygotes to be modified: if there are many of them they can be modified quickly. It is obvious that if the entire population were heterozygous, then a modifier of the heterozygote would be selected at the same rate as any gene having a direct selective effect: the smaller the proportion of heterozygotes in the population, the less direct the selection of the modifier.
FORD
(1936) quotes unpublished data of a random sample of Papilio dardanm from East Africa in which some of the mimics are quite rare. The sample consisted of the mimics:hippocoon 70 (60%)
planemoides 21 (18%)
swynnertoni
4
(3.5%)cenea 8 ( 7 % )
niobe 8 ( 7 % )
trophonissa 5 (4.5%) (a variation of hippocoonides)
(a variation of trophonius)
He also quotes the following data from POULTON (1929) of a sample from South Africa:
cenea 129 (85%)
hippocoon ides 14 (9%)
trophonius 6
(4%)
leighi (a non-mimic) 3(2%)
CLARKE and SHEPPARD (1960~; 1962) showed that most of these mimics are com- pletely dominant or recessive to each other. Thus trophonius is dominant to
low frequencies, the selection of the modifiers of dominance is still going on very slowly or has been stopped by the pleiotropic selective forces of the modifiers opposing the evolution of dominance. But the trophonius mimic has evolved com- plete dominance over the abundant c e m a mimic and so has leighi. Thus if a pleio- tropic heterozygous advantage keeps a modifier at a stable equilibrium, it must be small enough to allow a mimic at a frequency of %4% to evolve dominance.
SHEPPARD (1962) put forward a model of the evolution of dominance in a mimetic polymorphism. When a new mimic arises by mutation it is unlikely to resemble a distasteful or harmful model very closely. But it must occasionally be mistaken for the model by a predator or it would never start to spread through the population. As it spreads, modifiers improving its resemblance to the model will also be selected for. Heterozygotes of the new mimic will appear first: homo- zygotes will be very rare until the mimic has become quite common. Thus first the heterozygote and then the homozygote will have their resemblance to the model improved. Since both heterozygote and homozygote come to resemble the same model, the new mimic becomes dominant. Such mimetic polymorphisms are maintained by frequency-dependent selection which produces a stable equilib- rium of the mimics (CLARKE and O’DONALD 1964). CLARKE (1964) called the equilibrium frequencies the focal frequencies. They are the frequencies at which the phenotypes have no selective advantage over each other. Obviously the mimic of a very distasteful or harmful model can become more common than the mimic of an only slightly distasteful model before its selective advantage is lost. The mimic of a common model can also become more common than the mimic of a rare model. The palatabilities and frequencies of the models determine the focal frequencies of their mimics.
To construct a model of the evolution of dominance of the rare mimics of Papilio dardanus it must be assumed that their frequencies of 2 and
4%
are focal irequencies at which the mimic has reached equilibrium with no frequency- dependent selective advantage. If M is a modifier, then the simplest model sug- gested by CLARKE and SHEPPARD’S results is that M M produces complete domi- nance of one mimic, mm produces complete dominance of the other mimic and M m produces a form distinct from both mimics. Thus, suppose there are the fol- lowing frequencies of the nine genotypes:A A A a aa
M M r U 5
M m S U Y
mm t W z
There are three phenotypes: a mimic of the form A, a mimic of the form a and a distinct heterozygote of genotype AaMm. They have the following genotypes, focal frequencies and selective coefficients.
genotypes : A A M M A A M m A a M m a a M M a a M m
phenotypes : mimic A distinct mimic a
heterozygotes
local frequencies:
Fi
Fz F3selective
coeefficients: sI=K ( r+s+t+u-FI) s,=K (u-F,) ss=K (x+y+z+w-F,) K is the constant of frequency-dependent selection. It determines the intensity of the selection. The values of s l , sz and sg are the frequency-dependent selective coefficients: s1 is the selective coefficient of the genotypes AA M M , A A M m , A A mm and Aa M M ; sz is the selective coefficient of the genotype A a M m ; and
s3 is the selective coefficient of the genotypes A a mm, aa M M , aa M m and aa mm. The modifiers are also subject to an heterozygous advantage independent of their modifying effects on the frequency-dependent selective coefficients. This heterozygous advantage acts before the mimics are subjected to the frequency- dependent selection. The genotypes M M , M m and mm are given selective coeffi- cients c, 0 and d, to produce a superiority of the heterozygotes. Therefore, before selection of the mimics begins, the modifier M is maintained in the population at an equilibrium frequency of d/(d+c). In the calculations with this model, the modifier was given initial frequencies of either 0.5 or 0.1 at a n equilibrium deter- mined by the heterozygous advantage. Thus if the initial frequency was 0.5, then
d=c, and d measures the heterozygous advantage. (See O’DONALD 1968 for the de- tails of the computer model.) The frequencies of the nine genotypes were com- puted for each generation by recurrence equations for selection at two loci. The computation was stopped when the change of gene frequency was less than 0.00001. Thus, the frequency of the rare mimic and its modifier was obtained throughout the evolution to equilibrium.
Results of computer simulations: Table 1 shows the frequencies of the modifier of a mimic which arises by mutation and increases in the population to a focal frequency of 4%-the frequency of the trophonius mimic of Papilio dardanus in South Africa. Because its focal frequency is low, the values of K represent very weak selection. If the mimic has just arisen by mutation, the lrequencies of AA
and Aa are negligible in comparison with their focal frequencies. Thus if K z 0 . 5 ,
we have
phenotype: mimic A heterozygote mimic a
focal frequencies: 0.04 0 0.96
initial selective
coefficients: -0.02 0 0.02
The new mimic A has only a 2% advantage over a at first and this advantage decreases as its focal frequency is approached. This explains why selection is SO slow. I€ a were increasing from a low initial frequency, however, it would be very advantageous at the start of selection, its selective advantage being just under
50%: at a low frequency a is a long way from its local frequency and hence at a correspondingly great advantage; whereas A is near its focal frequency when it is rare and hence at no great advantage. From Table 1, it can be seen quite
TABLE 1
Frequencies of Q modifier of the dominance of a mimic which has a focal frequency of 4 percent
(i) K = 0.5
Pleiotropic heterozygous advantage of modifier Number
of generations 0 0.001 0.002 0.003 0.004 0.005 0
100 200 5 00 1000 2000 5000 10000 20000 Number
of generations
.5 ,50033 .50244 ,52950 .57993 .68015 .86504 .94300 ,97490 0 .5 .50032 .50238 ,52730 .56581 ,62191 ,69253 .71222 .71416 .5 .50032 .50232 .52532 .55482 ,58573 ,60561 .60707
.5 .5 ,50031 .50031 ,50227 ,50221 ,52353 .52192 ,54623 .53946 .56333 .54903 .56902 .55077
(ii) K = 0.2
Pleiotropic heterozygous advantage of modifier
0.001 0.002 0.003 0.004.
.5 ,50030 .50216 ,52046 ,53408 .53951 .54006 0.005
0 .5 .5 .5 .5 .5 .5
100 .50006 ,50006 ,50006 ,50006 ,50006 .50006 200 .50020 .50019 ,50018 ,50018 .50017 .50017 500 ,50233 .50219 .50207 ,50196 .50185 ,50176 1000 ,51915 ,51679 ,51483 .51319 .51182 ,51066 2000 .55903 .54137 ,53032 ,52317 ,51839 .51506 5000 ,67969 .57309 ,53949 ,52616 .51945 . . .
10000 ,82487 .58297 ,54005 . . . . . . . . . .
20000 92515 .58411 . . . . . , . . . . . . .
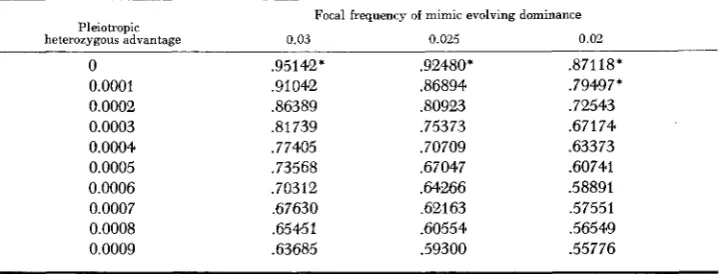
TABLE 2
Equilibrium frequencies of the modifier with different focal frequencies of the mimic
Focal frequency of mimic evolving dominance
Pleiotropic
heterozygous advantage 0.03 0.025 0.01
0
0.0001 0.0002 0.0003 0.0004 0.0005 0.0006 0.0007 0.0008 0.0009
,95142' .91042 36389 .81739 .77405 .73568 .70312 .67630 ,65451 .63685
.92480* 36894 30923 ,75373 .70709 ,67047 .64266 .62163 .60554 .59300
.87118* .79497* .72543 .67174 ,63373 .60741 .58891 ,57551 ,56549 .55776
* The symbol indicates the gene frequency after 20000 generations when equilibrium had not been reached but the computation had been stopped. The other values are true equilibria reached before 20000 generations. In all cases the modifier started at a frequency of 0.5, being kept at that frequency by its pleiotropic heterozygous advantage.
evolving in rare heterozygotes. Very similar results are obtained if the modifier starts at an initial equilibrium frequency of 0.1
The selection keeping the modifiers in equilibrium: Genetic drift might be expected to have an effect even though the heterozygotes being modified are not very rare. The heterozygote cenea/leighi is at a frequency of just under 2% and it has been shown that the modifiers could not be subjected to an heterozygous advantage of more than about 0.0004. This is a very small selective force and it could be argued that genetic drift would eliminate the modifiers. But suppose it is not an heterozygous advantage but frequency-dependent selection that main- tains the modifiers. In general frequency-dependent selection can be intense when frequencies are a long way from equilibrium but weak when they are near equilibrium. Thus an equilibrium maintained by frequency-dependent selection may be no more stable than one maintained by an heterozygous advantage but genetic drift will be less likely to cause the loss of particular alleles: an equilibrium of a given stability under frequency-dependent selection will involve much stronger selection when gene frequencies are a long way from equilibrium than an equilibrium under an heterozygous advantage. The degree of stability of the equilibrium of the modifiers determines the rate at which a modifier can be selected for dominance. The stability of a genetic equilibrium may be measured by the proportion by which a deviation from equilibrium is reduced after one generation of selection. Suppose we have
genotypes: A A Aa aa
frequencies : Pe 2Pq Q2
fitnesses : 1 -c 1 1 -d
At equilibrium p = d / ( c f d ) and q = c / ( c + d ) . If there is a small deviation from equilibrium such that p = d / ( c + d )
+
z and q = c / ( c + d ) - z, then it is easy toThe value of ( c f d - 2cd)/(c+d - c d ) , therefore, measures the stability of the equilibrium maintained by the heterozygous advantage.
If frequency-dependent selection maintains the modifiers at equilibrium, we have on the simplest model giving an equilibrium of p = 0.5,
genotypes: A A Aa aa
fitnesses: l-kp’ l-2kpq 1-kq2
This model is less general than the previous model of frequency-dependent selec- tion in that the focal frequencies have not been specified:
k
is not therefore equiv- alent to K as a measure of the intensity of the selection; when one genotype is very common and the others are rare IC has the same meaning as a simple selective coefficient favouring the rare genotypes. CLARKE and D DONALD (1964) showed that for a small deviation from equilibrium, 5, we have5’ = ~(8-4k)/(8-3k).
Therefore if an equilibrium maintained by frequency-dependent selection is to be as stable as one maintained by an heterozygous advantage, then
(c+d--2~d)/(cfd-~d) = (8-4k)J(8-3k).
I€ c = d and terms in cd are negligible, then
k
= 4d. The previous calculations showed that an heterozygous advantage of more than 0.0004 would stop the evolution of dominance of a mimic at an equilibrium frequency of 0 . 0 L t h e fre- quency of the dominant form Zeighi in South Africa. Therefore, if the modifier is maintained by a n heterozygous advantage, its selective advantage when it first arose by mutation was certainly not greater than 0.0004. But if it is maintained by frequency-dependent selection, its initial selective advantage was not greater than 0.0016. FISHER (1930) showed that a single mutation with a small selective advantage a has an ultimate chance of survival of about 2u. Thus to give a final equilibrium of a given stability, a new mutation has four times the chance of survival by frequency-dependent selection that it has by an heterozygous advan- tage. And in the course of fluctuations in the size of the population, a gene at a frequency-dependent equilibrium will not be so liable to extinction by genetic drift opposing what is anyway very weak selection. If for ecological and physio- logical reasons, therefore, frequency-dependent selection be just as likely to occur as heterozygous superiority, then modifiers maintained by frequency-dependent selection should be four times as common as those maintained by heterozygous advantages because they will be four times more likely to survive as new muta- tions. Of course, against this, it may very reasonably be doubted that frequency- dependent selection often maintains polymorphisms.Electrophoretically separable proteins are the evidence that populations are polymorphic at more than about 30% of the total number of loci (LEWONTIN and HUBBY 1966; JOHNSON et al. 1966; HARRIS 1966). Many of these loci may have modifying effects on quantitative characters. Heterozygous advantages could theoretically maintain the polymorphisms provided the selective coefficients are small and the loci are not independently affecting fitness (SVED, REED and BODMER 1967; KING 1967; MILKMAN 1967). Large selective coefficients or loci
acting independently on fitness would give rise to very great variations in fitness: the genetic load would be intolerable. But as YARBOROUGH and KOJIMA (1967)
point out, frequency-dependent selection will not give rise to great variations in fitness when the genotypes are equal in fitness at equilibrium. Therefore if the selective coefficients of the modifiers are as small as I have suggested in this paper, then frequency-dependent selection would oppose genetic drift more strongly than an heterozygous advantage when a modifier is rare, but would not produce great variations in fitness when modifiers at many loci are common and at equilibrium.
Putting aside the question of how the modifiers are kept in a population, the calculations in this paper suggest that if a mimic in equilibrium at a low fre- quency is to evolve dominance, then the modifiers of dominance can be subjected only to very small pleiotropic selective forces. If these forces are not very small, the evolution of dominance will soon stop. The modifiers of dominance may there- fore fall into that large class of nearly neutral mutations that KIMURA (1968) has shown must exist. They will be the ones that modify the expression of the heterozygote to determine its variability and degree of dominance. It may there- fore be that at least part of the genetic variation of a quantitative character has but little effect on the overall fitness of individuals. That part of the genotypic variation will be available for the immediate selection of new adaptations in changed environments.
I have been greatly helped in the course of this work by stimulating discussions with Pro-
fessor P. M. SHEPPARD, who first suggested using the computer model of the evolution of domi- nance to calculate the possible heterozygous advantage that might maintain the modifiers of dominance in a population. I am also grateful to Brown University for providing facilities for the computing.
SUMMARY
dominance to evolve. Thus it is likely that part of the genetic variation of any quantitative character is controlled by genes having little or no effect on fitness.
L I T E R A T U R E C I T E D
CLARKE, B., 1964
CLARKE, B., and P. O’DONALD, 1964 CLARKE, C. A., and P. M. SHEPPARD, 1960a
Frequency-dependent selection for the dominance of rare polymorphic genes. Evolution 18: 364-369.
Frequency-dependent selection. Heredity 19 : 201-206. The evolution of dominance under disruptive se- lection. Heredity 14: 73-87. - 1960b The evolution of mimicry in the butterfly
Pupilio durdunus. Heredity 14: 163-173. - 1960c The genetics of Pupilio durdunus,
Brown. 11. Races durdunus, polytrophus, nzeseres and tibullus. Genetics 45: 439-457. __
1962 The genetics of Pupilio durdunus, Brown. IV. Data o n race ochruceu, race fluuicornis,
and further information on races polytrophus and durdanus. Genetics 47: 909-920. -
1963 Interactions between major genes and polygenes in the determination of the mimetic patterns of Pupilio durdunus. Evolution 17: 404-413. - 1966 A local survey of the distribution of industrial melanic forms in the moth Biston betuluriu and estimates of the selective values of these in an industrial environment. Proc. Roy. Soc. London B 165: 424- 439.
A note on the mathematical theory of the evolution of dominance. Am.
Naturalist 101 : 3 5 4 0 .
The possible modification of the response of the wild-type to recurrent mu- tations. Am. Naturalist 62: 115-126. ~ 1930 The Genetical Theory of Natural Se- lection. Clarenton Press, Oxford.
The genetics of Pupilio durdunus Brown (Lep.). Trans. Roy. Entomol. SOC. London 85 : 435-456.
Enzyme polymorphisms in man. Proc. Roy. Soc. London B 164: 298-310. An analysis of polymorphism among isozyme loci in dark and light Drosophila ananussue strains from American and Western Samoa. Proc. Natl. Acad. Sci. U.S. 56: 119-125.
Evolutionary rate a t the molecular level. Nature 217: 624-626.
Continuously distributed factors affecting fitness. Genetics 55: 483492. EWENS, W. J., 1967
FISHER, R. A., 1928
FORD, E. B., 1936
HARRIS, H., 1966
JOHNSON, F. M., C. G. KANAPI, R. H. RICHARDSON, M. R. WHEELER, and W. S. STONE, 1966
KIMURA, M., 1968 KING, J. L., 1967
LEWONTIN, R. C., and J. L. HUBBY, 1966 A molecular approach to the study of genic heterozy- gosity i n natural populations. 11. Amount of variation and degree of heterozygosity in natural populations of Drosophila pseudoobscuru. Genetics 54 : 595-609.
Heterosis as a major cause of heterozygosity in nature. Genetics 55: 493495.
Models of the evolution of dominance. Proc. Roy. Soc. London B 171: 127-143.
Proc. Roy. Entomol. Soc. London 3: 16-17. MILKMAN, R. D.. 1967
ODONALD, P., 1968
POULTON, E. B., 1929 SHEPPARD, P. M., 1962
Systematics Assn. Publ. No. 4: 135-152. SVED, J. A., E. REED, and W. F. BODMER, 1967
can be maintained in a natural population. Genetics 5 5 : 469-481. YARBOROUGH, K., and K. KOJIMA, 1967
locus in cage populations of Drosophila melunoguster. Genetics 57: 677-686.
Some aspects of the geography, genetics, and taxonomy of a butterfly.
The number of balanced polymorphisms that