Volume 8, No. 3, March – April 2017
International Journal of Advanced Research in Computer Science RESEARCH PAPER
Available Online at www.ijarcs.info
ISSN No. 0976-5697
Comparative Study on Marks Prediction using Data Mining and Classification
Algorithms
Bhrigu Kapur
School of Computer Science and Engineering, Vellore Institute of Technology, India
Nakin Ahluwalia
School of Computer Science and Engineering, Vellore Institute of Technology, India
Sathyaraj R
Assistant Professor (Senior), Dept. of Software Systems School of Computer Science and Engineering
VIT University, Vellore, India
Abstract: Today that collecting data has been easy more than ever in almost all aspects of life, but the collected data is of no use if it can’t be efficiently utilised for the betterment of the society. Every year thousands of students graduate from our education system which people believe is not as optimal as it could be and there has been a considerable research on how to improve it. In light of this the primary purpose of this paper is to look at and compare well performing algorithms such as Naïve Bayes , decision tree (J48), Random Forest, Naïve Bayes Multiple Nominal, K-star and IBk. Data that we have to gauge students’ potential based on various indicators like previous performances and in other cases their background to give a comparative account on what method is the best in achieving that end. The benefits from this are not limited to the students but help us evolve the system and gain knowledge into what method is the most efficient. All educational institutions whether public or private can design curriculum and the method of teaching based on what is the most effective.
Keywords: Prediction, classification, student, marks, GPA, data mining, educational data mining, performance
I. INTRODUCTION
India is known for it’s huge untapped potential across the world, the resources that we currently have are not able to keep up with the explosive surge of population. The future leaders, developers, and professionals lie in the hands of the education system. Given the impact that it has on the country education has always been a contentious issue be it the policies like the Continuous and Comprehensive Evaluation (CCE). If we can understand the impact of these by seeing it’s effect we can ensure a better policy framework overall.
Schmitt et al. [1] believe that both cognitive and non-cognitive characteristics can help diversifying and improving the student quality.
By analysis of student’s performance special programs can be planned during the course of their stay in college. [2] Data mining has evolved from a field that was only used in making the decision making process of companies easier to now being used to societal benefit, Educational data mining is one good example.
Educational Data Mining is an emerging discipline, concerned with evaluating and bettering methods for exploring the unique and increasingly large-scale data that come from educational settings, and using those to better understand students, and the settings which they learn in.[3]
The dataset that we are going to use contains sixteen broad parameters and has details of four hundred and eighty students with parameters such as gender, nationality, place of birth, marks etc. The dataset comprises of entries from Kalboard 360 which is a learning management system that helps better the learning through technology. The students are classified into three categories of performances low-level, mid-level and high-level[8,9]. We will try and predict these by the various techniques and figure out which technique runs the best.
The useful information from these techniques can be used to change the admission process into college, change the
coursework, methods of teaching and maybe the interactions between student and the teacher. The scope of this knowledge extends from just the most well off succeeding but also identifies the students that are at the most amount of risk thereby helping us understand their problems and working towards addressing them.
II. LITERATURE SURVEY
A. Bogar´ et. al.[10] used clustering algorithms such as k-means clustering, two k-means clustering , fuzzy and transitive set closure, UCAM (Unique Clustering and Affinity Measure),Mekov Clustering, C-means Clustering and others to perform educational data mining find the previous uncovered relationships that existed before to give out the students. The research was dealing with a number of issues such as predicting students who were about to fail, tracking the progress of a student, predicting marks of the student, to identify variables that affects and influences the performance of undergraduate students. The research was able to release interesting relationships that were previously unknown.
Brijesh Kumar Baradwaj and Saurabh Pal (2011) [11] argue that the purpose of the higher educational institutes is to provide a good quality education to it’s students. They believe a way to achieve this level of quality in higher education system is by using the data that exists and finding abnormalities within that data in areas like result sheets of the students, prediction about students’ performance and so on, various approached to the job at hand were available they decided to go with Decision Tree method.
such as classification, clustering were used to find the interesting patterns in the data.
Kotsiantis et al. [13] five classification algorithms were applied (InstanceBasedLearning, Bayesian Net , Rule-learning, Decision Tree and Perceptron-based Learning) to predict the performance of computer science students from distance learning.
Khan [14] at Aligarh Muslim University performed a study on 400 students (200 boys and 200 girls ).He chose students from the science stream to determine the factors responsible for affecting a student’s performance. Clustering was used and the entire population of 400 was divided randomly into two clusters. The result of the experiment showed that the girl students with a higher socio-economic status had a relatively higher achievement and the boys from a low socioeconomic status also had a relatively higher achievement in general.
K. Prasada Rao et. al.[15] worked on comparing the performance of three prominent data mining algorithms namely J48,Naïve Bayes and Random forest. The dataset they took had 200 entries of undergraduate computer science and engineering students. After close evaluation, they found out that random forest wasn’t as effective more a small dataset but became more and more reliable when the size of the dataset was increasing.
Pallavi Kulkarni et.al.[16] researched about tracking students performance by various incremental learning techniques like NaïveBayes,IBK, KStar. The dataset that they used contained 3000 record entries of students which had 34 characteristics associated with it.They found out that incremental dataset can be beneficial to mine small dataset. It is observed that KStar classifies well, but requires more time as compared to NaiveBayes and IBK algorithm.
Hijazi and Naqvi [17] did their research by picking out the records of 300 students (225 males, 75 females) from a group of colleges affiliated to Punjab university of Pakistan. The proposed theory was The factors affecting student's performance included attendance in class, students' family income, hours spent in study on daily basis after college, mother's education and students' mother's age are significantly related with student performance was framed. The methodology used was linear regression analysis, they figured that the student’s family income and the mother’s education was highly correlated to the child’s academic performance.
III. METHODOLOGY
A. Choosing Input Variables
Different studies rely on different Input variables, some studies choose to include the non-quantifiable aspects of a person such as their caste, social background, family income, family size etc. to also be the guiding factors of how well they do in their academics. [1][4].
B. Decision Tree (J48):
A decision tree is a tree in which each leaf node represents a decision and branch node represents a choice between a numbers of alternatives. Decision trees are commonly used for getting information for the purpose of decision making. A root node is placed on the top based on the impact that it has on the result, the greatest impact is placed first. Each subsequent node is split recursively till a leaf node is reached. The ultimate result is a structure resembling a tree that makes it’s decision on a condition at every level and the previous level’s choice decides the next
course of action. A lot of studies have used this approach. [5,6,7] At its basic it uses a tree like structure in which the internal nodes symbolise the test that is done on a particular attribute and the end/leaf node holds the answer to that test which may be positive or negative based on the input from the test.proceedings, and not as an independent document. Please do not revise any of the current designations.
C. Random Forest
This method can also be thought of as the nearest neighbor predictor. The principle of such an algorithm is that “weak learners” can come together to form “strong learners”. Random forest starts with the normal decision tree but where it differentiates is by taking the classification to the next level by combining trees of various instances. In terms of the algorithm the individual trees are weak and the forest altogether (made of multiple trees) is a strong one.
When Random forest algorithm is run the answer that we get might be the average or the weighted average that one receives after running through the entire trees.
In random forest you don’t give everyone the same data you bootstrap (adjust the weight you place on certain things without changing it completely). Using the help of this process you get various options at trees and then only a finite subset of problems can be available in this the majority takes the decision on where to split as at each node there might be some amount of randomness in selecting the attribute one splits on.
After training, predictions for unseen samples x' can be made by averaging the predictions from all the individual regression trees on x':
or by taking the majority vote in the case of decision trees.
D. Naïve Bayes
This type of classifier has gained enormous popularity in the recent years due to its ability to deal with large data sets and the ease with which it can be implemented. This technique draws its origins to Baye’s Theorem.
At the most rudimentary stage the algorithm assumes that a particular feature in given data is unrelated to any other characteristic. The algorithm used a method to predict the likelihood of different events on various attributes.
E. Naïve Bayes Multinomial
reoccurrences of data within the set and also modifies the calculation to adapt to this change.
F. K-star Classification Algorithm
This algorithm uses entropy based distance function to train and find similar instances and make associations with them, hence also coming under the category of instance based classifiers. The basic principle of such classification algorithms stem from the idea that similar instances are likely to have similar classification. The biggest challenge perhaps becomes on how to define these similar instances and to do this certain distance based functions are used to test the closeness of the a previous data to the current one
G. Ibk Algorithm
The Ibk algorithm uses the k-nearest neighbours approach to model and predict the data. The ‘k’ in the k-nearest neighbour approach is simply the number of people data points that one needs to approach to make their decision. This algorithm is non parametric that is to say that it does not make any assumption on the data distribution. It is also lazy algorithm that means that it does not use the training data for any generalization. When there are more than one neighbours it takes a weighted average of the neighbours and then tries to predict the value of the data point that is given to it.
IV. EXPERIMENTAL DESIGN
A. Dataset
A comprehensive dataset of 480 entries with 16 attributes that recorded the performance of students and also gave us an overview of the background factors and the involvement of the parents in their academic life.
The attributes are as follows:
1. Gender - student's gender (nominal: 'Male' or 'Female’)
2. Nationality- student's nationality (nominal:) 3. Place of birth- student's Place of birth (nominal:) 4. Educational Stages- educational level student
belongs(nominal: ‘lowerlevel’ ,’MiddleSchool’ ,’HighSchool’)
5. Grade Levels- grade student belongs (nominal: )
6. Section ID- classroom student belongs
(nominal:’A’,’B’,’C’)
7. Topic- course topic (nominal:’ English’,’ Spanish’, ‘French’,’ Arabic’,’ IT’,’ Math’,’ Chemistry’, ‘Biology’, ‘Science’,’ History’,’ Quran’,’ Geology’) 8. Semester- school year semester (nominal:’ First’,’
Second’)
9. Parent responsible for student
(nominal:’mom’,’father’)
10. Raised hand- how many times the student raises his/her hand on classroom (numeric:0-100)
11. Visited resources- how many times the student visits a course content(numeric:0-100)
12. Viewing announcements-how many times the
student checks the new announcements (numeric:0-100)
13. Discussion groups- how many times the student participate on discussion groups (numeric:0-100) 14. Parent Answering Survey- parent answered the
surveys which are provided from school or not (nominal:’Yes’,’No’)
15. Parent School Satisfaction- the Degree of parent satisfaction from school(nominal:’Yes’,’No’)
16. Student Absence Days-the number of absence days for each student (nominal: above-7, under-7)
B. Data Classification
The end goal with this data set is to take all the factors into account and then predict the final performance of student to fit any of the three categories (H – High, M - Medium, L -
Low).[8,9].
C. Equations
The data was available in CSV (comma separated value format ) and was then subsequently created into arff files so that they can be used by Weka to perform it’s operations directly.
D. Model
The processed data was then applied to the algorithms that we wanted to test them on. The simulations were run by cross validating 10 fold and the results were duly noted.
V. RESULTS AND DISCUSSION
After rigorously testing all the six methods on the 480 entry data set and implementing them through Weka we saw that the techniques were rather close relatively. Seven attributes about the results have been shown in the table given below. True positive means that the predictor gave positive as the answer and it was correct. False positive is when the predictor gave positive as the answer even though it wasn’t.
Recall is the total number of actual positive values that are predicted positive. Precision is the number of positive values predicted that are actually positive. High recall means algorithm returns most of the relevant results while high precision indicates that results returned by the algorithm are more relevant than irrelevant.
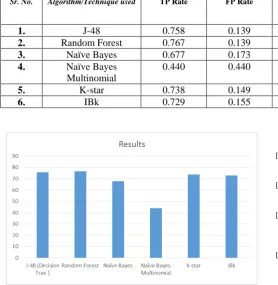
We saw J48 (Decision Tree) giving 75.8333 % accuracy , Random Forest - 76.6667 %, Naive Bayes - 67.7083 %, Naive Bayes Multinomial - 43.9583 % , K-star - 73.75 % , IBk - 72.91%. The results of the same have been shown in the bar chart below as well.
Table I. Summarised results for all six algorithms
Sr. No. Algorithm/Technique used TP Rate FP Rate Precision Recall F-measure Correctly
Classified
Figure 1. A graphical representation of the correctly classified instances.
VI. CONCLUSION
Educational Data mining is a relatively new field and has a lot of potential to help society if used in the proper manner. In this paper we compared six algorithms J48 (Decision Tree),Random Forest ,Naive Bayes, Naive Bayes Multinomial, K-star, IBk. In the comparative study of all these algorithms existing we saw that the closest we got in terms of getting an accurate prediction was the Random Forest Technique which narrowly edged the J48 to claim the top spot. This was that was done on a relatively larger dataset hence random forest becomes more accurate with the number of entried but all algorithms need modification if they can ever be used because the current amount of accuracy is low for this to be implemented on a large scale in the present state.
VII. REFERENCES
[1] Neal Schmitt and Jessica Keeney “ Prediction of 4-Year College Student Performance Using Cognitive and Noncognitive Predictors and the Impact on Demographic Status of Admitted Students “Journal of Applied Psychology © 2009 American Psychological Association 2009, Vol. 94, No. 6, 1479 –1497”
[2] Z. Ibrahim, D. Rusli, Predicting students academic performance: comparing artificial neural network, decision tree and linear regression, in: 21st Annual SAS Malaysia Forum, 5th September, 2007.
[3] Website: Educational Data Mining
http://www.educationaldatamining.org/
[4] Brijesh Kumar Bhardwaj and Saurabh Pal “Data Mining: A prediction for performance improvement using classification” (IJCSIS) International Journal of Computer Science and Information Security, Vol. 9, No. 4, April 2011
[5] G. Naga Raja Prasad Dr. A. Vinaya Babu “Mining Previous Marks Data to Predict Students Performance in Their Final Year
Examinations” International Journal of Engineering Research & Technology (IJERT) Vol. 2 Issue 2, February- 2013
[6] S. Anupama Kumar and Dr. Vijayalakshmi M.N “EFFICIENCY OF DECISION TREES IN PREDICTING STUDENT’S ACADEMIC PERFORMANCE”
[7] Arpit Trivedi “Evaluation of Student Classification Based On Decision Tree” International Journal of Advanced Research in Computer Science and Software Engineering
[8] Amrieh, E. A., Hamtini, T., & Aljarah, I. (2016). Mining Educational Data to Predict Student’s academic Performance using Ensemble Methods. International Journal of Database Theory and Application, 9(8), 119-136.
[9] Amrieh, E. A., Hamtini, T., & Aljarah, I. (2015, November). Preprocessing and analyzing educational data set using X-API for improving student's performance. In Applied Electrical Engineering and Computing Technologies (AEECT), 2015 IEEE Jordan Conference on (pp. 1-5). IEEE.
[10] A. Bogar´ın, C. Romero, R. Cerezo, M. Sanchez-Santill ´ an, ´ Clustering for improving educational process mining, in: Proceedings of the Fourth International Conference on Learning Analytics And Knowledge, ACM, 2014, pp. 11–15.
[11] Brijesh Kumar Baradwaj, Saurabh Pal, Data mining: machine learning, statistics, and databases, 1996.
[12] Hongjie Sun, Research on Student Learning Result System based on Data Mining, 2010.
[13] Kotsiantis, S., C. Pierrakeas, P. Pintelas. Prediction of Student’s Performance in Distance Learning Using Machine Learning Techniques. – Applied Artificial Intelligence,Vol. 18, 2004, No 5, 411-426.
[14] Z. N. Khan, “Scholastic achievement of higher secondary students inscience stream”, Journal of Social Sciences, Vol. 1, No. 2, pp. 84-87,2005
[15] Prasada Rao, K. , M. V.P. Chandra Sekhara, and B. Ramesh. "Predicting Learning Behavior of Students using Classification Techniques." International Journal of Computer Applications 139 .7 (2016V]): n. pag. Web. 20 Mar. 2017
[16] Pallavi Kulkarni, Roshani Ad, Prediction of Student’s Performance based on Incremental Learning, in: International Journal of Computer Applications, Volume 99 – No.14, August 2014.
[17] Hijazi, S. T., and Naqvi, R.S.M.M., “Factors Affecting Student’s Performance: A Case of Private Colleges”, Bangladesh e-Journal of Sociology, Vol. 3, No. 1, 2006.
[18] T. M. Christian, M. Ayub, Exploration of classification using nbtree for predicting students’ performance, in: Data and Software Engineering (ICODSE), 2014 International Conference on, IEEE, 2014, pp. 1–6.
[19] K. F. Li, D. Rusk, F. Song, Predicting student academic performance, in: Complex, Intelligent, and Software Intensive Systems (CISIS), 2013 Seventh International Conference on, IEEE, 2013, pp. 27–33.
[20] S. T. Jishan, R. I. Rashu, N. Haque, R. M. Rahman, Improving accuracy of students final grade prediction model using optimal equal width binning and synthetic minority over-sampling technique, Decision Analytics 2 (1) (2015) 1–25.
patterns, in: Technology Enhanced Education (ICTEE), 2012 IEEE International Conference on, IEEE, 2012, pp. 1–4.
[22] G. Elakia, N. J. Aarthi, Application of data mining in educational database for predicting behavioural patterns of the students,