Volume 8, No. 3, March – April 2017
International Journal of Advanced Research in Computer Science RESEARCH PAPER
Available Online at www.ijarcs.info
ISSN No. 0976-5697
A Study on Performance of Cricket Players using Factor Analysis Approach
Sricharan Shah, Partha Jyoti Hazarika and Jiten Hazarika Department of Statistics
Dibrugarh University Dibrugarh, Assam,
Abstract: In this paper, an attempt has been made to study the performance of Cricket Players using Factor Analysis technique. For this , the dataset of 85 batsmen, 85 bowlers; and 95 batsmen, 95 bowlers have been considered from IPL9, 2016 (20 overs) and ICC World Cup, 2015 (50 overs) respectively, and the findings of this study reveals that batting capability dominates over bowling capability which is in conformity with an earlier study on same kind of game.
Keywords: Factor Analysis, World Cup, IPL, Cricket.
I. INTRODUCTION
Cricket, or the gentleman’s game is a very old, widespread and uncomplicated pastime game. In the late 16th century, the sport of cricket has originated in the south-east England. It became the country’s national sport in the 18th century and has developed globally in the 19th and 20th
The International Cricket Council (ICC) Cricket World Cup, a One-Day International (ODI) cricket, is the flagship event of the international cricket calendar and takes place every four years with matches contested in a 50-over format. It is the biggest cricketing tournament and one of the world’s most viewed sporting events. While, the Indian Premier League (IPL), a one-day cricket in India with matches contested in a 20-over format is the most watched cricket league in the world. It is a tournament centuries and yet the most popular game of the today’s world. It is a game of uncertainty. One cannot predict outcome of the game upto the last moment of the game though the possible results are known to all, therefore, an appropriate probability model can be applied to predict the result.
Cricket is played in a standard format called a test match for a long period. The test match is a two innings per team contest that is played over five days. The long duration bores the audience as well as viewers in the television then a newer format evolved. The newer format shortened the duration to one where each team plays one innings with limited number of overs. This format was commercially successfully and spectators enjoyed shorter version of the cricket (For detailed about limited overs cricket game see Preston and Thomas [9]). But, in shorter format game with limited number of overs i.e., 20- and 50- overs matches, the player’s performance is one of the major factors for team selectors and coaches, and also to decide whether batting performance dominates over bowling performance or not. In 20-overs matches, the general opinion of several cricketing enthusiasts and experts that batting capability dominates over bowling capability; however in 50-overs matches, we cannot give such type of opinion. So, one of the attempts has been taken to analyze the performance of players in 20- and 50- overs matches to draw the conclusion whether batting capability dominates over bowling capability in both the cases or not.
where renowned international cricketers come together on one
stage & budding Indian players are groomed under their guidance. IPL is where talent meets opportunity. The cricket team is a group of 11 (eleven) players consisting of batsmen, bowler and all-rounder. The team should be balanced and diversified to enhance the probability of the success. In addition, the success can also depend on the type of pitch, winning of toss, and sequence of batting or bowling. Besides this, the performance of batsmen, bowlers as well as the fielding is the key factor of the results of a particular match. Nowadays, research is going on to study the performance of such factor using different statistical (probabilistic/ stochastic) approach. Kimber and Hansford [5] studied batting average of batsmen with the help of different statistical technique (mainly, geometric distribution). This study was further extended by Barr and Kantor [3] by providing a mathematical model/ method for comparing and selecting batsmen in ODI. Again, to win a particular game the main thing is to construct the ‘strategy’, Preston and Thomas [9] suggests an optimum batting strategy in limited overs cricket games. Bailey and Clark ([1], [2]) studied the influence of various factors which affect the outcome of an ODI cricket matches. Ledesma and Mora [6] discussed the number of factors to retain in exploratory factor analysis. Swartz et al. [12] predicted the number of runs of a particular one-day cricket matches with the help of simulation technique. A graphical method given by Van Staden [13], for comparison of cricket player’s batting and bowling performances. Norman and Clarke [8] applied dynamic programming to determine optimal batting orders of a match. Whereas, Sharp et al., [11] used an integer programming to determine the optimal team based on player’s performance in twenty20 cricket. Lemmer [7] shows how integer optimization, an objective scientific method, can be used to aid in selecting a cricket team. Sharma [10] used factor analysis approach in performance analysis of the players in IPL5-T20 Cricket.
II. METHODOLOGY AND DATA
Factor analysis is a statistical technique to study the interrelationship among variables in an effort to find a new set of factors, fewer in number than the original variables. It is one of the widely used methods of multivariate data analysis (Hair et al., [4]). The purpose of factor analysis is to obtain a reduced set of uncorrelated latent variables using a set of linear combinations of the original variables to maximize the variance of these components. The factor analysis which was performed using Principal Component Analysis (PCA) as they explain items validity as well as groups of items into meaningful clusters, and for suitable
rotation policy, an orthogonal varimax rotation was used as it assists in optimizing the number of variables.
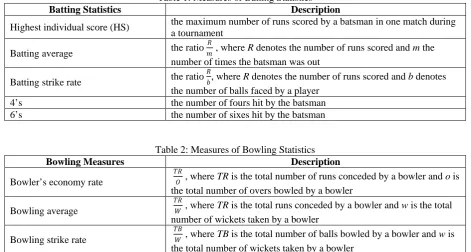
[image:2.595.62.534.212.464.2]To study the batting and bowling performance of players both in IPL9, 2016 and World Cup, 2015, the five important measures of batting statistics such as highest individual score (HS), average batting performance, strike rate (SR), numbers of fours (4’s), and number of sixes (6’s) and three bowling measures such as bowler’s economy rate, bowling average, and bowling strike rate has been considered. Table1 and 2 describe the different measures of batting and bowling performance given by Sharp et al.[11] and Lemmer [7].
Table 1: Measures of Batting Statistics
Batting Statistics Description
Highest individual score (HS) the maximum number of runs scored by a batsman in one match during a tournament
Batting average the ratio
𝑅𝑅
𝑚𝑚 , where R denotes the number of runs scored and m the number of times the batsman was out
Batting strike rate the ratio 𝑅𝑅
𝑏𝑏, where R denotes the number of runs scored and b denotes the number of balls faced by a player
4’s the number of fours hit by the batsman
6’s the number of sixes hit by the batsman
Table 2: Measures of Bowling Statistics
Bowling Measures Description
Bowler’s economy rate
𝑇𝑇𝑅𝑅
𝑂𝑂 , where TR is the total number of runs conceded by a bowler and o is the total number of overs bowled by a bowler
Bowling average
𝑇𝑇𝑅𝑅
𝑊𝑊 , where TR is the total runs conceded by a bowler and w is the total number of wickets taken by a bowler
Bowling strike rate
𝑇𝑇𝑇𝑇
𝑊𝑊 , where TB is the total number of balls bowled by a bowler and w is the total number of wickets taken by a bowler
To fit the proposed model of factor analysis, data has been collected from ICC World Cup tournament, 2015 and IPL session 9, 2016 which are freely available in the website: www.icc-cricket.com and www.espncricinfo.com.
The IPL, a professional league for 20 overs cricket competition in India was initiated by the Board of Control for Cricket in India (BCCI) and is supervised by BCCI Vice-President Rajeev Shukla, who serves as the league's chairman and commissioner. The IPL9-T20 was concluded in the month of April-May, 2016. In the ninth season of IPL, there were a total of 8 teams, namely Delhi Daredevils (DD), Gujarat Lions (GL), Kings XI Punjab (KXIP), Kolkata Knight Riders (KKR), Mumbai Indians (MI), Rising Pune Supergiants (RPS), Royal Challengers Bangalore (RCB), Sunrisers Hyderabad (SRH) on the names of famous cities of India. These teams select players (both Indian and foreign) through an auction. The maximum number of foreign players to be selected into a team is four. The final was played on 29 May between Royal Challengers Bangalore and Sunrisers Hyderabad at the M.Chinnaswamy Stadium, Bengaluru, India. Sunrisers Hyderabad went into the game as favourite
The ICC Cricket World Cup is the international championship of the ODI cricket. The event is organized by the sport's governing body, the ICC, with preliminary
qualification rounds leading up to a finals tournament held every four years. The biggest cricketing tournament, the ICC Cricket World Cup 2015 was the 11th Cricket World Cup, jointly hosted by Australia and New Zealand from 14 February-29 March, 2015. It has 14 competing teams consisting of two pools A and B each with seven teams. Fourteen teams were divided into two pools of seven, with the top four from each pool progressing to the quarter-finals. The final was played on 29 March and was a day-nighter contested between New Zealand and Australia at the Melbourne Cricket Ground in Melbourne, Australia. It was played between the tournament's two co-hosts, New Zealand and Australia. Australia went into the game as favourite
and won by 8 runs for a ninth IPL-T20 Cricket.
Here a set of 90 batsmen and 90 bowler’s statistics; and 85 batsmen and 85 bowler’s statistics has been considered from ICC World Cup, 2015 and IPL9, 2016 respectively in our study.
and won by 7 wickets for a fifth World Cup triumph. Spectator on the fields and viewers on the television has enjoyed the fullest.
III. RESULTS AND DISCUSSION
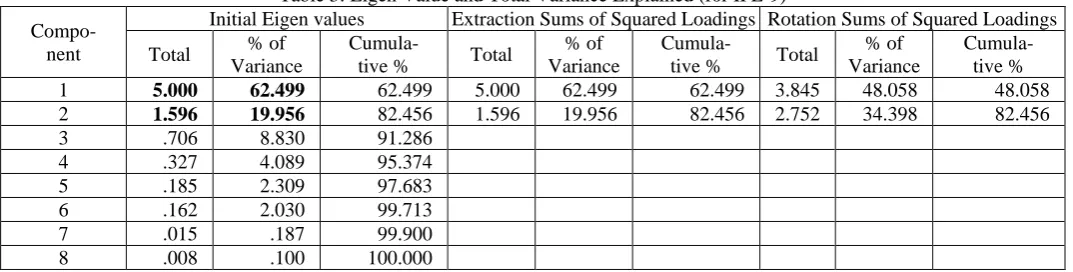
number of variables, an orthogonal varimax rotation has been used. The eigen values and the total variance explained
[image:3.595.31.568.97.233.2]are given in table 3 for IPL9, 2016 and table 4 for World Cup (WC), 2015.
Table 3: Eigen Value and Total Variance Explained (for IPL-9)
Compo- nent
Initial Eigen values Extraction Sums of Squared Loadings Rotation Sums of Squared Loadings
Total % of Variance
Cumula-
tive % Total
% of Variance
Cumula-
tive % Total
% of Variance
Cumula- tive %
1 5.000 62.499 62.499 5.000 62.499 62.499 3.845 48.058 48.058
2 1.596 19.956 82.456 1.596 19.956 82.456 2.752 34.398 82.456
3 .706 8.830 91.286
4 .327 4.089 95.374
5 .185 2.309 97.683
6 .162 2.030 99.713
7 .015 .187 99.900
[image:3.595.32.567.262.400.2]8 .008 .100 100.000
Table 4: Eigen Value and Total Variance Explained (for WC-2015)
Compo- nent
Initial Eigen values Extraction Sums of Squared Loadings Rotation Sums of Squared Loadings
Total % of Variance
Cumula-
tive % Total
% of Variance
Cumula-
tive % Total
% of Variance
Cumula- tive %
1 4.544 56.799 56.799 4.544 56.799 56.799 4.019 50.233 50.233
2 2.101 26.265 83.063 2.101 26.265 83.063 2.626 32.830 83.063
3 0.523 6.538 89.601
4 0.368 4.594 94.196
5 0.260 3.248 97.443
6 0.158 1.975 99.418
7 0.027 0.343 99.761
8 0.019 0.239 100.00
The higher loadings on a particular factor result in identification of each variable with a single factor. The factor loadings are given in table 5 for IPL9, 2016 and table 6 for WC, 2015. We have considered only those items whose factor loading are higher than 0.5. In selecting the extraction of factorial groups, the Kaiser criterion was
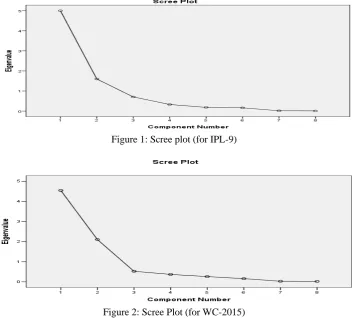
[image:3.595.32.567.502.776.2]adopted. As per the Kaiser criterion, all factors should be accepted whose eigen values are higher than 1.0. Therefore, two factors were extracted (see table 3 and 4), the same has been presented graphically (cattell’s scree plot) in figure1 and 2.
Table 5: Rotated Component Matrix (for IPL-9)
Variables Rotated factor loadings and communalities
Factor 1 Factor 2 Communalities
Highest Score by batsman .932 -.240 0.926
Average of a batsman .879 -.250 0.942
Strike rate of a batsman .612 -.296 0.462
Number of fours hit by a batsman .890 -.253 0.856
Number of sixes hit by a batsman .909 -.115 0.840
Bowling average -.190 .958 0.954
Bowling economy -.378 .792 0.770
Bowling strike rate -.184 .960 0.955
Percentage of variance 62.499 19.956
Cumulative percentage 62.499 82.456
Table 6: Rotated Component Matrix (for WC-2015)
Variables Rotated factor loadings and communalities
Factor 1 Factor 2 Communalities
Highest Score by batsman .942 -.226 .938
Average of a batsman .900 -.207 .853
Strike rate of a batsman .837 -.095 .709
Number of fours hit by a batsman .908 -.235 .880
Number of sixes hit by a batsman .850 .042 .724
Bowling average -.070 .971 .947
Bowling strike rate -.088 .949 .908
Percentage of variance 56.799 26.265
Cumulative percentage 56.799 83.064
The variance explained by first factor (i.e., batting) is 62.50 % and the variance explained by second factor (i.e., bowling) is 19.96 %. These two extracted factors accounted for 82.46 % of the total variance explained in this study. Thus, the variance explained by batting is much higher than the variance explained by bowling, which shows the higher importance of batting as compared to bowling in IPL session 9 Cricket, 2016.
Again, in case of ICC World Cup, 2015, it is observed that the variance explained by first factor (i.e., batting) is 56.80 % and the variance explained by second factor (i.e., bowling) is 26.26 %. These two extracted factors accounted for 83.06 % of the total variance explained in this study. Thus, the variance explained by batting is much higher than
the variance explained by bowling, which shows the higher importance of batting as compared to bowling in ICC World Cup Cricket, 2015.
[image:4.595.123.480.279.597.2]From the results of the above two games, it is observed that both in IPL-9, 2016 and ICC World Cup, 2015, batting performance dominates over bowling performance. But in case of IPL-9, 2016, the performance of batsmen is higher than World Cup, 2015 which means batting capability should be given higher importance in 20-overs matches as compared to 50-overs matches. Also, the variation of bowling is higher in World Cup, 2015 than the IPL-9, 2016 which means bowling capability should be given higher importance in 50-overs matches as compared to 20-overs matches which is as expected.
Figure 1: Scree plot (for IPL-9)
Figure 2: Scree Plot (for WC-2015)
IV. CONCLUDING REMARKS
Here, we have studied the performance of cricket players in both IPL session 9, 2016 and ICC World Cup, 2015 in the same direction of Sharma (2013). The statistical technique of factor analysis has been employed to explore the interrelationship among the various dimensions of batting and bowling of 20- and 50- overs cricket matches. It has been applied through PCA to explain items validity as well as groups of items into meaningful clusters. It is observed that in both the cases of the 20- and 50- overs matches, the five dimensions have been grouped into factor1 (i.e., batting) while, three dimensions have been grouped into factor2 (i.e., bowling). The variance explained by factor1 (batting) is much higher than the variance explained by factor2 (bowling). Thus, it concludes that the batting
capability dominates over bowling capability which re-justified the works of Sharma [10].
good all-rounder players in a match which can increase the performance of bowling as well as batting to improve team’s results.
Thus, at last, it is a study of the performance of players in two different tournaments and based on this results we cannot generalized it since some other factors such as geographical location, type of pitch conditions, weather conditions, effect of lighting in day-night matches etc. may impact on the performance of players. So, one can think to study the performance of players along with these factors, also.
V. REFERENCES
[1] Bailey, M.J. & Clarke, S.R.: Market inefficiencies in player head to head betting on the 2003 cricket world cup. In Economics, Management and Optimization in Sport, S.Butenko, J.Gil-Lafuente & P.M.Pardalos, editors, Spinger-Verlag, Heidelberg,pp. 185-202 (2004).
[2] Bailey, M.J. & Clarke, S.R.: Predicting the match outcome in one day international cricket matches, while the match is in progress. Journal of Science and Sports Medicine, 5, 480-487 (2006).
[3] Barr, G.D.I. and Kantor, B.S.: A criterion for comparing and selecting batsmen in limited overs cricket, Journal of the Operational Research Society, 55, p. 1266-1274 (2004). [4] Hair, J.F., Black, W.C., Babin, Anderson, R.E. and Tatham,
R.L.: Multivariate Data Analysis, 6th ed., Prentice-Hall, Upper Saddle River, NJ (2007).
[5] Kimber, A.C. and Hansford, A.R.: A statistical analysis of batting in cricket, Journal of the Royal Statistical Society, Series A 156, p. 443-455 (1993).
[6] Ledesma, R.D. and Mora, P.V.: Determining the Number of Factors to Retain in EFA- an easy-to-use computer program for carrying out Parallel Analysis, Volume 12, Number 2, February 2007 ISSN 1531-7714 (2007).
[7] Lemmer, H.H.: Team selection after a short cricket series, European Journal of Sport Science, DOI: 10.1080/17461391.2011.587895 (2013).
[8] Norman, J.M. and Clarke, S.R.: Optimal batting orders in cricket. Journal of the Operational Research Society (2010) 61, 980-986.doi:10.1057/jors.2009.54 (2010).
[9] Preston, I. and Thomas, J.: Batting strategy in limited overs cricket, Statistician, 49(1), p. 95–106 (2000).
[10] Sharma, S.K.: A Factor Analysis Approach in Performance Analysis of T-20 Cricket, Journal of Reliability and Statistical Studies; ISSN (Print): 0974-8024, (Online):2229-5666 Vol.6, Issue 1 (2013): 69-76(2013).
[11] Sharp, G.D., Brettenny, W.J., Gonsalves, J.W., Lourens, M. and Stretch, R.A.: Integer optimization for the selection of a Twenty20 cricket team, Journal of the Operational Research Society, 62, p. 1688-1694 (2011).
[12] Swartz, T.B., Gill, P.S. and Muthukumarana, S.: Modelling and simulation for one-day cricket, The Canadian Journal of Statistics, 37, p. 143-160 (2009).