Volume 8, No. 3, March – April 2017
International Journal of Advanced Research in Computer Science RESEARCH PAPER
Available Online at www.ijarcs.info
ISSN No. 0976-5697
Model using Improved Apriori Algorithm to generate Association Rules for Future
Contracts of Multi Commodity Exchange (MCX)
Chirag A. Mewada
Assistant Professor
Naran Lala College of Professional and Applied Sciences Navsari
Rustom D. Morena
Professor
Department of Computer Science Veer Narmad South Gujarat University, Surat
Abstract: Now-a-days commodity markets are getting equal importance as equity market. Moreover, just like stock trend prediction, researchers are taking active interest in forecasting commodity trend. Trend prediction is really a challenging task especially for commodity market. There are so many factors, which affects commodity market returns. This empirical study generates association rules form the data of Multi Commodity Exchange (MCX) of India from November 2003 to December 2016. Data contains End of Day (EOD) prices of each commodity future contract. We have developed a model to analyze MCX data and derive association rules. Using our model, we have found co-movement between fundamentally different commodity future contracts. In our model, we have used improved apriori algorithm. Our result portrays that the contracts of fundamentally different commodities are correlated even if they neither substitutes nor complements each other.
Keywords: MCX, Commodity Future Contracts, Association Rules, Improved Apriori Algorithm
I. INTRODUCTION
In this Information Technology (IT) era, timely and accurate information is a key to success. With the increase of globalization and evolution of information technology, the world is generating a massive amount of data. If we do not convert these data into useful information, then these data are useless for us. We can analyze this enormous amount of valuable data to discover useful knowledge. It is very difficult to analyze all these data manually. There is a need for automated and efficient solution to automatically analyze and visualize enormous amount of valuable data. The solution needs to be helpful in decision-making process. There is a great potential to analyze financial data because it helps in generating more profit for an individual or an organization. Nowadays commodity markets are getting more focus due to its high return capacity. Commodity market provides a physical or virtual marketplace for trading in raw or primary products, which are known as commodities. For developing countries, commodities provide the source of foreign revenue.
The Commodity is a commercial product that can be produced, consumed, bought and sold [1]. We can classify commodities in two categories: hard commodities and soft commodities. Soft commodities are grains, food, and fibers like potato, corn, rice, soybean, sugar, wheat, cotton, coffee, pepper, palm oil, cashew etc. We can classify hard commodities as precious metals, energy, and other metals. It can be gold, platinum, silver, copper, lead, zinc, tin, aluminum, nickel, crude oil, natural gas, etc. Commodity exchange is a market where we can trade commodities. The commodity future market in India dates back to more than a century and trading in commodities is the oldest business. In fact trading in commodity future is popular since the 19th
2 century in India with organized trading in cotton. Bombay Cotton Association Ltd. established in 1875 to trade in cotton derivative contracts. Over a period, various other commodities were allowed to trade in future Exchanges [ ]. The Contract is an agreement between buyer and seller of commodity at a pre specified date, price, quality and
quantity. Buyers of the contract want to avoid the risks associated with the price fluctuations of raw materials and sellers want to lock in a price. Commodity futures are not classic financial instruments such as interest rates, stocks, inflation rates, bonds and other financial or meteorological variables. Still, they are lumped together with other alternative investments. It is a new asset class for portfolio diversification. Commodities futures based on underlying physical commodities with finite supply and sizeable storage and transportation costs. [3] In the highly uncertain business environment, Commodity futures offer a solution to the problem of risk caused by price volatility. [4] Risk management not only reduces the chances of lose but it increases the profit in any business organization. Future market provides manufactures and bulk consumers an opportunity to lock in the price of commodity to avoid the risk of paying a higher price for the same commodity. The Multi Commodity Exchange (MCX) of India Limited is India’s first listed exchange that provides commodity-trading facility through the buying and selling of future contracts for commodities. MCX is India’s largest commodity future exchange in terms of market share. [5] The MCX is located in Mumbai the financial capital of India. MCX has satisfied two major goals. One is price discovery and other is risk management for India’s commodity future market.
the available methods for data mining, an association rule mining is a more popular method for discovering interesting correlations between attributes of large databases. [8] . It is always difficult to select the proper data mining algorithm for a specific database. Many algorithms are available through which we can generate association rules, but it is always a problem to get association rules with higher accuracy. [9] One of the most popular algorithms for association rule mining is the apriori algorithm that is useful to extract frequent itemsets from large databases and to generate the association rules for discovering knowledge. [10] Apriori algorithm has two major limitations [11]:
1) It generates large number of candidates. 2) It requires so many database scans.
Nowadays commodity markets are getting equal importance as the equity market. Moreover, just like stock market trend prediction, researchers are taking an active interest in forecasting price trend for future market too. Future prices discovered for exchanges are valuable to all decision makers. They could be farmers, processors, warehouse keepers, traders or policy makers. If a farmer gets advance information about the price of the produce then that will be useful to him at the time of harvest. He can plan his crops and investments so.
Co-movement between commodities occur when two or more commodities move together and the discovery of one commodity price offers valuable information about others. [12] It provides valuable information to traders and investors for trading in commodity future market. Commodity future prices strongly correlated to underlying commodity prices and commodity prices correlated with a variety of other factors. Commodity prices are strongly correlated to demand and supply ratio. Some commodities are useful as substitutes or complements of each other in production or consumption. Some commodity prices strongly correlated to aggregate demand, exchange rates, and interest rates. [13] [14] If market fundamentals cannot prove the correlation between commodities then it will surprise investors. The presence of excess co-movement may cast doubts on the competitiveness and efficiency of the commodity market. If it exists, then it concludes that commodity traders take decisions based on herding behavior and not market fundamentals. Traders and exporting countries could also face challenges in balancing their portfolios. Therefore, they exposed to high-income volatility [15].To find co-movement between fundamentally different commodity future prices, we have used optimized and improved version of apriori algorithm. We have used improved apriori algorithm to find interesting association rules, which describe the correlation between future contract prices of fundamentally different commodities. We have developed an algorithm based on a classic apriori algorithm and fp-growth algorithm to extract knowledge from data. We have used trie data structure to improve the performance by reducing the number of scans. Our algorithm outperforms apriori algorithm. We have tested our algorithm on End of Day (EOD) prices of future contracts from November 2003 to December 2016 of Multi Commodity Exchange (MCX).
II. LITERATURE REVIEW
Mthuli Ncube, Dawit B. Tessema and Daniel Zerfu Gurara [16] have used monthly data from 1980 to 2014 to
check whether co-movement exist between groups of commodities (group 1 comprises of coffee, cocoa, cotton and group 2 comprises of wheat, maize, and palm oil). They have used Generalized Autoregressive Conditional Heteroskedasticity (GARCH) model to explore co-movements between commodity pairs. They found no evidence of excess co-movement between commodity pairs. They found that economic fundamentals have caused much of the volatility in commodity prices over long time spans. They also found that macroeconomic variables, which find the supply and demand for commodities, influence Commodity prices. They have shown conditional covariance of pairs of unrelated commodities is stable and small.
Dincer Dedeoglu [17] investigated linkages of nine commodity futures using monthly futures prices for the period 1988 to 2012. He was interested in investigation of oil and agricultural linkages. To find linkages, he has focused on cocoa, coffee, corn, crude oil, rice, soybean oil, soybean, sugar, and wheat. He has chosen wavelet analysis to investigate the correlation between commodity futures because it enabled him to study the correlation in not only time but frequency domain also. As per his research findings, correlations are low for a short, medium and long run. He also found evidence of increased correlations after 2008. This increase was particularly in soybean, oil-soybean oil and oil-sugar pairs. As per his closing remarks, this could be the result of global crisis.
P.Prakash and Dr.S.Sundararajan [18] have studied 13 years data (from January 2000 to December 2013) of Multi Commodity Exchange (MCX) to show whether there is a relationship between gold and silver using correlation coefficient, regression, and analysis of variance (ANOVA). The period from 2000 to 2013 covers a very extensive range of political change in major producers, economic conditions and increased sophistication in asset markets. The main goal of their study is to investigate the relationship between gold and silver in the commodity market and to find out the factors affecting the price movement of gold and silver in Indian Commodity Market. During their study, they found that Gold prices have 97% dependence on silver prices. They have clearly observed that the gold price has a strong positive correlation with the silver price from past 13 years. The result was consistent with the earlier data analysis that there is a relationship between the gold and silver prices.
Manisha Pradhananga [19] has used Pearson’s correlation coefficient method to find the correlation coefficient for selected commodities (including grain, energy and soft commodities, livestock, and metals) for two time periods 1995-2005 and 2006-2012. She has studied the casual links between the increase in co-movement between commodity prices and financialization of the commodity future prices. She has extracted common factors from a group of 41 commodities using the PANIC method and included it in a factor-augment the VEC model along with a proxy of financialization. Except for a few cases, she found correlation was higher in the second time period among most commodities. Even correlations between commodities that were seemingly unrelated, such as copper and grains have risen in the second time-period. From the result, she argues that there exist remarkably synchronized rise and fall of prices of unrelated commodities.
used the Nikkei-TOCOM Sub Commodity Indices for four precious metal futures contracts traded at the TOCOM (gold, palladium, platinum and silver). Each commodity listed at the TOCOM has its Sub-Index. Each Sub-Index is the figure of the fluctuating rates of the daily settlement prices in the core contract-month, from May 2002 to the end of December 2010. The data contain 2104 observations for each contract with no observations missing. Using co-integration test, he concluded that the prices of four commodity futures do not move together in long run. Therefore, as per his conclusion, there are no long-run relationships among commodity futures prices.
III. MODEL BUILDING
In Our model, we have used improvised implementation of the apriori algorithm. In our model creation, we have created two different files. One file has unique codes generated from the combination of the commodity name, expiry month and bin value which represents an interval of percentage change in price. We call it as a commodity code file. Another file contains encoded transactions. We have generated new transaction file from real transactions by replacing actual values with unique codes from a commodity code file. Instead of actual data from the database, our method uses data from both of these files, so the original database is free to use. Following are the major steps of our model.
I. DATA PROCUREMENT
II. DATA PREPROCESSING
III. DATA ENCODING
IV. APPLY IMPROVED APRIORI
ALGORITHM
V. RESULT DECODING
I. DATA PROCUREMENT
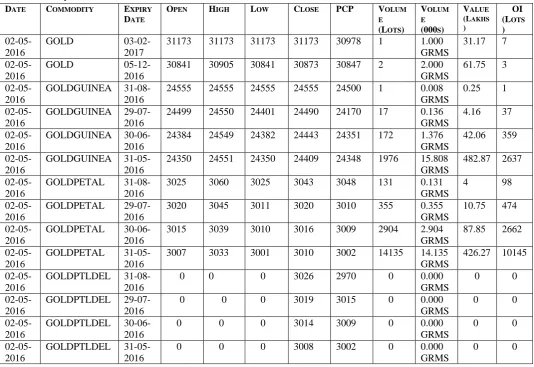
We have collected data from Multi Commodity Exchange (MCX) of India Ltd. For our research, we have considered data from November 2003 to December 2016. We have used End of Day (EOD) prices of commodities for which there is an open contract. Data comprises Date, Commodity Symbol, Contract Expiry Date, Open Price, High Price, Low Price, Close Price, Previous Close Price, Volume, Volume (In 000’s), Value and IO for each working day. Data is available in the form of CSV files. We have developed a windows application using Visual Basic.NET programming language, which inserts data from CSV files into a database. The application allows choice of a file and it searches for the rest of CSV files from the same folder. By this way, the application allows user to insert data for several days, months and years at a time into the database. The application will not only add data into database but calculates the percentage change also, finds bin value and performs encoding and decoding of data too. Table I shows sample data collected from the website of MCX.
Table I Sample Data Collected from the MCX
DATE COMMODITY EXPIRY
II. DATA PREPROCESSING
Data pre-processing is a necessary and critical step of the data mining process or knowledge discovery from databases. The base of data pre-processing is preparation of data as a form of correct, reliable and quality data. Data preprocessing is not only useful for data mining but also useful in constructing data warehouses [21]. First, we have reduced our database by reducing unwanted fields. Then we have calculated the percentage change in the close price of every commodity contract for each trading day. Percentage change reflects the overall trend in price movement between two consecutive trading days. We have used equal-width binning technique to create bins of the same size. Then we have
replaced the actual value of percentage change with bin value. Details of binning and data reduction are as follows.
1) DATA REDUCTION
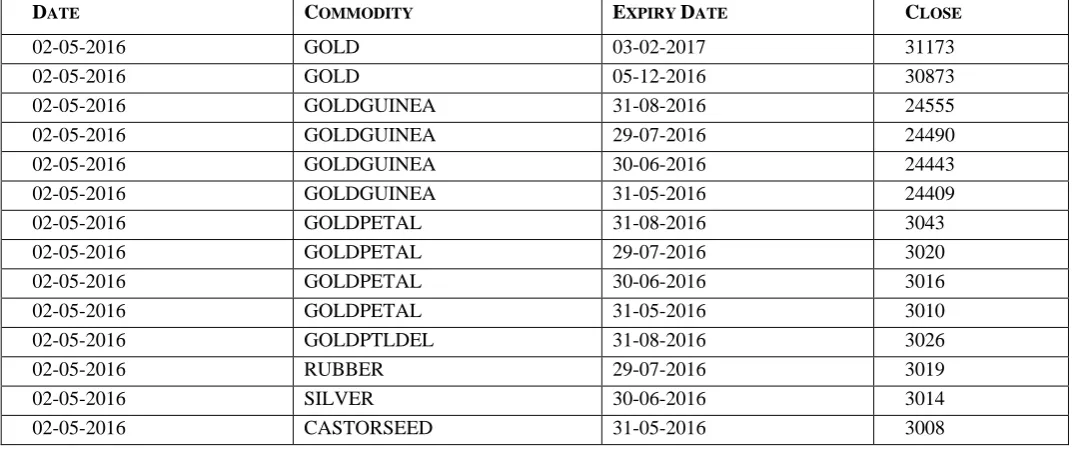
From the collected data, we are using Close Price of each commodity contract, which is open because it reflects the ultimate trend of price movement for a single day. We are not using attributes like Open Price, High Price, Low Price, Volume, Volume (In 000’s), Value and Open Interest. Because the data collected from MCX has lots of missing values for all these attributes. Therefore, we have eliminated all these unwanted attributes. We have created a subset of important attributes. Table II shows sample data after data reduction.
Table II Sample Data after Data Reduction
DATE COMMODITY EXPIRY DATE CLOSE
02-05-2016 GOLD 03-02-2017 31173
02-05-2016 GOLD 05-12-2016 30873
02-05-2016 GOLDGUINEA 31-08-2016 24555
02-05-2016 GOLDGUINEA 29-07-2016 24490
02-05-2016 GOLDGUINEA 30-06-2016 24443
02-05-2016 GOLDGUINEA 31-05-2016 24409
02-05-2016 GOLDPETAL 31-08-2016 3043
02-05-2016 GOLDPETAL 29-07-2016 3020
02-05-2016 GOLDPETAL 30-06-2016 3016
02-05-2016 GOLDPETAL 31-05-2016 3010
02-05-2016 GOLDPTLDEL 31-08-2016 3026
02-05-2016 RUBBER 29-07-2016 3019
02-05-2016 SILVER 30-06-2016 3014
02-05-2016 CASTORSEED 31-05-2016 3008
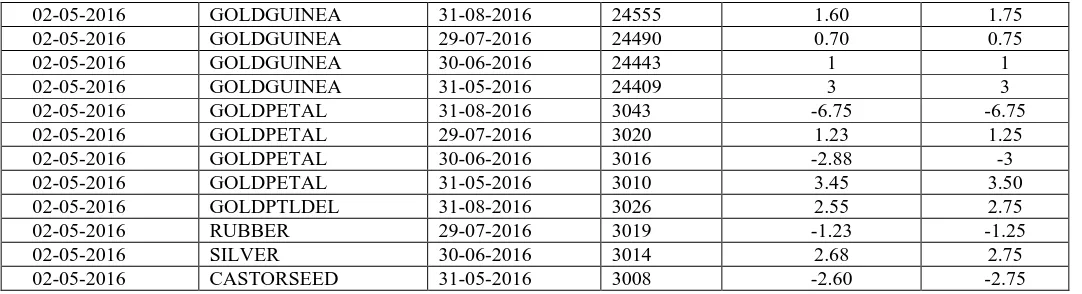
2) DATA TRANSFORMATION (BINNING)
We have used equal-width binning technique to create bin values for percentage change in commodity prices. For data transformation, we have replaced the percentage change value with related bin value. Using equal-width binning technique, we have created bin values by considering a gap of 0.25. We have categorized percentage change values into the number of bins. If the percentage change is between zero and 0.25, then we are using bin value 0.25 and if the percentage change is between 0.25 and 0.50 then the bin value is 0.50 likewise for the value belongs to range 0.50 to 0.75, bin is 0.75. For values between 0.75 and 1, we are using one as bin value and so on and so forth. We have replaced the actual percentage change value with bin value even for negative values as well. It helps in finding interesting association rules by avoiding the negligible differences in percentage change value. Table III and Table IV represent the above explanation in tabular form. Table V shows sample data after data transformation (binning).
Table III Positive Bin Values as per Percentage Change Values
PERCENTAGE CHANGE BIN VALUE
0 To 0.25 0.25 0.25 To 0.50 0.50 0.50 To 0.75 0.75
0.75 To 1 1
Table IV Negative Bin Values as per Percentage Change values
PERCENTAGE CHANGE BIN VALUE
0 To -0.25 -0.25 -0.25 To -0.50 -0.50 -0.50 To -0.75 -0.75
-0.75 To -1 -1
Table V Sample Data after Data Transformation (Binning)
DATE COMMODITY EXPIRY
DATE
CLOSE PERCENTAGE CHANGE
BIN VALUE
02-05-2016 GOLD 03-02-2017 31173 2.50 2.50
02-05-2016 GOLDGUINEA 31-08-2016 24555 1.60 1.75 02-05-2016 GOLDGUINEA 29-07-2016 24490 0.70 0.75
02-05-2016 GOLDGUINEA 30-06-2016 24443 1 1
02-05-2016 GOLDGUINEA 31-05-2016 24409 3 3
02-05-2016 GOLDPETAL 31-08-2016 3043 -6.75 -6.75 02-05-2016 GOLDPETAL 29-07-2016 3020 1.23 1.25
02-05-2016 GOLDPETAL 30-06-2016 3016 -2.88 -3
02-05-2016 GOLDPETAL 31-05-2016 3010 3.45 3.50 02-05-2016 GOLDPTLDEL 31-08-2016 3026 2.55 2.75
02-05-2016 RUBBER 29-07-2016 3019 -1.23 -1.25
02-05-2016 SILVER 30-06-2016 3014 2.68 2.75
02-05-2016 CASTORSEED 31-05-2016 3008 -2.60 -2.75
III. DATA ENCODING
For faster processing, we are encoding our data by generating unique codes for the combination of Commodity Name, Contract Expiry Month and Bin Value. Using these unique codes and transactions from the database, we are creating a transaction file. Each row in the transaction file represents the price movement of contracts, which are open on that day. Each row of the transaction file describes end of day condition of various contracts for a variety of commodities. Table VI shows sample data of the commodity code file. Figure I show sample data of commodity transaction file.
Table VI Sample Data of Commodity Code File
UNIQUE CODES UNIQUE COMBINATION OF COMMODITY NAME, CONTRACT EXPIRY MONTH AND BIN VALUE
1 CASTORSEED2(1.75) 2 GOLD2(0.25)
3 GOLDM2(0.25) 4 GOLD4(-0.25) 5 SILVER1(0.75) 6 CASTORSEED2(-1.25)
7 CASTORSEED2(2.25) 8 GOLD2(1)
9 GOLDM2(1) 10 SILVER3(3) 11 GOLD4(1.25) 12 GOLD8(1)
13 CASTORSEED2(-0.75) 14 GOLD2(0.75)
15 GOLDM2(0.75) 16 RUBBER2(0.25) 17 SILVER3(-0.25) 18 GOLD4(0.5) 19 GOLD2(-0.25) 20 GOLDM2(-0.25) 21 SILVER3(0.5) 22 GOLD4(0.25)
23 CASTORSEED2(-0.25) 24 SILVER3(-0.5)
25 GOLD4(-0.5)
IV. APPLY IMPROVED APRIORI ALGORITHM
Our algorithm is based on trie data structure. We have used trie to store frequent patterns. A trie is a rooted and labeled tree. The depth of the root node is zero. A node at depth d points to nodes at depth d+1. There is an edge or link between each pair of parent and child nodes. Edge has a label, which represents an item. It also contains a link to the child node. [22] Tries are suitable for storing and retrieving not only words but also any finite sets. [23] Therefore, we have used edges to store frequent items and nodes to store frequency count. Root node contains total number of transactions. First level nodes contain frequency count for frequent items. Edges connecting root node and nodes at first level contain frequent items. From second level onwards, each node has frequency count of frequent itemset. We have used filtered, optimized and sorted transactions. We have eliminated non-frequent items from each transaction. To save input output time, we have stored filtered transactions in main memory. We have sorted nodes in the trie and items in the commodity transactions file to make the search faster. From itemsets of size three, onwards numbers of unwanted itemsets are very less. We have also used a counter for repeated transactions to save memory and execution time. It has a significant influence on run-time. [23] Classic apriori spends most of the time in determining the support of small and medium-sized candidates. In such cases, most edges lead to leaves hence removing other edges does not accelerate the algorithm too much. [23] Therefore, we have used reduced pruning steps. To improve the performance of our algorithm, we have performed punning operation up to two levels. From third and fourth level, we have not removed non-frequent items from the trie. Trie may need more memory to store all possible combinations of frequent items. However, experiments show that memory need may be negligible to the third or the quarter. [23]
1) IMPROVED APRIORI ALGORITHM [22]
1.1)PSEUDO CODE OF PROPOSED ALGORITHM
Meaning of various terms used in pseudo code of proposed algorithm is as following:
Join Step: Ck is generated by joining Lk-1with itself
Prune Step: Any (k-1)-itemset that is not frequent cannot be a subset of a frequent k-itemset
Pseudo-code of the algorithm is as follows: T: Transaction Database
R: Reduced Transaction
ROT: Reduced and Optimized Transaction Database Ck: Candidate Itemset of size k
Lk: Frequent Itemset of size k
L1
1.1.1) IMPROVED APRIORI ALGORITHM
: Frequent Items of size 1 j: Size of the Candidate Itemset min_support : Minimum support
FindFrequentItems(k) : Function to find frequent itemset of size k
Input: A transaction Database T and a minimum support min_support
Output: UkLk the set of all frequent itemsets
j = 0;
L1 = Call FindFrequentItems(j);
for each( transaction t in T){ for each(item i in t){ if ( L1 contains i){
Generate Frequency Code Fk for i;
Add Fk in R;
Pseudo code of function findfrequentitems(k) is as following:
FUNCTIONfindfrequentitems(K){ If (k < > 0) {
those are contained in t; if (k < 3) {
Our algorithm requires three times scanning of transactions. Firstly, it scans transaction file and then, it scans filtered transactions from the memory. This improvement is good enough to prove that our algorithm is faster and it consumes less execution time. For itemsets of size three onwards, there may be very few or none non-frequent itemsets available in the candidate set. [
; }
23] Therefore, we have performed pruning operations exactly twice.
This optimization in execution time was resulted in some unwanted memory waste but it was compensated by improved performance.
(V) RESULT DECODING
while encoding. Encoding and decoding processes take extra time, but it makes a huge difference in processing time. So ultimately, we have reduced the overall time consumption
by performing this step. Table VII shows a sample of original result and Table VIII shows a sample of decoded result.
Table VII Sample of Original Result
CONFIDENCE OCCURRENCE ANTECEDENT => CONSEQUENT
85% 28 32 => 55
85% 40 55 => 157
86% 30 75 => 49
92% 30 257 => 157
87% 42 155 => 157
86% 42 36 => 49
87% 30 67 => 234
87% 26 125 => 27
86% 28 55 => 32
85% 23 32 => 77
86% 23 166 => 125
95% 26 221 => 55
87% 35 36 => 27
88% 24 234 => 146
94% 23 53 => 155
91% 29 77 => 157
86% 23 125 => 55
85% 40 157 => 55
Table VIII Sample of Decoded Result
CONFIDENCE OCCURRENCE ANTECEDENT => CONSEQUENT
85% 28 NICKEL8(0.25) => GOLD10(0.25)
85% 40 GOLD10(0.25) => COPPER11(0.25)
86% 30 KAPAS4(-0.25) => GOLD2(0.25)
92% 30 SILVERM11(0.25) => COPPER11(0.25)
87% 42 GOLD12(0.25) => COPPER11(0.25)
86% 42 COPPER2(0.25) => GOLD2(0.25)
87% 30 GOLD4(0.25) => CRUDEOIL3(0.25)
87% 26 KAPAS4(0.25) => SILVER3(0.25)
86% 28 GOLD10(0.25) => NICKEL8(0.25)
85% 23 NICKEL8(0.25) => GOLDM9(0.25)
86% 23 SILVER7(0.25) => KAPAS4(0.25) 95% 26 CRUDEOIL9(0.5) => GOLD10(0.25) 87% 35 COPPER2(0.25) => SILVER3(0.25) 88% 24 CRUDEOIL3(0.25) => GOLD6(0.25) 94% 23 REFSOYOIL11(-0.25) => GOLD12(0.25)
91% 29 GOLDM9(0.25) => COPPER11(0.25)
86% 23 KAPAS4(0.25) => GOLD10(0.25)
85% 40 COPPER11(0.25) => GOLD10(0.25)
Table VII shows a sample of the original result, which has encoded values in each rule. We have generated decoded result by replacing the original values with encoded values in encoded result. Table VIII shows a sample of result generated after decoding values.
IV. RESULTS
We have used a database populated from End of Day (EOD) prices of future contracts of MCX. We have data available in database from November 2003 to December 2016. The database has thirteen years of data, which are in total 4, 56,004 records. Each record contains end of day
training dataset to train our model. While training our model, we are trying to find interesting association rules. We have used data from January 2012 to December 2016 for testing purpose. We have association rules generated from the data of MCX. With the use of testing dataset, we have tested association rules those we have found while training. We have selected only those association rules, which have more than 85% success rate. We have tested each rule with testing dataset and if any rule failed for more than 15% then we have rejected that rule. Table V shows sample data of
training dataset. Date represents day for which end of day price has been collected for open commodity contract. The commodity name describes the commodity for which the contract is available. Contract Expiry Date describes the date up to which contract is available for trading. Close Price is end of the day trading price of the contract. Percentage Change is a change in earlier close price as compared to close price of today. Bin values were formed using the gap of 0.25%. We have not considered those entries, which have percentage change value as zero.
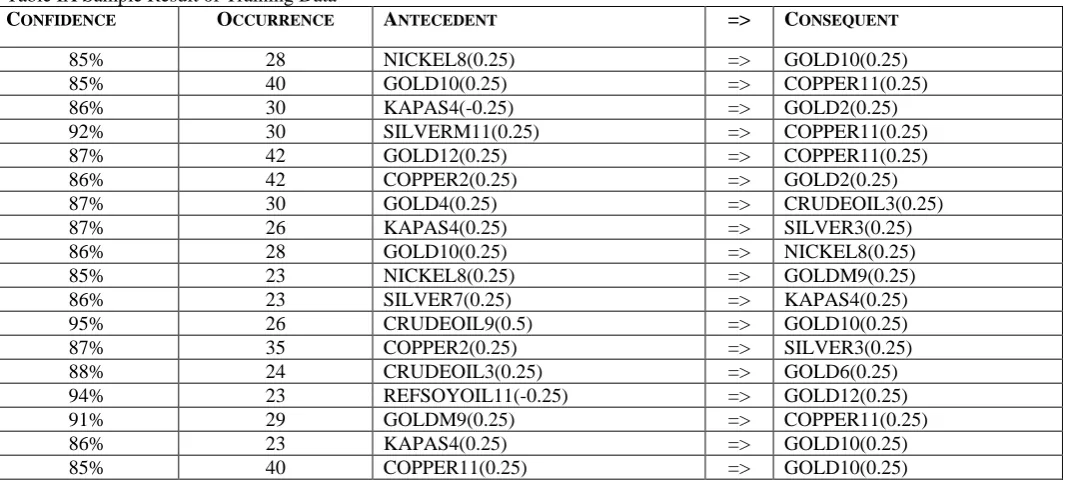
Table IX Sample Result of Training Data
CONFIDENCE OCCURRENCE ANTECEDENT => CONSEQUENT
85% 28 NICKEL8(0.25) => GOLD10(0.25) 85% 40 GOLD10(0.25) => COPPER11(0.25)
86% 30 KAPAS4(-0.25) => GOLD2(0.25)
92% 30 SILVERM11(0.25) => COPPER11(0.25) 87% 42 GOLD12(0.25) => COPPER11(0.25)
86% 42 COPPER2(0.25) => GOLD2(0.25)
87% 30 GOLD4(0.25) => CRUDEOIL3(0.25)
87% 26 KAPAS4(0.25) => SILVER3(0.25) 86% 28 GOLD10(0.25) => NICKEL8(0.25) 85% 23 NICKEL8(0.25) => GOLDM9(0.25) 86% 23 SILVER7(0.25) => KAPAS4(0.25) 95% 26 CRUDEOIL9(0.5) => GOLD10(0.25) 87% 35 COPPER2(0.25) => SILVER3(0.25) 88% 24 CRUDEOIL3(0.25) => GOLD6(0.25) 94% 23 REFSOYOIL11(-0.25) => GOLD12(0.25) 91% 29 GOLDM9(0.25) => COPPER11(0.25)
86% 23 KAPAS4(0.25) => GOLD10(0.25)
85% 40 COPPER11(0.25) => GOLD10(0.25)
[In table IX, first column and second column contain confidence and occurrence of the rule in training dataset. Third and fifth column contain antecedent and consequent in the rule. Both these columns contain encoded values which are combinations of commodity name, expiry month and bin value. For example, Last row’s third column contains value COPPER11 (0.25). COPPER is a commodity name, 11 represents the month of November and 0.25 represents percentage change in price is between 0 to 0.25%.]
Table IX shows a sample result after applying our model on training dataset. The result consists of confidence, occurrence and commodity contracts. Commodity contracts are represented as a combination value, which is a combination of commodity name, contract expiry month and bin value. Bin value represents a predefined range for percentage change. In table IX, the last rule COPPER11(0.25) GOLD10(0.25) describes that if the price of the contract for COPPER that expires in November is between 0 to 0.25 and the contract of GOLD which expires in October is open then the price of that contract will increase by 0.25%. This rule has confidence of 85% and it occurred in training database 40 times. Out of 2446
preprocessed records, we found 40 records where change in price of copper contract for the month of November is from 0 to 0.25% and gold contract for the month of October is from 0 to 0.25%. Confidence for this rule is 85%. It means that out of total transactions in 85% transactions where we found COPPER11 (0.25), we also found GOLD10 (0.25).
We have used one-third data of the complete database as testing data. Training and testing datasets are derived from the original database hence both share the common structure as shown in table V. The testing dataset contains 183528 records, which is one-third of the total records available in the original database. We have used this dataset to test association rules, which were derived from training dataset.
Table X Sample Result of Testing Data
ACCURACY OCCURRENCE ANTECEDENT => CONSEQUENT
87.50% 16 MENTHAOIL6(-4) => GOLDGUINEA6(0.25) 85% 16 NICKEL6(-0.5) => GOLDM7(0.25)
85% 10 BARLEY4(-1) => RUBBER6(1)
88.80% 15 FURNACEOIL10(-2) => CFI12(-2) 91.60% 11 REDCHILLI1(2) => DRB12(-2)
100% 10 STEELIGTMG11(-4) => CFI12(-2) 100% 16 REFSOYOIL11(-0.5) => SILVER12(0.25)
85% 13 ALUMINI7(-0.25) => GOLDGUINEA8(0.25)
85% 12 ATF3(1) => RUBBER5(-1)
85% 15 ZINC8(-0.5) => GOLDGUINEA8(0.25) 100% 14 RUBBER6(1) => BARLEY6(-1)
85% 13 GUARSEED1(3) => CFI12(-1) 100% 13 REFSOYOIL6(0.5) => GOLD8(0.25) 100% 13 RUBBER2(1) => KAPASKHALI1(3)
88% 15 FURNACEOIL10(-2) => CFI12(-2) 88.80% 12 BARLEY5(1) => TIN4(-1)
[In table X, first column and second column contains occurrence of rule in testing dataset and training dataset respectively. Third and fifth column contains antecedent and consequent in rule. Both these columns contain encoded values which are combinations of commodity name, expiry month and bin value. For example, First row’s third column contains value MENTHAOIL6 (-4). MENTHAOIL is a commodity name, 6 represents the month of June and -4 represents percentage change in price is between -3.75% to -4%.]
Table X shows sample results of testing data. After applying our model on training dataset, we have association rules as shown in table X. For testing these rules, we have used testing dataset. We have verified each rule, which was generated from training dataset. We have checked occurrence of antecedent with consequent and occurrence of antecedent without consequent. For every rule, if the antecedent occurred with the consequent then we have considered that rule. Otherwise, for every rule if the antecedent occurred without the consequent for more than 15% of total occurrence of antecedent then we have rejected that rule. The result shown in table X proves existence of co-movement between fundamentally different commodity contracts. These rules guarantee that correlation exists between fundamentally different commodity contracts. These rules are useful for investment in commodity futures contracts to plan short-term investment strategy. Intraday traders are mostly investing in a single day and need return on the same day. Therefore, these rules will help intraday traders to trade in commodity futures.
Our results are useful for intraday trading in commodity futures. If a person is aware about uncommon relationships between contracts of two fundamentally different commodities, then he can use that knowledge to earn profit by buying and selling a contract on the same day. To show the use of our results, we have considered a hypothetical situation where Mr. X is an active trader of the MCX commodity exchange. He wants to make profit by investing
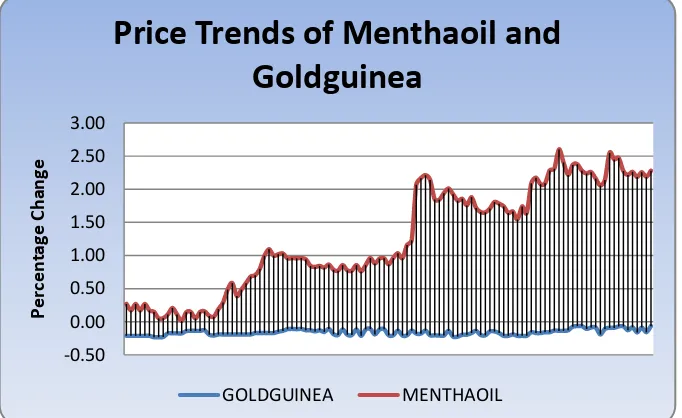
in commodity futures for a short time. He wants to make money from intraday trading in commodity futures. There is an association rule regarding the price of future contract of Gold guinea, which expires in March, goes down up to 0.25%. The rule says that if the price of future contract for Gold guinea that expires in March goes down up to 0 to 0.25% and if a future contract of Mentha oil that expires in March is available for trading, then the price of the future contract for Mentha oil of March will go up to 2.50% to 2.75%. Graph I shows intraday price movement of future contracts for Mentha oil and Gold guinea on 28 February 2017. At 10:30 A.M., Mr. X has observed that the price of future contract of Gold guinea for the month of March has gone up to 0.21% down. As per the rule if March contract of Gold guinea goes down then March contract of Mentha oil goes up. Therefore, he has purchased future contract of Mentha oil for the month of March at the price of Rs.1023 per KG. The least trading unit for Mentha oil is 360 KGS (two drums). Therefore, he brought two drums of Mentha oil for the future date. By this way, he has invested Rs. 3, 68,280. At 03:56 P.M., the price of the future contract for Mentha oil for the month of March hits the target price. The price increased up to 2.74%, which is 28 rupees per KG. He sold that contract at the price of Rs. 1047 per KG. He got Rs. 3, 76,920 of that contract from which Rs. 8640 was the profit earned by him.
Graph I Intraday Price movements of Mentha oil and Gold guinea
-0.50 0.00 0.50 1.00 1.50 2.00 2.50 3.00
Per
cen
ta
ge
Ch
an
ge
Price Trends of Menthaoil and
Goldguinea
V. CONCLUSION
Commodity markets are getting more popular because they offer better options for investment. Availability of enormous amount of financial data motivated us for this research. We believe that there is a great potential for studying commodity market. Commodity market has emerged as the best alternative to secure investment and risk cover. There are various methods available for data analysis, but no one method can outperform the rest of the others. Several methods are available to analyze the data of MCX for price prediction and trend prediction for future contracts of commodities. If traders have information about short-term interlinks of future contract price movements then it will help them to predict the short-term trend, which they may use to secure their investments. Moreover, our results are helpful in intraday trading also. If someone wants to invest in contract of X commodity and if there is a rule that if the contract price of Y commodity increases then the contract price of X commodity decreases. The trader can wait for an increase in the contract price of Y. If the contract price of Y commodity increases, then that will give the signal to trader. The trader can wait for the fall in the contract price of X commodity. As and when the contract price of X commodity decreases, trader can invest his money. This will give the trader an opportunity to buy the same contract at the lower rate to reduce the risk or to maximize the profit. If there is exactly the opposite rule available for same commodities then that can be used to sale the contract with higher profit.
Our model is based on improved apriori algorithm, which is one of the best data-mining algorithms that give more precise and accurate results. We have used trie data structure to overcome the limitations of the classic apriori algorithm. We have also used optimized, filtered and sorted commodity transactions to reduce input-output cost. To improve performance of the algorithm, we have used reduced pruning technique. Our improved apriori algorithm requires only one time scan of the database and two times scan of reduced transactions from the memory. Our algorithm is faster than the optimized implementation of apriori algorithm regardless of the size of database.
Unlike most other researchers, we have not used monthly or yearly summarized data. Instead, we have used end of day data that gives more detail view of the price movement of future contracts. We have collected 456004 of the records from the website of MCX and applied our model on these data. While testing our model, we found some association rules with a 100% success rate. Most of the existing methods are based on statistics or macroeconomics. Some of the methods that we have studied are able to find out correlations between future contracts if the trend is continuing. Those methods are not capable to track the random trend in price co-movement of future contracts. Most of the methods are able to find whether a correlation exists between two commodities or not. Some of the methods are able to track positive as well as negative correlations but very few methods are available to track random moves of commodity prices. Moreover, the results generated by them have just summarized the trend and not describing it in detail. For example, most of the results were like contracts of gold and silver commodities are correlated for any specific year or month but the price at which they
correlate was missing. Our results describe not just the correlations but the price at which they correlate is also covered. If traders have some prior information about the price change of the contract of one commodity then they can use this information to find the price change of the contract of co-moving commodity. Apart from this, the results are helpful to traders to minimizing their risks while trading in commodity futures. In intraday trading, our results are helpful to traders. If traders are ready to take risks then they can earn good profit by using association rules generated from the available data. Our rules give signals to traders for purchasing contracts at lower prices and sale contracts at higher prices. During the last five years, researchers have noticed tremendous growth in commodity trading in India. Therefore, our research will be helpful to investors by providing an alternative way to analyze commodity futures market trend.
VI. REFERENCES
[1] K R Sharma, "A Study of Commodity Futures in India," Asia Pacific Journal of Research, vol. 2, no. 4, June 2013.
[2] Gouri Prava Samal, Anil Swain, Ansuman Sahoo, and Amit Soni, "Market Efficiency of Agricultural Commodity Futures in India: A Case of Selected Commodity Derivatives Traded On Ncdex During 2013," International Journal of Business and Management Invention, vol. 4, no. 1, 2015.
[3] Piero Cinquegrana, "The Need for Transparency in Commodity and Commodity Derivatives Markets," December 2008.
[4] Niyati Chaudhary, "Issues and Regulations of Derivatives Market in India: An Overview," ANVESHAK-International Journal of Management, vol. 4, pp. 100-109, 2015.
[5] Aboutus. [Online].
[6] Pratibha Mandave, Megha Mane, and Sharada Patil, "Data mining using Association rule based on APRIORI algorithm and improved approach with illustration," International Journal of Latest Trends in Engineering and Technology, vol. 3, no. 2, November 2013.
[7] Prasanna M. Kothawale, "A Performance Study of Apriori Implementation in Data Mining using Vectors," Imperial Journal of Interdisciplinary Research, vol. 2, no. 6, 2016.
[8] Ehsan Hajizadeh, Hamed Davari Ardakani, and Jamal Shahrabi, "Application of data mining techniques in stock markets: A survey," Journal of Economics and International Finance, vol. 2, no. 7, pp. 109-118, July 2010.
[9] Rahul Thakkar and Rustom Morena, "A Performance Comparison between Rule Based and Association Rule Mining Algorithms in Extracting Knowledge from Stock Market Database," International Journal of Computer Science And Technology, vol. 5, no. 1, 2014.
[10] Mohammed Al-Maolegi and Bassam Arkok, "An Improved Apriori Algorithm For Association Rules," International Journal on Natural Language Computing, vol. 3, no. 1, February 2014.
[11] K.Saravana Kumar and R.Manicka Chezian, "A Survey on Association Rule Mining using Apriori Algorithm," International Journal of Computer Applications, vol. 45, no. 5, May 2012.
Breaks and The Relationship Between Soyabean and Corn Futures Prices on The Dalian Commodity Exchange of China," IFIP International Federation for Information Processing, vol. 294, pp. 919-926, 2009.
[13] Joseph P. Janzen, Aaron D. Smith, and Colin A. Carter, "Commodity Price Comovement:The Case of Cotton," in NCCC-134 Conference on Applied Commodity Price Analysis,Forecasting and Market Risk Management, St. Louis, Missouri, 2012.
[14] Sławomir Śmiech, "Co-movement of Commodity Prices – Results from Dynamic Time Warping Classification," Cracow University of Economics, Working Paper 2015.
[15] Francesca de Nicola, Pierangelo De Pace, and Manuel A. Hernandez, "Co-Movement of Major Commodity Price Returns A Time-Series Assessment," International Food Policy Research Institute, Working Paper June 2014.
[16] Mthuli Ncube, Dawit B Tessema, and Daniel Zerfu Gurara, "Volatility and Co-movement in Commodity Prices: New Evidence," Working Paper Series African Development Bank, vol. 205, July 2014.
[17] Dinçer DEDEOĞLU, "Evolution of comovement between
commodity futures: does biofuels matter?," Theoretical and Applied Economics, vol. XXI, no. 6, pp. 37-50, 2014.
[18] P Prakash and S Sundararajan, "An Empirical Analysis on the Relationship between Gold and Silver with Special Reference to the National Level Commodity Exchanges, India," International Journal on Recent and Innovation Trends in Computing and Communication, vol. 2, no. 8, pp. 2224 – 2233, International Journal on Recent and Innovation Trends
in Computing and Communication.
[19] Manisha Pradhananga, "Financialization and the Rise in Comovement of Commodity Prices," WORKINGPAPER SERIES Political Economy Research Institute, vol. 376 , February 2015.
[20] Yoichi Tsuchiya, "Linkages among commodity futures prices in the recent financial crisis: An application of cointegration tests with a structural break," Economics Bulletin, vol. 30, no. 3, pp. 1772-1777, July 2010.
[21] Kamlesh Pandey and Narendra Pradhan, "An Analytical and Comparative Study of Various Data Preprocessing Method in Data Mining," International Journal of Emerging Technology and Advanced Engineering, vol. 4, no. 10, 2014.
[22] Chirag Mewada and Morena Rustom, "Trie Based Improved Apriori Algorithm to Generate Association Rules," International Journal of Advanced Research in Computer and Communication Engineering, vol. 5, no. 10, pp. 430-436, October 2016.