Page 1 of 9
Original Article
Relevance of arm somatic copy number alterations for oncologic
outcomes and tumor immune microenvironment in clear cell renal
cell carcinoma
Ying Xiong#, Yu Qi#, Qi Bai, Yu Xia, Li Liu, Jianming Guo
Department of Urology, Zhongshan Hospital, Fudan University, Shanghai 200032, China
Contributions: (I) Conception and design: J Guo, L Liu, Y Xiong; (II) Administrative support: J Guo, L Liu; (III) Provision of study materials or patients: Y Xia, Q Bai; (IV) Collection and assembly of data: Y Xiong, L Liu, Y Qi; (V) Data analysis and interpretation: J Guo, Y Xiong, L Liu, Y Qi; (VI) Manuscript writing: All authors; (VII) Final approval of manuscript: All authors.
#These authors contributed equally to this work.
Correspondence to: Jianming Guo; Li Liu. Department of Urology, Zhongshan Hospital, Fudan University, Shanghai 200032, China. Email guo.jianming@zs-hospital.sh.cn; liuli901@qq.com.
Background:Prognostic value of arm somatic copy number alterations (SCNAs) in clear cell renal cell carcinoma (ccRCC) have not been systematically evaluated in a large cohort. Its association with tumor microenvironment remained unknown.
Methods:We retrospectively correlated arm SCNAs with OS and recurrence free survival (RFS) in a cohort of 524 ccRCC patients. The prognostic landscape of arm SCNA was depicted by bubble heatmap. Associations between arm SCNAs and tumor microenvironment were evaluated by CIBERSORT and Gene Set Enrichment Analysis (GSEA).
Results: We found that amplifications of 1p, 3p and loss of 4p, 4q, 5p, 5q, 11p, 11q, 11q, 13q, 19p were independent adverse risk factor for OS, while amplification of 1q and deletions of 4p, 4q, 9p, 9q associated with worse RFS. Loss of 4q were independent adverse risk factor for OS (P=0.012, HR =1.614) and RFS (P=0.001, HR =2.005). It could identify a subset of early stage ccRCC patients with high risk of death and recurrence. CXCL9, CXCL10, CXCL11 mRNA level and CD8+ T cell infiltration were downregulated in ccRCC with 4q deletion. Patients with high arm SCNA level had shorter OS (P=0.005) and RFS (P=0.001). Markers, immune cells and pathways referring to immune suppression were elevated in tumors with high arm SCNA level.
Conclusions: In conclusion, loss of 4q was an independent adverse risk factor for OS and RFS in ccRCC patients and contributed to cytotoxic cell exclusion via downregulation of CXCL9, CXCL10 and CXCL11. Patients with higher arm SCNAs had worse survival and a more immunosuppressive tumor microenvironment.
Keywords: Somatic copy number alterations; prognosis; immune microenvironment; clear cell renal cell carcinoma (ccRCC)
Submitted Jul 09, 2019. Accepted for publication Oct 10, 2019. doi: 10.21037/atm.2019.10.54
View this article at: http://dx.doi.org/10.21037/atm.2019.10.54
Introduction
Renal cell carcinoma (RCC) represents 2–3% adult malignancies and inflicts about 271,000 new patients worldwide every year (1,2). Clear cell renal cell carcinoma
Page 2 of 9
after curative surgeries (4). Currently there are clear clinical needs at the two extremes of ccRCC risk: those with early stage disease choosing management strategies and those with localized late stage ccRCC who might benefit from adjuvant tyrosine kinase inhibitor (TKI) therapies after curative nephrectomy (5).
It is well established that genetic alterations and a net accumulation are responsible for cancer development and progression (6). Some genetic alterations are significantly associated with stage, grade and prognosis (7). For example, in ccRCC loss of chromosome arms 8p, 9p and 14q is associated with higher stage and grade; deletions of 9p correlates with early recurrence (8). However, the prognostic value of each arm SCNA in ccRCC has not been systematically evaluated in a large cohort. Besides, it is increasingly recognized that tumor microenvironment plays a fundamental role in tumor progression (9). Previous researches suggested tumor aneuploidy correlated with markers of immune evasion in some malignancies (10). Relations between histologic features, clinical outcomes and cytogenetic aberrations have been studied (11), but further crosstalk between arm SCNA and tumor immune microenvironment in ccRCC remained unknown. Comprehensive genetic profiling and its associations with tumor microenvironment may not only provide insights into the mechanisms of tumor progression, but also provide potential prognostic biomarkers (12).
In this study, we retrospectively correlated arm somatic copy number alterations with clinicopathological information and oncologic outcomes in a cohort of 524 ccRCC patients, demonstrating the prognostic landscape of arm SCNAs. We further analyzed how arm SCNA burden impact patient survival and tumor microenvironment in ccRCC.
Methods
Patients and data collection
We retrospectively analyzed the copy number alterations, gene expression profiles and clinical information of 524 ccRCC patients who had undergone nephrectomy in The Cancer Genome Atlas (TCGA) Kidney Clear Cell Renal Cell Carcinoma (KIRC) cohort. Copy number alterations of each sample were downloaded and processed from cBioPortal (http://www.cbioportal.org/). Clinical information of the TCGA KIRC cohort was obtained from the TCGA Pan-cancer Clinical Data Resource, which
provides high-quality clinical data (13). We used the UCSC Xena (https://xenabrowser.net/heatmap/) to download RNA-seq data. The mRNA levels were evaluated with bulk tumor samples. Patients with incomplete genetic or clinical information were excluded. Patients who received neoadjuvant therapy were not included neither. The study was approved by the Clinical Research Ethics Committee of Zhongshan Hospital, Fudan University with the approval number B2015-030.
Estimated immune cell type infiltrations
CIBERSOTR is a computational method for inferring leukocyte representation in bulk tumor transcriptomes and has been proved to have strong agreement with ground truth assessments in bulk tumors (14,15). We used CIBERSORT to calculate the absolute normalized cell count and relative cell fraction of major immune cell types with LM22 gene signature. To support results obtained with CIBERSORT, we also compared the metagene value for Treg cells, macrophages and NK cells with three well-established immune signatures (16). The metagene values were computed to summarize an immune gene signature as the mean value of each gene in the category. Comparison of gene expression profiles of arm SCNAhigh versus SCNAlow tumors was carried out with Gene Set Enrichment Analysis (GSEA) to gain more biological understanding of arm SCNAs in ccRCC (17).
Statistical analysis
Kaplan-Meier analysis with log-rank test demonstrated the survival curves and survival differences between arm
SCNAhigh and arm SCNAlow tumors. OS was defined as
the time of curative surgery to the time of death or last follow up time, while recurrence free survival (RFS) was calculated as the time from surgery to the time of recurrence or metastasis. Patients with metastatic renal cell carcinoma were excluded from RFS analyses. The prognostic value of arm SCNAs was evaluated by univariate and multivariate analyses. Comparisons of clinicopathological parameters between two groups were carried out by Student t test or Mann-Whitney U test depending on normality of the data distribution, Pearson’
s chi-square test and Cochran-Mantel-Haenszel χ2 test.
Results
Bubble heatmaps demonstrate the prevalence and prognostic landscape of arm somatic copy number alterations in ccRCC
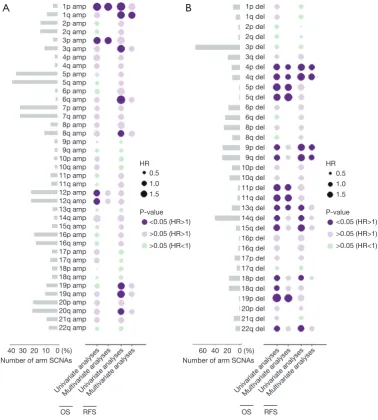
Figure 1 shows the percentage of arm SCNAs and their
prognostic value with univariate as well as multivariate analysis respectively. Arm SCNAs present in less than 1% ccRCC samples were not displayed. Amplification of 5q (39.7%), 5p (36.1%), 7p (32.6%), 7q (32.6%), 12q (23.1%), 12p (23.1%), 20q (21.9%) and 20p (21.4%) occurred in
over 20% of ccRCC (Figure 1A). In the bubble heatmaps, a
Figure 1 Bubble heatmaps demonstrate the prognostic landscape of arm somatic copy number alterations in ccRCC. (A) Prevalence of arm
somatic copy number amplifications and their association with OS and RFS; (B) prevalence of arm somatic copy number deletions and their association with OS and RFS. A dark purple bubble indicates that the arm SCNA significantly associates with shorter OS or RFS, while a light purple bubble indicates that the arm SCNA associates with shorter OS or RFS without statistical significance. Likewise, a light green bubble indicates that the arm SCNA associates with prolonged OS or RFS without statistical significance. The size of the bubble indicates the hazard ratio. Amp, amplification; Del, deletion; RFS, recurrence-free survival; SCNA, somatic copy number alteration; ccRCC, clear cell
renal cell carcinoma.
Number of arm SCNAs Number of arm SCNAs
Univariate analysesMultivariate analysesUnivariate analysesMultivariate analyses Univariate analysesMultivariate analysesUnivariate analysesMultivariate analyses
Page 4 of 9
dark purple bubble indicated a significant association with worse OS or RFS while the size of the bubble indicated the hazard ratio (HR). In univariate analysis of copy number amplification for OS, 1p (P=0.002, HR =2.497), 3p (P=0.041, HR =1.947), 12p (P=0.009, HR =1.555) and 12q (P=0.013, HR =1.520) were associated with shorter OS. For RFS, 1p (P=0.011, HR =2.538), 1q (P=0.002, HR =2.163), 3q (P=0.002, HR =2.042), 6q (P=0.030, HR =2.696), 8q (P=0.036, HR =1.69), 19p (P=0.010, HR =1.859), 19q (P=0.003, HR =1.985) and 20q (P=0.028, HR =1.584) were adverse risk factors. The prognostic value of arm SCNA was further assessed by multivariable cox regression analyses each, with stage and grade as covariates. Amplification of 1p (P=0.012, HR =2.11), 3p (P=0.034, HR =2.01) and 1q (P=0.022, HR =1834) were independent adverse risk factor
for OS or RFS in multivariate analysis (Figure 1A).
The most frequent arm somatic copy number loss is 3p (71.9%), followed by 14q (40.4%), 9q (28.6%), 9p (28.1%),
8p (26.0%) and 6q (24.0%) (Figure 1B). We found that loss
of 4p (OS: P<0.001, HR =2.024; RFS: P<0.001, HR =2.57), 4q (OS: P<0.001, HR =2.294; RFS: P<0.001, HR =3.13), 9p (OS: P<0.001, HR =1.898; RFS: P<0.001, HR =1.745), 9q (OS: P<0.001, HR =1.745; RFS: P<0.001, HR =2.624), 13q (OS: P=0.001, HR =1.895; RFS: P=0.018, HR =1.731), 14q (OS: P=0.002, HR =1.623; RFS: P=0.004, HR =1.681) , 15q (OS: P=0.002, HR =2.158; RFS: P<0.001, HR =2.695), 18p(OS:P=0.002, HR =1.766; RFS: P=0.049, HR =1.548) and 22q (OS: P=0.008, HR =1.851; RFS: P=0.003, HR =2.240) associated with worse OS and RFS in univariate analyses. After adjustment for stage and grade, deletion of 4p (P=0.018, HR =1.558), 4q (P=0.012, HR =1.614) and 13q (P=0.021, HR =1.588) remained their statistical significance for OS while 4p (P=0.005, HR =1.858), 4q (P=0.001, HR =2.005), 9p (P=0.013, HR =1.629) and 9q (P=0.020, HR =1.583) remained significant as an independent adverse risk
factor for RFS (Figure 1B).
Loss of 4q contributes to CD8+ T cell exclusion and identifies a subset of early stage patients with high risk of death and recurrence
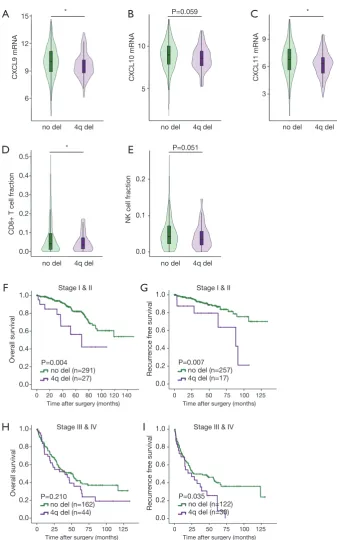
The findings suggested that deletion of 4q and 4p are the only independent adverse risk factors for both OS and RFS. Genes encoding chemoattractant for major cytotoxic CD8+T cells and NK cells, CXCL9, CXCL10 and CXCL11 all located on 4q.21. We found that CXCL9 (P=0.029), CXCL10 (P=0.059) and CXCL11 (P=0.017) mRNA expression were all significantly downregulated in ccRCC
tumors with 4q deletion (Figure 2A,B,C). CIBERSORT
analysis revealed that CD8+ T cell infiltration (P=0.002) and NK cell infiltration (P=0.051) decreased in ccRCC tumors
with loss of 4q (Figure 2D,E). These findings suggested that
4q deletion led to immune exclusion via downregulation of CXCL9, CXCL10 and CXCL11.
There are clear clinical needs for identifying early stage patients with high risk of metastasis and late stage patients who might benefit from adjuvant TKI treatment, so we further explored the prognostic value of 4q and 4p in different stages of ccRCC patients. Analysis of Kaplan-Meier log-rank test revealed that deletion of 4q associated with both worse OS (P=0.004) and RFS (P=0.007) in early
stage (I & II) ccRCC patients (Figure 2F,G). Among early
stage ccRCC patients, multivariate analyses showed that 4q deletion remained an independent risk factor for OS (P=0.018, HR =2.572, 95% CI: 1.173–5.639) and RFS (P=0.043, HR =2.634, 95% CI: 1.033–6.721) when factoring in tumor grade and stage. Thus, loss of 4q was a promising biomarker that could identify a subset of early stage ccRCC patients with a high risk of death and recurrence. Besides, in stage III & IV patients, 4q loss indicated a shorter RFS (Figure 2H,I). Stage I & II patients with 4p deletion had
shorter OS (Figure S1A,B) while stage III & IV with 4p
deletion had worse RFS (Figure S1C,D).
High level of arm copy number alterations associates with worse survival and higher tumor mutation burden
Number of arm SCNAs was split at median. Tumor with
six or more arm SCNAs was considered arm SCNAhigh
while tumors with less than six arm SCNAs was considered
arm SCNAlow. We analyzed the correlations between
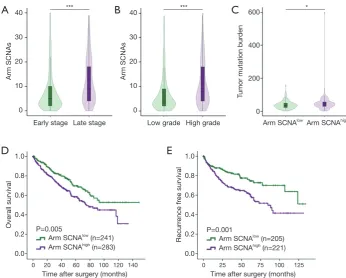
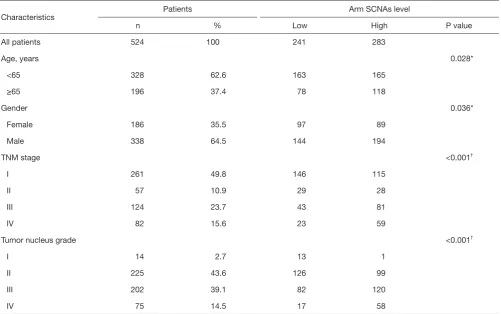
clinicopathological characteristics and arm SCNA level. Tumors of people over 65 years old (P=0.028) and males (P=0.036) tended to harbor high arm SCNA level. High arm SCNA level also associated with higher tumor stage
(P<0.001) and grade (P<0.001) (Table S1). Late stage and
high grade ccRCC had more copy number alterations compared with early stage (P<0.001) and low grade
(P<0.001) tumors, respectively (Figure 3A,B). In ccRCC,
tumor mutation burdens are more abundant in arm
SCNAhigh tumors (P=0.028), in contrast to a previous study
showing that there are more SCNAs in tumors with low
mutation burden (18) (Figure 3C). Kaplan-Meier analysis
showed that arm SCNAlow patients had significantly
prolonged OS (P=0.005) and RFS (P=0.001) compared with
arm SCNAhigh patients (
Figure 2 Loss of 4q contributes to CD8+ T cell exclusion and identifies a subset of early stage patients with high risk of death and recurrence. (A) CXCL9 mRNA expression in patients with or without 4q deletion; (B) CXCL10 mRNA expression in patients with or
without 4q deletion; (C) CXCL11 mRNA expression in patients with or without 4q deletion; (D) CD8+ T cell infiltration in patients with or without 4q deletion; (E) NK cell infiltration in patients with or without 4q deletion; (F) Kaplan-Meier analysis of 4q deletion for OS in
stage I & II patients; (G) Kaplan-Meier analysis of 4q deletion for RFS in stage I & II patients; (H) Kaplan-Meier analysis of 4q deletion for OS in stage III & IV patients; (I) Kaplan-Meier analysis of 4q deletion for RFS in stage III & IV patients. *, P<0.05. Del, deletion; RFS, recurrence-free survival.
CD8+ T cell fraction
0.5
Time after surgery (months) Stage I & II
Time after surgery (months)
25 50 75
0 100 125 0 25 50 75 100 125
Time after surgery (months) Time after surgery (months) Stage I & II
Stage III & IV
P=0.210
Stage III & IV
Page 6 of 9
Immunosuppressive immune cells and T cell exhaustion markers enriched in high arm copy number alteration
patients
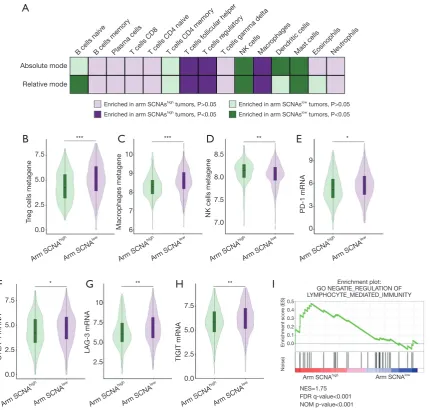
ccRCCs are highly immunogenic tumors. We wondered whether arm SCNA could imparted different features on the tumor microenvironment. CIBERSORT analysis was performed to unveil the immune cell composition in arm
SCNAhigh and arm SCNAlow tumors. Treg cells, macrophages
and TFH cells significantly enriched in arm SCNAhigh tumors in terms of both absolute cell count and relative cell fraction. On the other hand, NK cells and mast cells were reduced in
arm SCNAlow tumors (
Figure 4A). To confirm our findings, we evaluated the established metagene value for Treg cells, macrophages and NK cells, which had been well recognized for their pro- or anti-tumor abilities. In accordance with CIBERSORT analysis, gene signature of Treg cells and
macrophages were significantly elevated in arm SCNAhigh
tumors (Figure 4B,C). NK cells metagene values were
down-regulated in arm SCNAhigh tumors (Figure 4D).
In most malignancies, higher CD8+ T cell infiltration associated with prolonged survival. However, in ccRCC, higher CD8+ T cell infiltration was an adverse risk factor for patient survival (19). We did not observe any changes in CD8+ T cell infiltration. Instead, markers of T cell exhaustion including PD-1, CTLA-4, LAG-3 and TIGIT significantly elevated in arm SCNAhigh
tumors (Figure 4E,F,G,H), which indicated that the
anti-tumor immunity of CD8+ T cells in arm SCNAhigh tumors
were largely offset by immunosuppressive elements in tumor microenvironment. GSEA analyses revealed that lymphocyte mediated immunity was down-regulated in
arm SCNAhigh tumors (Figure 4I). Our findings suggested
that arm SCNAs were closely associated with immune suppression in ccRCC.
Discussion
To our knowledge, this is the first study to systematically Figure 3 High level of arm copy number alterations associates with worse survival and higher tumor mutation burden. (A) Number of arm SCNAs in early stage (I & II) and late stage (III & IV) ccRCC patients; (B) number of arm SCNAs in low grade (I & II) and high grade (III & IV) ccRCC patients; (C) tumor mutation burdens in arm SCNAhigh and SCNAlow tumors; (D) Kaplan-Meier analysis of arm SCNA
level for OS in ccRCC patients; (E) Kaplan-Meier analysis of arm SCNA level for RFS in ccRCC patients. *, P<0.05; ***, P<0.001. SCNA, somatic copy number alteration; ccRCC, clear cell renal cell carcinoma.
Overall survival
1.0
0.8
0.6
0.4
0.2
0.0
P=0.005
Arm SCNAlow (n=241)
Arm SCNAhigh (n=283)
P=0.001
Arm SCNAlow (n=205)
Arm SCNAhigh (n=221)
20 40 60 80
0 100 120 140
Time after surgery (months)
25 50 75
0 100 125
Time after surgery (months)
Recurr
ence fr
ee survival
1.0
0.8
0.6
0.4
0.2
0.0
Arm SCNAs
40
30
20
10
0
Arm SCNAs
40
30
20
10
0
Tumor mutation bur
den
600
400
200
0 Late stage
Early stage Low grade High grade Arm SCNAlowArm SCNAhigh
*** *** *
A
D
E
evaluate the prognostic landscape of arm SCNAs and the associations with tumor microenvironment in a large cohort of over 500 ccRCC patients. The most frequent alterations included deletions of 3p, 14q and gain of 5q, in complete accordance with previous studies (20). The von Hippel Lindau (VHL) gene is one of the most important tumor suppressor
gene located at 3p25.3 region in ccRCC. There is also a high concordance of other chromosome aberrations such as loss of 6q, 8p, 9q and amplification of 7p, 7q, 12q. In ccRCC, some arm SCNAs were associated with clinicopathological features. Significant associations with late tumor stage or grade were observed for loss of 9p, 9q, 14q, 18p, 21q (12). There was a Figure 4 Immunosuppressive immune cells and T cell exhaustion markers enriched in patients with high level of arm copy number alterations. (A) Different features of immune cell composition in arm SCNAhigh and arm SCNAlow tumors; (B) Treg cells metagene values
in arm SCNAhigh and arm SCNAlow tumors; (C) Macrophages metagene values in arm SCNAhigh and arm SCNAlow tumors; (D) NK cells
metagene values in arm SCNAhigh and arm SCNAlow tumors; (E) PD-1 mRNA level in arm SCNAhigh and arm SCNAlow tumors; (F)
CTLA-4 mRNA level in arm SCNAhigh and arm SCNAlow tumors; (G) LAG-3 mRNA level in arm SCNAhigh and arm SCNAlow tumors;
(H) TIGIT mRNA level in arm SCNAhigh and arm SCNAlow tumors; (I) gene set enrichment analysis of “NEGATIE_REGULATION OF
LYMPHOCYTE_MEDIATED_IMMUNITY” pathway in arm SCNAhigh versus arm SCNAlow tumors. **, P<0.01. SCNA, somatic copy
number alteration. *, P<0.05; **, P<0.01; ***, P<0.001. Absolute mode
Relative mode
B cells naiveB cells memoryPlasma cells T cells follicular helperT cells r egulatory
T cells gamma deltaNK cellsMacr ophages
Dendritic cellsMast cellsEosinophilsNeutr ophils T cells CD8T cells CD4 naiveT cells CD4 memory
Enriched in arm SCNAslow tumors, P>0.05
Enriched in arm SCNAslow tumors, P<0.05
Enriched in arm SCNAshigh tumors, P>0.05
Enriched in arm SCNAshigh tumors, P<0.05
Page 8 of 9
high rate of chromosomal imbalances with loss of 9q, 15q, 18p, 18q, 22q and gains of 1q, 8q in RCC with sarcomatoid differentiations (21). In this study, we found almost all of these arm SCNAs correlated with worse OS or RFS in univariate analyses except loss of 21q.
According to previous studies that included survival as an end point, deletions of 4p, 8p, 9p, 14q and gain of 8q have been suggested to correlate with poorer survival (11,22-24). Loss of 4p, 9p maintained as independent adverse risk factors when factoring stage and grade with multivariate analyses in our study. Furthermore, we identified that 4q as an independent adverse risk factor for both OS and RFS in ccRCC. It could also stratify a subset of early stage ccRCC patients with a higher risk of death and recurrence. The prognostic value of 4q deletion has not been discovered before, partly because of the limited sample size and inappropriate statistical power in previous studies. Chemokines responsible for CD8+ T cell recruitment including CXCL9, CXCL10 and CXCL11 located on chromosome 4q. Expression analysis reveal that CXCL9, CXCL10 and CXCL11 were downregulated in ccRCC with 4p deletions. CD8+ T cell infiltration significantly deceased in 4q deletion tumors. These findings indicated that loss of 4q contributed to CD8+ T cell exclusion via downregulation of CXCL9, CXCL10 and CXCL11, which led to worse survival in patients with 4q deletions. In contrary to previous reports that gain of 5q and deletion of 3p were associated with better prognosis, we found that no arm SCNA correlated with prolonged survival with statistical significance (11,25).
Tumors with high arm SCNA level harbored higher tumor mutation burden, elevated infiltrations of macrophages and Treg cells. Treg cells and tumor associated macrophages contributed substantially to the suppression of antitumor T cell responses as they frequently accumulate in the tumor microenvironment (26). On the contrary, there
were fewer NK cells and mast cells in arm SCNAhigh tumors.
NK cells are considered important anti-cancer effector cells, as they can kill neoplastic cells presenting the MHC class I molecule (9). Mast cells could boost anti-tumor immunity and associate with prolonged survival in ccRCC as well (27). Markers and pathways referring to immune evasion were also upregulated in tumors with more arm SCNAs. Arm SCNA level correlated with markers of immune evasion and immunosuppressive immune cell infiltration, consistent with a mechanism related to gene dosage imbalance instead of functions of certain genes. Our findings suggested that arm SCNAs were closely associated with immune suppression in ccRCC. The altered tumor microenvironment conferred by
4q loss might also suggested a potential link between 4q loss and immunotherapy treatment response for metastatic renal cell carcinoma. Genomic instability and immune evasion
in arm SCNAhigh tumors may contribute to the shortened
survival in patients with high arm SCNA level.
However, some major limitations remained. This is a retrospective study without external validation. Cohort specific biases including patient ethnicity/race and clinical practice at the institution could affect our conclusions. These results will need to be further validated and confirmed in prospective randomized clinical trials.
Conclusions
In conclusion, we demonstrated the prognostic landscape of each arm SCNA in ccRCC and identified 4q deletion as independent adverse risk factors for both OS and RFS. Early stage ccRCC patients with 4q deletion had higher risk of death and recurrence. Loss of 4q contributed to cytotoxic cells exclusion via down regulation of CXCL9, CXCL10 and CXCL11. Higher arm SCNA burden correlated with worse survival and a more immunosuppressive tumor microenvironment.
Acknowledgments
Funding: This study was funded by grants from National
Natural Science Foundation of China (81702496, 81702497, 81702805 and 81772696). All these study sponsors have no roles in the study design, in the collection, analysis, and in the interpretation of data.
Footnote
Conflicts of Interest: The authors have no conflicts of interest to declare.
Ethical Statement: The authors are accountable for all
aspects of the work in ensuring that questions related to the accuracy or integrity of any part of the work are appropriately investigated and resolved. The study was approved by the Clinical Research Ethics Committee of Zhongshan Hospital, Fudan University with the approval number B2015-030.
References
burden of cancer in 2008: GLOBOCAN 2008. Int J Cancer 2010;127:2893-917.
2. Siegel RL, Miller KD, Jemal A. Cancer statistics, 2019. CA Cancer J Clin 2019;69:7-34.
3. Cohen HT, McGovern FJ. Renal-cell carcinoma. N Engl J Med 2005;353:2477-90.
4. Meskawi M, Sun M, Trinh QD, et al. A review of integrated staging systems for renal cell carcinoma. Eur Urol 2012;62:303-14.
5. Motzer RJ, Ravaud A, Patard JJ, et al. Adjuvant Sunitinib for High-risk Renal Cell Carcinoma After Nephrectomy: Subgroup Analyses and Updated Overall Survival Results. Eur Urol 2018;73:62-8.
6. Cahill DP, Kinzler KW, Vogelstein B, et al. Genetic instability and darwinian selection in tumours. Trends Cell Biol 1999;9:M57-60.
7. Friedlander ML, Hedley DW, Taylor IW. Clinical and biological significance of aneuploidy in human tumours. J Clin Pathol 1984;37:961-74.
8. Moch H, Presti JC, Jr., Sauter G, et al. Genetic aberrations detected by comparative genomic hybridization are associated with clinical outcome in renal cell carcinoma. Cancer Res 1996;56:27-30.
9. Palucka AK, Coussens LM. The Basis of Oncoimmunology. Cell 2016;164:1233-47.
10. Davoli T, Uno H, Wooten EC, et al. Tumor aneuploidy correlates with markers of immune evasion and with reduced response to immunotherapy. Science 2017. doi: 10.1126/science.aaf8399.
11. Klatte T, Rao PN, de Martino M, et al. Cytogenetic profile predicts prognosis of patients with clear cell renal cell carcinoma. J Clin Oncol 2009;27:746-53.
12. Chen M, Ye Y, Yang H, et al. Genome-wide profiling of chromosomal alterations in renal cell carcinoma using high-density single nucleotide polymorphism arrays. Int J Cancer 2009;125:2342-8.
13. Liu J, Lichtenberg T, Hoadley KA, et al. An Integrated TCGA Pan-Cancer Clinical Data Resource to Drive High-Quality Survival Outcome Analytics. Cell 2018;173:400-16.e11. 14. Gentles AJ, Newman AM, Liu CL, et al. The prognostic
landscape of genes and infiltrating immune cells across human cancers. Nat Med 2015;21:938-45.
15. Newman AM, Liu CL, Green MR, et al. Robust
enumeration of cell subsets from tissue expression profiles. Nat Methods 2015;12:453-7.
16. Bindea G, Mlecnik B, Tosolini M, et al. Spatiotemporal
dynamics of intratumoral immune cells reveal the immune landscape in human cancer. Immunity 2013;39:782-95. 17. Subramanian A, Tamayo P, Mootha VK, et al. Gene set
enrichment analysis: a knowledge-based approach for interpreting genome-wide expression profiles. Proc Natl Acad Sci U S A 2005;102:15545-50.
18. Ciriello G, Miller ML, Aksoy BA, et al. Emerging landscape of oncogenic signatures across human cancers. Nat Genet 2013;45:1127-33.
19. Fridman WH, Zitvogel L, Sautes-Fridman C, et al. The immune contexture in cancer prognosis and treatment. Nat Rev Clin Oncol 2017;14:717-34.
20. Moore LE, Jaeger E, Nickerson ML, et al. Genomic copy number alterations in clear cell renal carcinoma: associations with case characteristics and mechanisms of VHL gene inactivation. Oncogenesis 2012;1:e14. 21. Ito T, Pei J, Dulaimi E, et al. Genomic Copy Number
Alterations in Renal Cell Carcinoma with Sarcomatoid Features. J Urol 2016;195:852-8.
22. Klatte T, Kroeger N, Rampersaud EN, et al. Gain of chromosome 8q is associated with metastases and poor survival of patients with clear cell renal cell carcinoma. Cancer 2012;118:5777-82.
23. Elfving P, Mandahl N, Lundgren R, et al. Prognostic implications of cytogenetic findings in kidney cancer. Br J Urol 1997;80:698-706.
24. La Rochelle J, Klatte T, Dastane A, et al. Chromosome 9p deletions identify an aggressive phenotype of clear cell renal cell carcinoma. Cancer 2010;116:4696-702.
25. Gunawan B, Huber W, Holtrup M, et al. Prognostic impacts of cytogenetic findings in clear cell renal cell carcinoma: gain of 5q31-qter predicts a distinct clinical phenotype with favorable prognosis. Cancer Res 2001;61:7731-8.
26. Speiser DE, Ho PC, Verdeil G. Regulatory circuits of T cell function in cancer. Nat Rev Immunol 2016;16:599-611. 27. Fu H, Zhu Y, Wang Y, et al. Tumor Infiltrating Mast Cells (TIMs)
Confers a Marked Survival Advantage in Nonmetastatic Clear-Cell Renal Clear-Cell Carcinoma. Ann Surg Oncol 2017;24:1435-42.
Table S1 Clinical characteristics of ccRCC patients according arm SCNAs level
Characteristics Patients Arm SCNAs level
n % Low High P value
All patients 524 100 241 283
Age, years 0.028*
<65 328 62.6 163 165
≥65 196 37.4 78 118
Gender 0.036*
Female 186 35.5 97 89
Male 338 64.5 144 194
TNM stage <0.001†
I 261 49.8 146 115
II 57 10.9 29 28
III 124 23.7 43 81
IV 82 15.6 23 59
Tumor nucleus grade <0.001†
I 14 2.7 13 1
II 225 43.6 126 99
III 202 39.1 82 120
IV 75 14.5 17 58
*, χ2 test; †, Cochran-Mantel-Haenszel χ2 test. ccRCC, clear cell renal cell carcinoma; SCNAs, somatic copy number alterations.
Figure S1 Prognostic value of 4p deletion in ccRCC patients with different stages. (A) Kaplan-Meier analysis of 4p deletion for OS in stage I & II patients; (B) Kaplan-Meier analysis of 4p deletion for RFS in stage I & II patients; (C) Kaplan-Meier analysis of 4p deletion for OS in stage III & IV patients; (D) Kaplan-Meier analysis of 4p deletion for RFS in stage III & IV patients.
Overall survival
1.0
0.8
0.6
0.4
0.2
0.0
Recurr
ence fr
ee survival
1.0
0.8
0.6
0.4
0.2
0.0 20 40 60 80
0 100 120 140
Time after surgery (months)
25 50 75
0 100 125
Time after surgery (months)
Stage I & II Stage I & II
P=0.016 no del (n=291) 4q del (n=27)
P=0.147 no del (n=253) 4q del (n=21)
A
B
Overall survival
1.0
0.8
0.6
0.4
0.2
0.0
Recurr
ence fr
ee survival
1.0
0.8
0.6
0.4
0.2
0.0 25 50 75
0 100 125
Time after surgery (months) 0 Time after surgery (months)25 50 75 100 125
Stage III & IV Stage III & IV
P=0.248 no del (n=162) 4q del (n=44)
P=0.044 no del (n=121) 4q del (n=31)