Volume 4, No. 11, Nov-Dec 2013
International Journal of Advanced Research in Computer Science
RESEARCH PAPER
Available Online at www.ijarcs.info
Detection of the Effect of Sharpening of a Color Image Sharpened by Frequency
Domain Filters and Identification of Roi using Morphological Mathematical Property
N. .Jayachandra#1,
Assistant Professor Department of Computer Science
Lady Doak College,Madurai [email protected]
Dr. A.R..Nadira Banu Kamal#2
Professor & Director, Department of MCA
T.B.A.K College for Women, Kilakarai. [email protected]
Abstract: This study applies sharpening method to satellite images to have better enhancement of image. Image sharpening plays a vital role in image enhancement. Image Enhancement techniques are instigated for making satellite imageries more informative and helping to achieve the goal of image interpretation. We proved that image sharpening for color images using Fast Fourier Transformation is better than by using filters in spatial domain processing. High pass filtering method sharpens the image by attenuating the low frequencies and leaving the high frequencies of the Fourier transform relatively unchanged. The result is obtained by comparing PSNR value of high pass filters with spatial filters .High pass filtering is produces good representative to sharpen the satellite images. The effect of sharpening is detected and the edges of sharpened image is detected to segment the ROI using mathematical morphological property and the performance of edge detectors are evaluated using PSNR value.
Keywords: Fourier Transformation, spatial domain processing, PSNR, Satellite images, mathematical morphology.
I. INTRODUCTION
Analysis of remotely sensed data is done using various image processing techniques and methods that includes Analog image processing and digital image processing. Digital Image Processing is a collection of techniques for the manipulation of digital images by computers[20]. The raw data received from the imaging sensors on the satellite platforms contains flaws and deficiencies. To overcome these flaws and deficiencies in order to get the originality of the data, it needs to undergo several steps of preprocessing. This will vary from image to image depending on the type of image format, initial condition of the image and the information of interest and the composition of the image scene. Digital Image Processing undergoes three general steps:
a. Pre-processing
b. Display and enhancement c. Information extraction
A high pass filter is the basis for most sharpening methods. An image is sharpened when contrast is enhanced between adjoining areas with little variation in brightness or darkness sharpening is a kind of frequency correction or so-called anti-filtering. Sharpening effect is achieved by amplification of high frequencies. This operation may be called high frequency correction. The term enhancement is used to mean the alteration of the appearance of an image in such a way that the information contained in that image is more readily interpreted visually in terms of a particular need. The image enhancement techniques are applied either to single-band images or separately to the individual bands of a multiband image set[21].
These techniques can be categorized into two: a. Spectral Enhancement Techniques b. Multi-Spectral Enhancement Techniques
A. Spectral Enhancement Techniques:
Density Slicing, Contrast Stretching, Linear Contrast Stretch, Histogram Equalization, Gaussian Stretch
B. Multi-Spectral Enhancement Technique:
Image Arithmetic Operations (Addition of images, Band Subtraction, Multiplication of Images Band Ratio or Division of images)[2] , Principal Component Analysis, Canonical Components, Hue, Saturation and Intensity (HIS) Transform and Fourier Transformation. In this paper we have used Fourier transform of Multi-Spectral Enhancement Techniques.
II. FOURIER TRANSFORM
The Fourier Transform operates on a single -band image. Its purpose is to break down the image into its scale components, which are defined to be sinusoidal waves with varying amplitudes, frequencies and directions. The coordinates of two-dimensional space are expressed in terms of frequency (cycles per basic interval). The function of Fourier Transform is to convert a single- and image from its spatial domain representation to the equivalent frequency-domain representation and vice-versa. The Fourier transform of an image, as expressed by the amplitude spectrum is a breakdown of the image into its frequency or scale components. Filtering of these components use frequency domain filters that operate on the amplitude spectrum of an image and remove, attenuate or amplify the amplitudes in specified wavebands. The frequency domain can be represented as a 2-dimensional scatter plot known as a Fourier spectrum, in which lower frequencies fall at the centre and progressively higher frequencies are plotted outward.
Filtering in the frequency domain consists of 3 steps: a. Fourier transform the original image and compute the
Fourier spectrum [22].
c. Perform an inverse Fourier transform to return to the spatial domain for display purposes.
This study investigates and evaluates different enhancement techniques for color image (spatial and frequency domain processing ) The comparative performance analysis is given by calculating PSNR value to show frequency domain processing is giving good result when compared with spatial domain processing. The contrast enhancement is clearly detected by morphological process. The Edges are detected with sobel filter and ROI is segmented using morphological process. The edge detection methods results are compared by calculating CCL and PSNR values with different detectors on satellite imagery as a representative for macroscopic images. The performance among all methods and the detection of multiple occurrences of region of interest is presented.
III. REVIEW OF LITERATURE
In this paper Image Processing In Frequency Domain Using Matlab®: A Study For Beginners filter is a device that discriminates according to one or more attributes at its input, what passes through it. One example is the color filter which absorbs light at certain wavelengths. Filters are designed that pass signals with frequency components in some bands, and attenuate signals with content in other frequency bands. FFT Filters provide precisely controlled low- and high-pass filtering (smoothing and sharpening, respectively) using a Butterworth characteristic. The image is converted into spatial frequencies using a Fast Fourier Transform, the appropriate filter is applied, and the image is converted back using an inverse FFT.[4].
In paper “Image Sharpening in the JPEG Domain” a new technique for sharpening compressed images in the discrete-cosine-transform domain is presented. For images compressed using the JPEG standard, image sharpening is achieved by suitably scaling each element of the encoding quantization table to enhance the high-frequency characteristics of the image. The modified version of the encoding table is then transmitted in lieu of the original.[10] Experimental results with scanned images show improved text and image quality with no additional computation cost and without affecting compressibility. There are many algorithms used for image segmentation, and some of them segmented an image based on the object while some can segment automatically[7] Nowadays, no one can point out which the optimal solution is due to different constraints. In
An Efficient Edge Detection Algorithm for segmenting ROI
Based on CCL For Satellite Images”, paper, the edges of
ROI is detected in a gray scale image using CCL and the best edge detector is selected based on the performance evaluated by counting the numbers CCL[20] .In this paper , a similarity close measure was used to classify the belonging of the pixels, and then used region growing to get the object. Unfortunately, it required a set of markers, and if there is an unknown image, it is hard to differentiate which part should be segmented [23]. Linking the area information and the color histogram were considered for building video databases based on objects [11]. However, the color information has to be given first, and it is not useful for the life application..
In Object localization and border detection criteria
design in edge-based image segmentation: automated
learning from examples”], a two-step approach to image
segmentation is reported. It was a fully automated model-based image segmentation, and improved active shape models, line-lanes and live-wires, intelligent scissors, core-atoms, active appearance models. However, there were still two problems left. It is strong dependency on a close-to-target initialization, and necessary for manual redesign of segmentation criteria whenever new segmentation problem is encountered[6]. The authors of “ Object localization and border detection criteria design in edge-based image
segmentation: automated learning from examples” proposed
a graph-based method, the cut ratio is defined the idea of NP-hard as the ratio of the corresponding sums of two different weights of edges along the cut boundary and models the mean affinity between the segments separated by the boundary per unit boundary length. It allows efficient iterated region-based segmentation as well as pixel-based segmentation [16]. Moreover, in order to understand an image and recognize the represented objects, it is necessary to locate in the image where the objects are. [15]. In “A Recursive Segmentation and Classification Scheme for Improving Segmentation Accuracy and Detection Rate in
Real-time Machine Vision”,, the minimizing function
including the approximation mean square error RMSE and the number of distinct region tried to achieve a good segmentation result[7].
The edge detection is a fundamental concept for segmentation because it is easy not only to understand its principle but also to implement. Comparing the basic edge detection method, which is get from Matlab command, with our algorithm, there are proposed algorithm extracts some undesired parts into the segmentation result, it represents almost the entire target image while the Matlab “edge” command seems to show the boundary of the target image only. It is because the proposed algorithm considers the color information at the same time in order to recover some disconnected parts while the Matlab “edge” command actually has problem identifying them as part of the target image[2].Color information of the target image and boundary extraction are obtained separately and simultaneously. The character of HIS approach is applied to acquire the information of the pixels of the target image. In the mean time, the Matlab “edge” and “imfill” command is used to extract the boundary and fill the image region whose boundaries make a closure. Afterwards, the two results are combined by getting the union of the two results. Finally, the image is enhanced by removing the noise[17].
be categorized into two groups, i.e. Gradient based and Laplacian based. Also stochastic gradient method was introduced which gives the better result in the presence of noise. The effectiveness of the stochastic process is demonstrated experimentally [18].
IV. METHODOLOGY
A. Image Enhancement:
The goal of image enhancement is to accentuate certain image features for subsequent analysis or for image display. There are so many techniques are available to enhance an image. Here we have used sharpen technique to enhance a color image. Sharpening an image results in the detection of fine details as well As enhancing blurred ones. The magnitude of the gradient is the most powerful technique that forms the basis for various approaches to sharpening. The gradient vectors points in the direction of maximum rate of change. [8]In this paper we have used frequency domain filters instead of gradient operators to sharpen the given color image[1].
a. Image Sharpening using Fourier Transform:
First High frequency matrix is created using Gaussian filter (high pass filter). Fast Fourier Transform of Red, green, blue components of given satellite image are calculated separated. Each transformed components is convolved with high frequency matrix. All three components are concatenated. The resulted image is cropped with the size of original image.
b. Spatial Domain Processing:
Mask is generated by using filters then the given color image is filtered with this mask the resulted image is obtained by subtracting the filtered image with the input one[8]. Then Point to signal Ratio is calculated for high pass filtered image and all spatial filtered images. Here color image is sharpened with all spatial filters ( laplacian, Gaussian, sobel, prewitt, log, average, unsharp, disk).[1]
B. Mathematical Morphology:
Morphology, or morphology for short, is a branch of image processing which is particularly useful for analyzing shapes in images. We shall develop basic morphological tools for investigation of binary images, and then show how to extend these tools to grayscale images. Matlab has many tools for binary morphology in the image processing toolbox; most of which can be used for grayscale morphology as well.
The theory of mathematical morphology can be developed in many different ways. We shall adopt one standard method which uses operations on sets of points. A very solid and detailed account can be found in Haralick and Shapiro[19].
The Mathematical Morphology was originally developed by Matheron and Serra at the Ecole des Mines in Paris. It is a set theoretic method of image analysis providing a quantitative description of geometrical structures. According to Soille (1999), it can be defined as theory for the analysis of spatial structures. It is called of morphology, because it consists analyses the shape and form of objects. It is mathematical because the analysis bases on set theory, integral geometry, and lattice algebra [2][23].
a. Structuring Element:
Facon (1996) defines the structuring element as a completely defined and known set (form and size). For the obtaining of good results through the use of morphologic tools is necessary to choose the structuring element appropriately. The choice of the element depends on the geometric form object to be extracted in the image. The size of the structuring element depends on the characteristics that you want to extract/eliminate in the image. Some examples of structuring elements cross, square, disk and line.
The Mathematical Morphology presents as principle two basic operations:
Erosion and Dilation, from which all other morphological operations are derived.
b. Dilation:
Dilation of the object A by the structuring element B is given by
} --- eqn.1
The result is a new set made up of all points generated by obtaining the reflection of B about its origin and then shifting this reflection by x.
c. Erosion:
Erosion of the object A by a structuring element B is given by
--- eqn.2
Two very important transformations are opening and closing. Now intuitively, dilation expands an image object and erosion shrinks it. Opening generally smoothens a contour in an image, breaking narrow extensions and eliminating thin protrusions. Closing tends to narrow smooth sections of contours, fusing narrow breaks and long thin gulfs, eliminating small holes, and filling gaps in contours.
d. Opening:
The opening of A by B, denoted by Ao B , is given by the erosion by B, followed by the dilation by B, that is
e. Closing:
Closing is the dual operation of opening and is denoted by AoB . It is produced by the dilation of A by B, followed by the erosion by B
A• B = (A⊕B)ΘB
Using this properties the resulted image is labeled with numbers to show the effect of image sharpening. Contrast enhancement is clearly marked with number. Edges are detected using these properties.
C. Edge Detection:
On the heart of segmentation is the selection of suitable edge detection method for particular application. Edges can be detected as rabid change in the gradient value within small area[22].
Algorithm in this area are based on either discontinuities or similarities. The former relies on portioning the image based on abrupt changes , and deals with detection of isolated points, lines, and edges in an image. While the later accounts for thresholding ,region growing , and region splitting and merging[2] (Gonzaalez and woods,1993).the zero crossing was first used by [8]Haralik(Haralik,1984).He used a threshold technique based on the image noise. Others suggest different approaches to thresholding [15](Voorhees and Poggio,1987).
In this paper it is clearly stated that the color image which is convolved with 3 x 3 mask and edges are detected a with the edge detectors (Robert, Prewitt, Sobel). Is giving the best value of CCL , PSNR and total elapsed time. Among these three edge detector the sobel detector resulted image is selected for further process by considering the minimum elapsed time and good PSNR value. Also , for the Canny operator the connected component is less because it
detects all surrounding of an image but it does not segment the region of interest. In this paper the sharpened image(using frequency domain filter) is convolved with 3 x 3 mask and the edges are detected with detectors Robert, Prewitt, Sobel and canny to smoothen the edges. After detecting the edges segment the area of ROI from the background using mathematical morphological properties[20].
V. PROPOSED METHODOLOGY
A. Image Sharpening Using Fourier Transform : a. First High frequency matrix is created using
Gaussian filter(high pass filter). Fast Fourier Transform of Red, green ,blue components of given satellite image are calculated separated.
b. Each transformed components is convolved with high frequency matrix.
c. All three components are concatenated.
d. The resulted image is cropped with the size of original image.
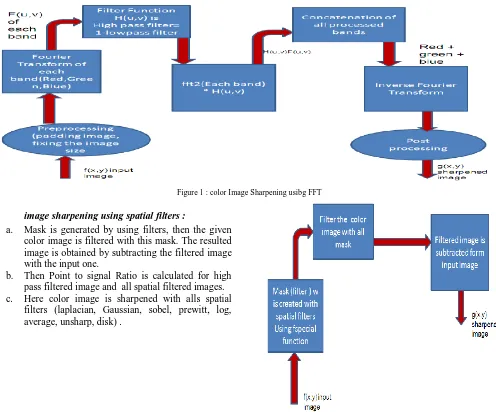
Figure 1 : color Image Sharpening usibg FFT
B. image sharpening using spatial filters :
a. Mask is generated by using filters, then the given color image is filtered with this mask. The resulted image is obtained by subtracting the filtered image with the input one.
b. Then Point to signal Ratio is calculated for high pass filtered image and all spatial filtered images. c. Here color image is sharpened with alls spatial
filters (laplacian, Gaussian, sobel, prewitt, log, average, unsharp, disk) .
Figure 2: Color Image Sharpening using Spatial Filters
VI. EXPERIMENTS
The image used in the experiments is a color image of size 100 x 100 x 3 pixels of Uint8 class. The Red , green, and blue components of given color image are separated as a individual matrix. Then each matrix is filtered with median filter to suppress the noise significantly. Gaussian High pass filter is created .Fast Fourier Transformation is applied to each and every band of given color image. All bands are concatenated.
Sharpen the color Image using spatial process by generate mask using filters, the filter the image with this mask. Then Point to signal Ratio is calculated for high pass filtered image and all spatial filtered images to view which
is giving the better enhancement in the given image. Then the contrast enhancement is pointed with numbers by labeling the connected components of image. Edges of each component matrix are detected using Roberts, Prewitt, Sobel, and Canny operators. The output matrix is smoothened by convolving the image with the following masks ( 3 x 3),
Figure 3 : 3 x 3 Mask
By the convolution of edges with this mask will smoothen the edges of the image. To segment the ROI from the background, the detected edges are dilated with the structured element ‘square’ followed by opening and closing mathematical morphology property. Here this property is used to reconstruct the ROI from the background of a color image and to label the connected components.
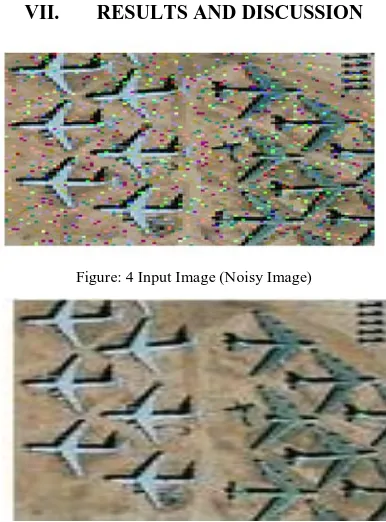
VII. RESULTS AND DISCUSSION
Figure: 4 Input Image (Noisy Image)
Figure: 5 Sharpened Image after FFT
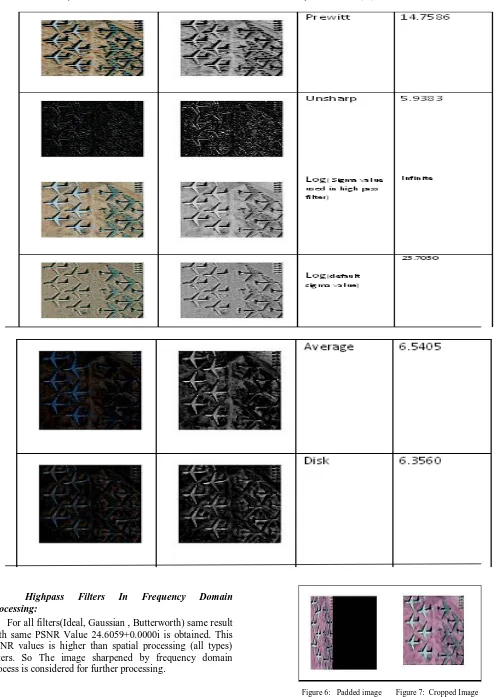
Table 1: spatial Domain Processing Results
0 1 0
1 -4 1
Volume 4, No. 11, Nov-Dec 2013
International Journal of Advanced Research in Computer Science
RESEARCH PAPER
A. Highpass Filters In Frequency Domain Processing:
For all filters(Ideal, Gaussian , Butterworth) same result with same PSNR Value 24.6059+0.0000i is obtained. This PSNR values is higher than spatial processing (all types) filters. So The image sharpened by frequency domain process is considered for further processing.
Figure 8: Input Image with Label(1) Figure 9: Sharpened Image with Label (1,2)
The input noisy image is given as an input to labeling the connected components . In the input image there are two areas. Left side is light area and the right side is dark area. This variation is not detected in the given image , as a whole in it is numbered with 1. But after image enhancement by FFT these variations are detected and those area are numbered with 1 and 2. That numbers are superimposed with green marker.
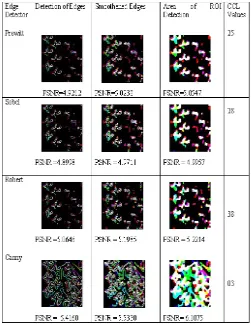
Table 2: Edge Detection Results Comparison List
In this table we have analyzed that canny operator is giving better calculation of PSNR and CCL values among all detectors. Here the CCL is very less because it detects all edges clearly that is why we are getting smallest CCL values and highest PSNR values. But for ROI segmentation the other detectors are giving better result. If we analyze based on CCL values Among Prewitt, Sobel and Robert, Prewitt is best than others. Based on PSNR values SOBEL and Prewitt detectors are providing the same result. There is a minimum variation in PSNR values Robert and (Sobel, Prewitt). But Robert detector`s CCL Value is higher than others.
VIII. CONCLUSION AND FUTURE WORK
In this paper, we have analyzed the behavior of frequency domain processing to sharpen the color image and detectors on the capability of edge detection for satellite imagery as representative for macroscopic images .We made use of mathematical property as a metrics to show the effect of image enhancement. The methods are applied to the whole image. Specific texture is identified. The objective is to investigate an efficient segmentation algorithm without using seed points to segment the occurrences of region of interest in a color image based on connected component labeling method. On Visual perception, it can be shown clearly that sobel and Prewitt detectors showed better edge detection when compared to other filters. Remote sensing imagery contains both fine and sharp edges which make the work in this environment more sensitive and complicated.
In future the image can be enhanced with Fuzzy sets and the number of objects can be calculated. Each one can be labeled with sequence numbers. This process can be trained with ANN to have a automatic detection of ROI. From the edges recovering the whole image can be reconstructed using mathematical property.
IX. REFERENCES
[1]. Ani K. Jain,”Fundamentals of Digital Image Processing”, Prentice Hall of India Pvt. Limited, New Delhi,2008.
[2]. Gonzalez, R. C., and Woods, R. E. “Digital Image Processing” (Reading, MA: Addison-Wesley, 1992).
[3]. Rudra Pratap, “Getting Started With MATLAB 7.” Oxford University Press, 2006.
[4]. Vinay Kumar and Manas Nanda Image Processing In Frequency Domain Using Matlab®: A Study For Beginners” – inria- 00321613,version 1 – 15 sep` 2008. Journals :
[5]. B. Bhanu, S. Lee, and J. Ming. “Adaptive image segmentation using a genetic algorithm,” IEEE Transactions on systems, man, and cybernetics, vol. 25, No. 12, Dec. 1995.
[6]. M. Brejl, and M. Sonka, “Object localization and border detection criteria design in edge-based image segmentation: automated learning from examples” IEEE Transactions on medical image, vol. 19, No. 10, Oct. 2000.
[7]. Y. Ding, G. J. Vachtsevanos, A. J. Y. Jr, Y. Zhang, and Y. Wardi, “A Recursive Segmentation and Classification Scheme for Improving Segmentation Accuracy and Detection Rate in Real-time Machine Vision”, IEEE DSP.
[8]. Haralick, R. M., and Shapiro, L. G. “Computer and Robot Vision”, vol.1 (Reading, MA: Addison-Wesley, 1992).Haralik. M.R. (1984). Dital step edges from Zero crossing of the second directionsal derevatives IEEE PAMI 6(1):58-68.
[10]. Konstantinos Konstantinides, Vasudev Bhaskaran, and Giordano Beretta “Image Sharpening in the JPEG Domain”, IEEE Transactions On Image Processing, Vol. 8, No. 6, June 1999.
[11]. M. Naemura, A. Fukuda, Y. Mizutani, Y. Izumi, Y. Tanaka, and K. Enami, “Morphological Segmentation of Sport Scenes using Color Information,” IEEE Transactions on broadcasting, vol. 46, no. 3, Sep. 2000.
[12]. Selvarajan,S. and al,W.C.(2001). “Extraction of man-made features from remote sensing imageries by data fusion techniques”, 22nd Asian Conference on Remote Sensing , 5-9 , Nov,2001, Singapore.
[13]. M. Tabb and N. Ahuja, “Multiscale Image Segmentation by Integrated Edge and Region Detection,” IEEE Transactions on image processing, vol. 6, no. 5, May. 1997.
[14]. W. Vanzella and V. Torre, “A Versatile Segmentation Procedure”, IEEE Trans on systems, man and cybernetics, vol. 36, no. 2, pp. 366-378, Apr. 2006.
[15]. Vooorhees, H. and Poggio, T. (1987). “Detecting textons and Tecture boundries in natural images”. ICCV 87:250-258.
[16]. S. Wang, and J. M. Siskind, “Image segmentation with ratio cut,” IEEE Transaction on pattern analysis and machine intelligence, vol. 25, No. 6, Jun. 2003. Thesis :
[17]. Chin-Ya Huang, Mon-JuWu “Image Segmentation “ECE 533 Final Project, Fall 2006, University of Wisconsin- Madison.
[18]. Kartik Sau [1] Milan Pal [2] , Pabitra Karmaka[3] “Unique Techniques for edge detection methods In digital Image Processing” [1]Department of Computer Science & Engineering, Institute of Engineering & Management, Salt Lake, Kolkata - 91WBUT. [2,3]. M.Tech 2nd year student, Department of Computer science & Engineering. Institute of engineering.
[19]. G. Louverdis, M.I. Vardavoulia, I. Andreadis∗, Ph. Tsalides, A new approach to morphological color image processing Laboratory of Electronics, Section of Electronics and Information Systems Technology, Department of Electrical & Computer Engineering, Democritus University of Thrace, GR-67100 Xanthi,
Greece Received 10 December 2000; received in revised form 1 June 2001; accepted 5 July 2001. Proceedings :
[20]. Jayachandra.N.,Nadhirabanu kamal, “An Efficient Edge Detection Algorithm for segmenting ROI Based on CCL For Satellite Images”, Proceedings of ICICT 2010,pp 25-29, December ,2010.
[21]. Jayachandra. N.,Nadhirabanu kamal, Efficient Color image sharpening algorithm of satellite images using Filters in frequency domain processing, “ Proceedings of, UGC Sponsored National Conference On Emerging Computing Paradigms, NCECP2011 , Vol 2, pp358-363.
[22]. Marr, D., and Hildreth, E. "Theory of Edge Detection," Proceedings of the Royal Society London 207 (1980) 187-217. 23. [8] F. Meyer, “Color image segmentation,” in Proc. Int. Conf. Image Processing, Maastricht, The Netherlands, 1992.
[23]. Muthu Lakshmi , N.Jayachandra, “Salt and Pepper Noise Removal in Images using Mathematical Morphology”, UGC Sponsored National Conference On Emerging Computing Paradigms, Department Of Computer Science, M.V.M Govt. Arts College (W),Dindigul pp.340-342.
Short Bio Data for the Authors
I am an Assistant professor in the department of computer science, Lady Daok College,Madurai.I did my graduation in TBAK college for women, Kilakarai and my post graduation at Allagappa university. I have five years of research experience in sattilite image processing since my M.Phil .Currently I am pursuing my P.HD in Mother Teresa Women`s University, Kodaikonnal.