Research Article
A population-based study on correlates of abortion in India (1990-2006)
Jeetender Yadav
1*, Ashish Kumar Yadav
2, Garima Sharma
3, Jiten Kumar Singh
4INTRODUCTION
Abortion is the termination of pregnancy before its full term. Under the 1971 medical termination of pregnancy act, a woman in India can legally obtain an induced abortion if her pregnancy carries the risk of grave physical injury, endangers her mental health, is the result of contraceptive failure (in case of a married woman) or rape, or is likely to produce a child with physical or
mental abnormalities.1 Sources of data on induced
abortion in India somehow fail to provide consistent estimates of induced abortions in India, but most researchers using direct and indirect methods of estimation seem to agree that there are between five and seven million induced abortions per year.2-10 Several previous studies documented that son preference is an important factor influencing the practice of abortion and that son preferring women who do not want daughter tend to terminate their pregnancies through induced abortion.11-13 In a strong son preferring society, if a
ABSTRACT
Background: Every two hours in India, a woman dies from an unsafe abortion. Each year, 19 million to 20 million women risk their lives to undergo unsafe abortions, conducted in unsanitary conditions by unqualified practitioners or practitioners who resort to traditional but rudimentary means. This study depicts the scenario, traces the changes in abortion and determines the factors associated with abortion in India, during last one and half decade (1990-2006).
Methods: Data from three rounds of the National Family Health Survey (1992–93 NFHS-1, 1998–99 NFHS-2, 2005– 06 NFHS-3) India were analyzed. To identify the scenario, traces the changes and determine the factors associated with abortion, bivaraite and multivariate (both separate and pooled) analyses were performed.
Results: Findings from this study highlighted that the women current age, women age at marriage, sex composition of living children, educational status, mass media exposure and place of residence emerged as significant factors affecting the abortion. Controlling for a set of socioeconomic and demographic factors, experience abortion by women was more (Crude OR=2.11 95% CI=2.04-2.19), (AOR=1.06 95% CI=1.01-1.10) during 1996-99 and (Crude OR=1.07 95% CI=1.03-1.12), (AOR=1.20 95% CI=1.15-1.26) during 2003-06, respectively as compared to period 1992-1993.
Conclusions: There is a need for more in-depth qualitative studies at the regional level to better understand the determinants and consequences of this complex and sensitive issue in India. Programs should focus more on the availability and accessibility of contraceptives among women to elude the reproductive health consequences of induced abortion.
Keywords: Abortion, Maternal care, NFHS 1
Technical Assistant (Research), 4Scientist ―C‖, National Institute of Medical Statistics, Indian Council of Medical Research, New Delhi, India
2Assistant Professor, Department of Community Medicine, ESI-Post Graduate Institute of Medical Sciences and
Research, Kolkata-700 104, India
3
Biostatistician, Indian Council of Medical Research, New Delhi, India
Received: 17 March 2016
Revised: 01 April 2016
Accepted: 07 May 2016
*Correspondence:
Dr. Jeetender Yadav,
E-mail: [email protected]
Copyright: © the author(s), publisher and licensee Medip Academy. This is an open-access article distributed under the terms of the Creative Commons Attribution Non-Commercial License, which permits unrestricted non-commercial use, distribution, and reproduction in any medium, provided the original work is properly cited.
woman of reproductive age has a strong son preference, she may seek to become pregnant until she achieves her desired number of sons and when she has enough sons, she may use induced abortion to stop having more children.11,13-15 In recent decades contraception and induced abortion have been widely used as a means for women to achieve their desired number of children and for birth timing.16 Hence, there is a need to identify the important factors responsible for abortion in India.
A limited attempts have been made to understand scenario, traces the changes in abortion and factors associated with abortion in India during last one and half decade, (1990-2006). Thus, the present study is a modest approach in this direction.
METHODS
This study is based on three rounds of the National Family Health Survey (NFHS) data, the Indian version of the Demographic and Health Survey (DHS) which were canvassed during 1992–93 1), 1998–99 (NFHS-2), and 2005–06 (NFHS-3) in India.17-19 All the three rounds of the survey are nationally representative and have covered more than 99% of India’s population. The survey provides state and national level estimates of demographic and health parameters as well as data on various socioeconomic and policy measurements. The details of the sampling weights as well as extensive information on survey design, data collection, and management procedures are described in the NFHS reports of the respective rounds.17-19
To examine the correlates of abortion, in India during last one and half decade, 1990-2006, socioeconomic and demographic predictors were included in the analysis, based on the literature review and availability of information in all three rounds of NFHS survey for better
comparability. Socioeconomic and demographic
predictors such as current age of mother, age at marriage, mother’s age at the time of first child birth, women’s education, husband’s education, women’s occupation, husband’s occupation, religion, social group, mass media exposure, wealth quintile, place of residence, city wise residence and region of residence were included as predictor variables in the study.
Analytical approach
To identify the trends and factor associated with abortion in India during last one and half decade, 1990-2006, bivaraite and multivariate (both separate and pooled) analysis were performed. Bivariate analysis has been used to show the abortion scenario and the possible linkages with selected characteristics of women with the abortion. Multivariate regression analysis further explores the direction and intensity of association to examine the nature of association between abortion and selected socioeconomic background characteristics. The whole analysis was performed using SPSS version 20.0 and
STATA version 13.0. To take into account the survey design (i.e. sampling weights with clustering and strata) while estimating bivariate and multivariate statistics, the
SVY command in STATA was used.20,21
Ethical consideration
The study is based on data available in public domain, therefore no ethical issue is involved.
RESULTS during 1990-93, 1996-99 and 2003-2006. More than one third women had given first child during age 15-24 years irrespective the survey time period. As regards to sibling composition, all most two third women had three and more living children with at-lest two sons during 1990-93 and during 1996-99, however during 2003-06, only one forth women had three and more living children with at-least two sons. This shows the low fertility and small family due to time gap from 1996-99 to 2003-06. Majority of the respondent almost 80 percent belonged to the Hindu religion irrespective of time period (1990-93, 1996-99 and 2003-2006) and more than two third of women were from other than SC/ST social group.
Differentials in abortion
Table 1 shows the weighted percentage of women who had undergone of abortion either induced or spontaneous
by socioeconomic and demographic background
characteristics in India. Experience of abortion
similar pattern was found during 1996-98 and 2003-06 with the same regions falling in the high and low categories of experiencing abortion among women.
Northeast region shows highest abortion (30.6%) and (17.6%) during 1996-99 and 2003-06 respectively.
Table 1: Percentage of women who undergo ever abortion in their reproductive age (15-49) by selected individual, household and community characteristics, in India, 1990-2006.
Background characteristics
Ever had abortion
NFHS-1 (1990–93) NFHS-2 (1996–99) NFHS-3 (2003–06) Relative Change (%)
% 95% CI % 95% CI % 95% CI a b c
Individual characteristics
Mother’s age at the time of marriage χ2=88.610*** χ2=682.520*** χ2=10.171**
<18 years 12.9 [12.5,13.2] 22.3 [21.8,22.8] 17.7 [17.1,18.3] 72.9 -20.6 37.2
18-21 years 14.3 [13.7,14.9] 27.9 [27.3,28.6] 18.1 [17.4,18.8] 95.1 -35.1 26.6
22 years and above 16.7 [15.6,17.8] 34.4 [33.1,35.7] 19.0 [18.0,20.1] 106.0 -44.8 13.8
Mother’s age at first birth χ2=168.073*** χ2=256.143*** χ2=186.908***
<18 years 12.9 [12.4,13.4] 13.7 [13.1,14.3] 16.3 [15.6,17.1] 6.2 19.0 26.4
18-21 years 14.4 [13.9,14.9] 15.7 [15.1,16.3] 18.9 [18.2,19.6] 9.0 20.4 31.3
22 years and above 17.5 [16.8,18.3] 19.5 [18.7,20.3] 21.3 [20.5,22.2] 11.4 9.2 21.7
Sex composition of living childrenχ2=544.550*** χ2=2691.752*** χ2=4189.777***
1 child—1 son (ref) 11.3 [10.4,12.2] 12.6 [11.8,13.5] 17.9 [16.8,19.0] 11.5 42.1 58.4
1 child—no son 11.1 [10.2,12.1] 12.9 [12.0,13.9] 17.7 [16.5,18.9] 16.2 37.2 59.5
2 children—2 son 13.8 [12.7,14.9] 14.8 [13.8,15.8] 17.4 [16.3,18.6] 7.2 17.6 26.1
2 children—1 son 15.0 [14.1,16.0] 17.4 [16.4,18.4] 18.8 [17.9,19.8] 16.0 8.0 25.3
2 children—no son 14.8 [13.5,16.2] 17.1 [15.7,18.6] 21.0 [19.4,22.6] 15.5 22.8 41.9
3+ children—2+ son 14.9 [14.4,15.4] 15.5 [14.9,16.1] 18.0 [17.2,18.8] 4.0 16.1 20.8
3+ children—1 son 16.3 [15.4,17.1] 17.1 [16.2,18.0] 19.8 [18.8,20.9] 4.9 15.8 21.5
3+ children—no son 17.5 [15.7,19.4] 18.9 [17.0,21.1] 21.0 [18.9,23.3] 8.0 11.1 20.0
No living child 8.1 [7.6,8.7] 9.3 [91.7,92.9] 4.4 [4.1,4.7] 14.8 -52.7 -45.7
Women’s education χ2=314.443*** χ2=295.160*** χ2=212.916***
Illiterate 12.0 [11.6,12.4] 21.5 [21.0,22.1] 15.9 [15.3,16.6] 79.2 -26.0 32.5
Literate but below primary 15.6 [14.8,16.5] 24.7 [23.7,25.7] 16.3 [15.3,17.3] 58.3 -34.0 4.5
Primary but below middle 14.4 [12.9,16.1] 26.4 [25.1,27.8] 15.3 [14.3,16.4] 83.3 -42.0 6.3
Middle but below high school 16.0 [15.2,16.8] 29.7 [28.7,30.7] 12.5 [12.1,13.0] 85.6 -57.9 -21.9
High school and above 18.8 [17.2,20.5] 31.5 [30.6,32.5] 12.3 [11.6,13.0] 67.6 -61.0 -34.6
Husband’s education χ2=183.736*** χ2=157.159*** χ2=212.916***
Illiterate 11.5 [11.0,12.0] 21.0 [20.4,21.7] 15.6 [14.9,16.4] 82.6 -25.7 35.7
Literate but below primary 13.6 [12.8,14.5] 22.4 [21.4,23.4] 17.5 [16.4,18.7] 64.7 -21.9 28.7
Primary but below middle 14.4 [13.7,15.2] 23.9 [23.1,24.8] 18.1 [17.2,19.0] 66.0 -24.3 25.7
Middle but below high school 14.6 [13.8,15.5] 27.7 [26.8,28.7] 18.8 [17.9,19.7] 89.7 -32.1 28.8
High school and above 15.1 [14.5,15.8] 28.7 [28.0,29.4] 19.6 [18.8,20.3] 90.1 -31.7 29.8
Women’s occupation χ2=99.380*** χ2=37.443*** χ2=212.916***
Not working 13.6 [13.2,14.0] 26.1 [25.5,26.6] 14.5 [14.1,15.0] 91.9 -44.4 6.6
Agricultural work 12.1 [11.4,12.8] 21.6 [21.0,22.3] 13.6 [12.9,14.3] 78.5 -37.0 12.4
Skilled/Unskilled work 14.1 [13.0,15.2] 26.8 [25.2,28.5] 14.2 [13.3,15.1] 90.1 -47.0 0.7
Professional work 17.8 [16.4,19.3] 28.0 [26.3,29.7] 16.0 [15.0,17.0] 57.3 -42.9 -10.1
Husband’s occupation χ2=299.403*** χ2=289.522*** χ2=212.916***
Not working 10.2 [8.8,11.8] 29.8 [28.1,31.7] 14.7 [12.7,16.8] 192.2 -50.7 44.1
Agricultural work 11.6 [11.2,12.1] 21.6 [21.1,22.2] 15.1 [14.4,15.9] 86.2 -30.1 30.2
Skilled/Unskilled work 14.1 [13.6,14.7] 26.2 [25.6,26.8] 18.6 [17.9,19.3] 85.8 -29.0 31.9
Professional work 16.2 [15.6,16.8] 27.6 [26.9,28.3] 20.3 [19.6,21.1] 70.4 -26.4 25.3
Mass media exposure χ2=291.865*** χ2=6.081 χ2=212.916***
No exposure 11.5 [11.2,11.9] 21.7 [21.1,22.3] 14.8 [14.0,15.6] 88.7 -31.8 28.7
Any exposure 15.4 [15.0,15.9] 27.1 [26.6,27.6] 14.2 [13.8,14.6] 76.0 -47.6 -7.8
Household characteristics
Hindu 13.5 [13.2,13.9] 24.9 [24.4,25.3] 14.3 [13.9,14.8] 84.4 -42.6 5.9
Muslim 14.0 [13.1,14.9] 24.4 [23.4,25.5] 15.6 [14.6,16.6] 74.3 -36.1 11.4
Others 12.4 [11.3,13.5] 25.6 [24.2,27.0] 11.7 [10.7,12.7] 106.5 -54.3 -5.6
Social group χ2=209.788*** χ2=28.236*** χ2=148.304***
Others than SC/ST 14.2 [13.8,14.6] 25.3 [24.8,25.8] 14.9 [14.4,15.3] 78.2 -41.1 4.9
Scheduled caste (SCs) 13.3 [12.6,14.0] 23.9 [23.0,24.8] 14.2 [13.5,14.9] 79.7 -40.6 6.8
Scheduled tribe (STs) 8.3 [7.5,9.2] 23.0 [21.9,24.2] 10.3 [9.4,11.3] 177.1 -55.2 24.1
Wealth quintile χ2=376.538*** χ2=290.211*** χ2=12.681
Poorest 11.4 [10.8,12.1] 22.2 [21.5,23.0] 14.1 [13.2,14.9] 94.7 -36.5 23.7
Poorer 12.0 [11.4,12.6] 23.6 [22.9,24.4] 14.7 [13.9,15.4] 96.7 -37.7 22.5
Middle 13.2 [12.6,13.8] 24.3 [23.6,25.1] 13.8 [13.2,14.5] 84.1 -43.2 4.5
Richer 15.1 [14.4,15.8] 25.8 [25.0,26.6] 14.5 [13.9,15.2] 70.9 -43.8 -4.0
Richest 17.8 [17.0,18.7] 29.8 [28.8,30.9] 14.7 [14.1,15.4] 67.4 -50.7 -17.4
Community characteristics
Type of residence χ2=330.599*** χ2=183.558*** χ2=9.367***
Urban 17.0 [16.3,17.7] 28.2 [27.4,28.9] 14.8 [14.2,15.5] 65.9 -47.52 -12.94
Rural 12.3 [11.9,12.7] 23.7 [23.2,24.2] 14.2 [13.7,14.7] 92.7 -40.08 15.45
Region χ2=212.916*** χ2=98.644*** χ2=728.534***
North 13.9 [13.2,14.5] 25.1 [24.3,26.0] 12.1 [11.3,13.0] 80.6 -51.79 -12.95
Central 13.0 [12.3,13.9] 25.8 [25.0,26.7] 17.0 [16.2,17.9] 98.5 -34.11 30.77
East 11.5 [11.0,12.1] 23.2 [22.4,24.0] 17.0 [16.1,17.9] 101.7 -26.72 47.83
Northeast 16.8 [15.3,18.5] 30.6 [29.0,32.3] 17.8 [16.6,19.1] 82.1 -41.83 5.95
West 12.5 [11.6,13.4] 24.1 [22.9,25.4] 11.6 [10.7,12.5] 92.8 -51.87 -7.20
South 15.9 [15.1,16.6] 24.9 [24.1,25.8] 11.5 [10.8,12.2] 56.6 -53.82 -27.67
Total 13.5 [13.2,13.9] 24.9 [24.4,25.3] 14.4 [14.0,14.8] 84.4 -42.17 6.67
a: Calculated as relative change = [( period 2 %-period 1%)/period 1%*100]; b: Calculated as relative change = [( period 3 %-period 2%)/period 2%*100]; c: Calculated as relative change = [( period 3 %-period 1%)/period 1%*100].
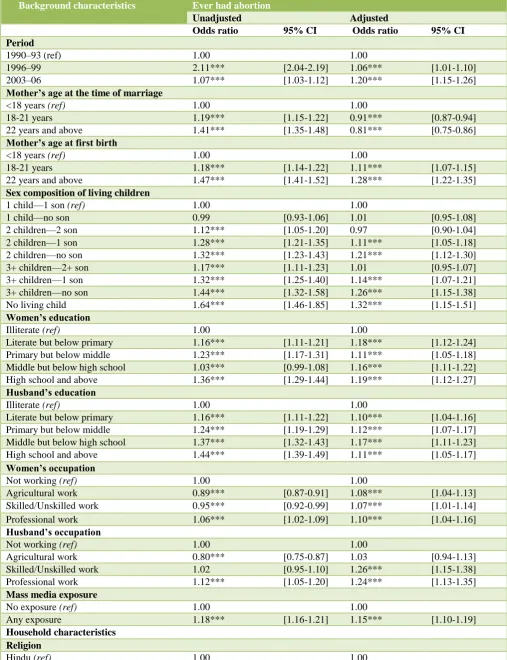
Determinants of abortion (pooled data)
Along with the adjusted odds ratios, the table provides observed (or unadjusted) odds ratios for each correlate, which permit direct comparison of observed and adjusted effects. The study estimated the baseline effect of each variable on experiencing abortion by women in the unadjusted model, and then controlled for other variables in the adjusted one (Table 2).
The result from the both model unadjusted and adjusted shows that the women age, age at marriage, sex composition of living children, women’s education, husband’s education, mass media exposure, place of residence and region of residence are emerged as significant factors affecting the abortion. Controlling for a set of socioeconomic and regional factors, experience abortion by women was more (Crude OR=2.11 95% CI=2.04-2.19), (AOR=1.06 95% CI=1.01-1.10) during 1996-99 and (Crude OR=1.07 95% CI=1.03-1.12),
(AOR=1.20 95% CI=1.15-1.26) during 2003-06,
respectively as compared to period 1992-1993. The overall occurrence of abortion by women was higher (Crude OR=1.33 95% CI=1.26-1.41), (AOR=1.71 95% CI=1.62-1.80) among mothers aged 35 years and above as compared with mother’s age 15-24 years. Similarly, women who got marriage latter (22 years and above)
have higher chances to have abortion as compared to women married before 18 years.
Women who have three and more living children with no sons have experience of abortion was higher (Crude OR=1.44 95% CI=1.32-1.58), (AOR=1.26 95% CI=1.15-1.38) than among women who have one living children with one son. Experience of abortion was higher among women who have three and more living children with either one sons or two sons than women who have one living children with one son. This illustrates the significance of sex composition of living children and it may be sex selection abortion among women. This shows the more educated mothers have more chance to have abortion as compared to illiterate mothers.
Table 2: Socioeconomic and demographic determinants of abortion in India, 1990–2006 (pooled data).
Background characteristics Ever had abortion
Unadjusted Adjusted
Odds ratio 95% CI Odds ratio 95% CI
Period
1990–93 (ref) 1.00 1.00
1996–99 2.11*** [2.04-2.19] 1.06*** [1.01-1.10]
2003–06 1.07*** [1.03-1.12] 1.20*** [1.15-1.26]
Mother’s age at the time of marriage
<18 years (ref) 1.00 1.00
18-21 years 1.19*** [1.15-1.22] 0.91*** [0.87-0.94]
22 years and above 1.41*** [1.35-1.48] 0.81*** [0.75-0.86]
Mother’s age at first birth
<18 years (ref) 1.00 1.00
18-21 years 1.18*** [1.14-1.22] 1.11*** [1.07-1.15]
22 years and above 1.47*** [1.41-1.52] 1.28*** [1.22-1.35]
Sex composition of living children
1 child—1 son (ref) 1.00 1.00
1 child—no son 0.99 [0.93-1.06] 1.01 [0.95-1.08]
2 children—2 son 1.12*** [1.05-1.20] 0.97 [0.90-1.04]
2 children—1 son 1.28*** [1.21-1.35] 1.11*** [1.05-1.18]
2 children—no son 1.32*** [1.23-1.43] 1.21*** [1.12-1.30]
3+ children—2+ son 1.17*** [1.11-1.23] 1.01 [0.95-1.07]
3+ children—1 son 1.32*** [1.25-1.40] 1.14*** [1.07-1.21]
3+ children—no son 1.44*** [1.32-1.58] 1.26*** [1.15-1.38]
No living child 1.64*** [1.46-1.85] 1.32*** [1.15-1.51]
Women’s education
Illiterate (ref) 1.00 1.00
Literate but below primary 1.16*** [1.11-1.21] 1.18*** [1.12-1.24]
Primary but below middle 1.23*** [1.17-1.31] 1.11*** [1.05-1.18]
Middle but below high school 1.03*** [0.99-1.08] 1.16*** [1.11-1.22]
High school and above 1.36*** [1.29-1.44] 1.19*** [1.12-1.27]
Husband’s education
Illiterate (ref) 1.00 1.00
Literate but below primary 1.16*** [1.11-1.22] 1.10*** [1.04-1.16]
Primary but below middle 1.24*** [1.19-1.29] 1.12*** [1.07-1.17]
Middle but below high school 1.37*** [1.32-1.43] 1.17*** [1.11-1.23]
High school and above 1.44*** [1.39-1.49] 1.11*** [1.05-1.17]
Women’s occupation
Not working (ref) 1.00 1.00
Agricultural work 0.89*** [0.87-0.91] 1.08*** [1.04-1.13]
Skilled/Unskilled work 0.95*** [0.92-0.99] 1.07*** [1.01-1.14]
Professional work 1.06*** [1.02-1.09] 1.10*** [1.04-1.16]
Husband’s occupation
Not working (ref) 1.00 1.00
Agricultural work 0.80*** [0.75-0.87] 1.03 [0.94-1.13]
Skilled/Unskilled work 1.02 [0.95-1.10] 1.26*** [1.15-1.38]
Professional work 1.12*** [1.05-1.20] 1.24*** [1.13-1.35]
Mass media exposure
No exposure (ref) 1.00 1.00
Any exposure 1.18*** [1.16-1.21] 1.15*** [1.10-1.19]
Household characteristics Religion
Muslim 0.99 [0.97-1.02] 1.07*** [1.01-1.13]
Others 0.78*** [0.76-0.81] 0.89*** [0.83-0.95]
Social group
Others than SC/ST (ref) 1.00 1.00
Scheduled caste (SC’s) 0.94*** [0.92-0.97] 1.00 [0.96-1.04]
Scheduled tribe (ST’s) 0.66*** [0.63-0.68] 0.72*** [0.68-0.77]
Wealth quintile
Poorest (ref) 1.00 1.00
Poorer 1.06*** [1.03-1.10] 1.01 [0.96-1.06]
Middle 1.06*** [1.03-1.10] 1.01 [0.95-1.07]
Richer 1.13*** [1.10-1.17] 1.01 [0.95-1.08]
Richest 1.26*** [1.23-1.30] 1.08** [1.00-1.16]
Community characteristics Type of residence
Urban (ref) 1.00 1.00
Rural 0.85*** [0.84-0.87] 0.91*** [0.87-0.95]
Region
North (ref) 1.00 1.00
Central 1.04*** [1.01-1.07] 1.24*** [1.17-1.32]
East 0.98 [0.95-1.02] 1.11*** [1.04-1.19]
Northeast 0.97 [0.94-1.01] 1.66*** [1.54-1.80]
West 0.93*** [0.90-0.96] 0.86*** [0.80-0.92]
South 0.95*** [0.92-0.98] 0.94*** [0.89-0.99]
Levels of significance: *p<0.10; **p<0.05; ***p<0.01; City wise residence was excluded from the multivariate analysis after examining high collinearity between type of residence and city wise residence.
DISCUSSION
Findings from this study highlighted that the women current age, age at marriage, sex composition of living children, women’s education, husband’s education, mass media exposure, place of residence and region of residence are significant factors affecting the abortion. Results of this study indicated that the experience of abortion is higher among older women as compared to youth women similar documentation can be found in other studies also.22 This study shows that women who have three and more living children with one sons or two sons were more likely to have experienced induced abortion which is in similarities with other studies.23,24 Finding from this study shows that women’s education and husband’s education are positively associated with abortion, which is also indicated in many earlier studies.22,25,26 Several studies found that educated mothers were taking advantage of the MTP facility.27-30 This study found that the abortion among other religion women to be considerably lower than among Hindu women, and it is lower still among scheduled tribe women than other caste women which pointed out that induced abortion is practiced across communities, class, and even different cultural and religious backgrounds.31 Several earlier studies documented that women who do not belong to scheduled caste or tribe have higher probability to get abortions.28,32,33
Previous studies documented that lack of abortion services in rural India but also a lower demand for abortion as a result of limited exposure to the media.34 This study also reconfirm that women who lived in rural areas were less likely than their urban counterparts to have abortion. Many others studies found that desired family size is lower in urban areas than in rural areas because of better media access and greater exposure to diverse social groups.33,35 Both bivariate and multivariate analysis shows that the Northeast region has shown a higher prevalence of abortion compared to rest.
CONCLUSION
community level to better understand the determinants
2. Ganatra, BR. Abortion research in India—What we
know, what we need to know. In S. Jejeebhoy and R. Ramasubban (eds.), Women’s reproductive health in India. New Delhi:Rawat Publications. 2000.
3. Khan ME, Barge S, Kumar N, Almroth S. 1998.
Abortion in India: Current situation and future challenges. In S. Pachauri (ed.). Implementing a Reproductive Health Agenda in India: The Beginning. New Delhi: Population Council.1998: 507-29.
studies and their implications for abortion services. Journal of the American Medical Women’s Association. 2000;55(Supplement 3):191-4.
7. Faundes A, Hardy E. Illegal abortion: Consequences
for women’s health and the health care system. International Journal of Gynaecology and Obstetrics 1997;58:77-83.
8. Indian Council of Medical Research. 1989. Illegal
abortion in rural areas: A task force study. New Delhi: Indian Council of Medical Research.
9. Jejeebhoy S. Reproductive health information in
India. What are the gaps? Economic and Political Weekly. 1999;34:3075-80.
10. Saha KB, Chatterjee U. Reproductive rights in
contraceptive practices. Health for the Millions. 1998;24:31-2.
11. Park CB. & Cho NH. Consequences of Son
Preference in a Low Fertility Society: Imbalance of the Sex-Ratio at Birth in Korea. Population and Development Review. 1995;21(1):59-84.
12. Miller BD. Female Selective Abortion in Asia:
Patterns, Policies and Debates. American
Biometrika. 2001;73:13-22.
13. Van Balen, F, Inhorn MC. Son preference, sex
selection and the ―New‖ new reproductive technologies. International journal of Health Services. 2003;33(2):235-52.
14. Arnold F, Choe MK, Roy TK. Son preference, the
family-building process and child mortality in India. Population Studies. 1998;52(3):301-15. review. International Family Planning Perspectives. 1999;25(2):68-77.
17. International Institute for Population Sciences
(1995) National Family Health Survey India, 1992– 93 NFHS-1. Mumbai: IIPS.
18. International Institute for Population Sciences, ORC
Macro (2000) National Family Health Survey India, 1998–99 NFHS-2. Mumbai: IIPS.
19. International Institute for Population Sciences, ORC
Macro (2007) National Family Health Survey India, 2005–06 NFHS-3. Mumbai: IIPS.
20. Korn EL, Graubard BI. Simultaneous testing of
regression coefficients with complex survey data :
Use of Bonferronit statistics. American
Statistician.1990;44:270-6.
21. Statacorp. Stata statistical software: Release 10.
College Station: Statacorp LP. 2007
22. Visaria L, Ramachandran V, Ganatra B, Kalyanwala
S. Abortion in India: emerging issues from qualitative studies. Economic and Political Weekly. 2004;39(46-47):5044-52.
23. MacQuarrie K, Edmeades J, MacAulay C, Nyblade
L, Malhotra A. 2007. Women, husbands, and in-laws: Abortion decision-making in Madhya Pradesh, India. Abortion II Panel, Population Association of America Annual Meeting. 2007.
24. Gentleman A. India’s lost daughters: Abortion toll in millions. International Herald Tribune: Asia-Pacific, Tuesday, January 10. 2006.
25. Ganatra B, Hirve S. Induced abortions among
adolescent women in rural Maharashtra, India. Reproductive Health Matters. 2002;10(19):76-85.
26. Ravindran TKS, Balasubramanian P. 2004. Yes to
abortion but no to sexual rights: The paradoxical reality of married women in rural Tamil Nadu,
India. Reproductive Health Matters.
2004;12(23):88-99.
27. Jamshedji A, Kokate N. 1990. Medical termination
of pregnancy and concurrent contraceptive
acceptance. Journal of Family Welfare.
1990;36(3):39-53.
28. Khan ME, Patel BC, Chandrasekhar R. 1990. A
study of MTP acceptors and their subsequent contraceptive behaviour. Journal of Family Welfare. 1990;36(3):70-85.
29. Rao NB, Kanbargi R. 1980. Medical termination of
pregnancy: An analysis of trends and differentials in legal abortions in Karnataka. Bombay: Himalaya Publishing House. 1980.
30. Rao VN, Panse GA. Analysis of acceptors of
31. Chhabra R, Nuna SC. Abortion in India—An overview. Delhi: Ford Foundation. 1994.
32. Agrawal S, Unisa S. Discrimination from
Conception to Childhood: A Study of Girl
33. Child in Rural Haryana, India. In C.Z. Guilmoto and
I. Attane (eds.), Watering the neighbours garden. Paris: Committee for International Cooperation in National Research in Demography. 2007
34. Babu NP, Nidhi D, Verma RK. Abortion in India:
What does the National Family Health Survey tell us? Journal of Family Welfare. 1998;44:45-54.
35. Pallikadavath S, Stones RW. Maternal and social
factors associated with abortion in India: A
population-based study. International Family
Planning Perspectives. 2006;32(3):120- 5.
36. Dreze J, Murthi M. 2001. Fertility, education and development: Evidence from India. Population and Development Review. 2001;27:33-63.
Cite this article as: Yadav J, Yadav AK, Sharma G,
Singh JK.A population-based study on correlates of