2638
Data Aggregation in WSN Using Robust Mean
M.Lakshmi1 P.Velmani
, PhD
2 P.Arockiya Jansi Rani, PhD
3Research Scholar (Part Time Internal) RegisterNo:11964 Department of Computer Science & Engg 1, Assistant Professor of Computer Science2, Associate Professor of Computer Science & Engg 3
Manonmaniam Sundaranar University,Abishekapatti,Tirunelveli-627 012,Tamil Nadu,India1, The M.D.T Hindu College, Pettai , Tirunelveli ,Tamil Nadu India2 , Manonmaniam Sundaranar
University,Abishekapatti,Tirunelveli-627 012,Tamil Nadu,India3
Email:[email protected],[email protected],[email protected]
Abstract-As Environment scrutiny has risen and regulation has tightened in recent years,the importance of having accurate information on the environment performance of an industry has increased. India among other developing nations of the world, is facing the challenge of industrial pollution at an alarming rate. This has made the constant surveillance of environmental characteristics a necessary task.There is an urgent need to identify critically polluted areas and the pollutant levels.Air pollution monitoring is considered as a very complex task but nevertheless it is very important.One of the methods developed for the assessment of environmental consequences is Comprehensive Environmental Pollution Index(CEPI).A major problem for constructing the CEPI is the determination of an appropriate aggregation method to combine multi-dimensional environmental variables in to an overall index.The main aim of this paper to apply and analyses the robust statistical method namely Trimmed Mean and Winsorized Mean in air pollution data aggregation with the consideration of data accuracy and usefulness of data.
Keywords:Mean; Order Statistics;Trimmed mean;Winsorized mean
1. INTRODUCTION
Air quality is being a concern for all.The proper measurement and transmission of air quality data to the central control board has become a need for the society. The instantaneous data may also become relevant for depicting real-time generic information in the form of Air Quality Index.It has been taken as one of the priority of concern for Central Pollution Control Board. The air pollution level is increasing at a robust pace
mainly in the cities such as
Delhi,Lucknow,Kolkata,Bangalore,Chennai and Mumbai.[1]
Statistical methods have been used in almost every applied field to analyze the experimental data. Statistical methods are mathematical formulas, models and techniques that are used in statistical analysis of raw data. The application of statistical methods extracts information from data provides different ways to assess the outputs. Robust statistics provides an alternative approach to classical statistics methods. It is an extension of parametric statistics, taking into account that parametric models are at best only approximations to reality. Its primary goal is the development of procedures which are still reliable and reasonably efficient under small deviations from the model. Statistical procedures help to ensure that the information or observations are presented and interpreted in an accurate and
informative way.[2]This paper attempts to apply two of the robustmean classifications namely TrimmedMean and WinsorizedMean. Section 1presents the literature survey regarding the importance of aggregation and various aggregation methods, Section 2 describes the category of air quality,Section 3 discusses mean and robust mean ,Section4 discusses simulation study and Section 5 concludes the paper.
2. LITERATURE SURVEY
2639 are energy efficiency, network lifetime, latency,
communication, overhead and data accuracy. Duplicate sensitive, insensitive and lossy , lossless aggregation are the categories of approaches.[5]In sensor networks where the in-network processing of various aggregation quires is paramount ,data aggregation inside the network could drastically reduce the communication cost and ensure the desired bounds on the quality of data. The main property of a good aggregation algorithm is to extract the most representative data by using minimum resources[6]. A major problem for constructing the CEI is the determination of an appropriate aggregation method to combine multidimensional environment variable in to an overall index.Despite the existence of large number of CEI,there is a lack of objective criteria for choosing an appropriate aggregation method [7].Most wireless sensor network involve the collection of high amounts of data, for this reason in recent year’s considerable research effort has been devoted data aggregation algorithms.There are several statistical methods exists to summarize a list of data.One example is the use of one example is three quartiles-lower,median and upper,since they are unaffected by extreme values.It is also pointed that,quartiles reduce the amount of data to only three values while still reflecting the original data in an accurate way [8].
3. ACCURATE AIR QUALITY ANALYSIS
[image:2.595.67.287.560.647.2]Air Quality Index Summary Report displays an annual summary of Air Quality Index (AQI) values for countries or Core Based Statistical Areas (CBSA). To compute accurate air quality, AQI with all pollutant in a geographicarea is to be measured.
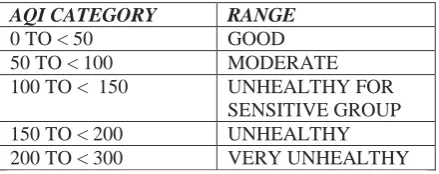
Table 1 Air Quality Index Value Category s
AQI CATEGORY RANGE
0 TO < 50 GOOD
50 TO < 100 MODERATE
100 TO < 150 UNHEALTHY FOR
SENSITIVE GROUP
150 TO < 200 UNHEALTHY
200 TO < 300 VERY UNHEALTHY
Table(1) shows the AQI category and the corresponding air quality valuesin ,parts per million (ppm) and parts per billion (ppb).
The point to be considered here is, the proper aggregation method used in industrial pollution monitoring. Mostly industries are sending average of air pollution data to the state Pollution Control Board. (TamilNadu Pollution Control Board).This may lead to the false analysis.
4. COMPARISION OF MEAN
Classical Mean is the most commonly used measure of central tendency Mean is nothing but the average.It is computed by adding all the values in the data set divided by the number of observations in it.
Formula for Mean
x Σ xi ) / n
x just stands for the sample mean Σ means add up
xi all of the x-values
n means the number of items in the sample
The major disadvantage of mean is that one or two very small or very large items either increase its value or reduce its value.The average cannot be really typical of the entire series.
In the robust literature, several robust methods of estimation have been proposed to reduce the influence of outliers in the data, on the estimates [9]. Robust mean such as Trimmed mean and Winsorized mean provides an alternative approach to classical statistics method. Trimmed mean is a statistical measure of central tendency much like the mean and median. It involves the calculation of the mean after discarding given parts of a sample at the beginning and the end of the whole data, and typically discarding an equal amount of both one. For most statistical applications, 5 to 25 percent of the ends are discarded. The trimmed mean is a useful estimator because it is less sensitive to outliers than the mean. In this regard it is referred to as a robust estimator.
Formula for Trimmed Mean
The winsorized mean is a useful estimator because it is less sensitive to outliers than the mean but will still give a reasonable estimate of central tendency or mean for almost all statistical models. In this regard it is referred to as a robust estimator. [10]
2640
n = number of observations.
Reorder them as "order statistics" Xi from the smallest to the largest.
Find lower case p=P/100
Compute np.
5. SIMULATION STUDY
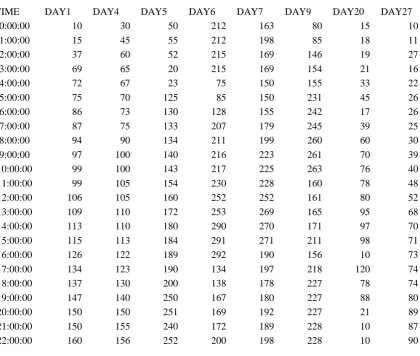
[image:3.595.77.498.276.632.2]This section presents the performance of two robust mean by providing numerical illustration of air pollution data.For the given data set estimates the value of scale and location parameters under various method of estimation by using NS2.Table(2)shows independent measurement of a Air Quality Index data obtained from UCI Repository. [11]
Table 2 Sample Air Quality Data (NO2)
Table 3 Parameters considered in this study
TIME DAY1 DAY4 DAY5 DAY6 DAY7 DAY9 DAY20 DAY27
0:00:00 10 30 50 212 163 80 15 10
1:00:00 15 45 55 212 198 85 18 11
2:00:00 37 60 52 215 169 146 19 27
3:00:00 69 65 20 215 169 154 21 16
4:00:00 72 67 23 75 150 155 33 22
5:00:00 75 70 125 85 150 231 45 26
6:00:00 86 73 130 128 155 242 17 26
7:00:00 87 75 133 207 179 245 39 25
8:00:00 94 90 134 211 199 260 60 30
9:00:00 97 100 140 216 223 261 70 39
10:00:00 99 100 143 217 225 263 76 40
11:00:00 99 105 154 230 228 160 78 48
12:00:00 106 105 160 252 252 161 80 52
13:00:00 109 110 172 253 269 165 95 68
14:00:00 113 110 180 290 270 171 97 70
15:00:00 115 113 184 291 271 211 98 71
16:00:00 126 122 189 292 190 156 10 73
17:00:00 134 123 190 134 197 218 120 74
18:00:00 137 130 200 138 178 227 78 74
19:00:00 147 140 250 167 180 227 88 80
20:00:00 150 150 251 169 192 227 21 89
21:00:00 150 155 240 172 189 228 10 87
22:00:00 160 156 252 200 198 228 10 90
Network Dimension 700 m x 700 m
Simulation Duration 25 s
2641 Table (3) shows the WSN setup parameters used in this study. The 23 values are assigned to each node to signify the pollutant values of a day in one hour duration. To supply pollution data for 31 days 31 leaf nodes are created and values are assigned.
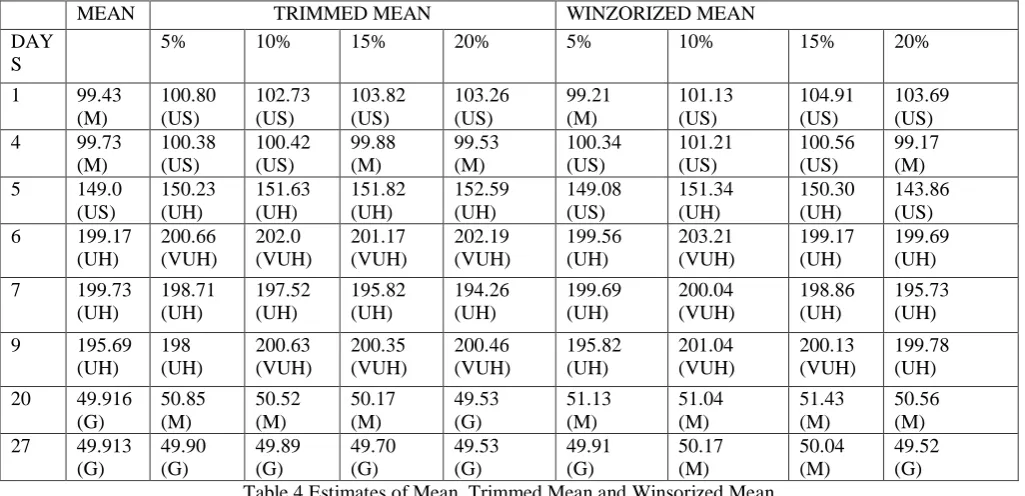
Table 4 Estimates of Mean, Trimmed Mean and Winsorized Mean
[image:4.595.118.450.98.265.2]The calculation of Mean value,Trimmed Mean(5%,10%,15%,20%) and WinsorizedMean (5%,10%,15%,20%) using the data in Table [2] is tabulated in Table [4]
Table 5 Comparision of Mean, Trimmed Mean(20%), Winsorized Mean(20%)
Estimators/Days Day1 Day4 Day5 Day6 Day7 Day9 Day20 Day27
Mean 99.43
(M) 99.73 (M) 149.0 (US) 199.17 (UH) 199.73 (UH) 195.69 (UH) 49.916 (G) 49.913 (G) Trimmed Mean
20% 103.26 (US) 99.53 (M) 152.59 (UH) 202.19 (VUH) 194.26 (UH) 200.46 (VUH) 49.53 (G) 49.53 (G) Winsorized Mean
20% 103.69 (US) 99.17 (M) 143.86 (US) 199.69 (UH) 195.73 (UH) 199.78 (UH) 50.56 (M) 49.52 (G)
Table [5] shows the Comparision of Mean, Trimmed Mean(20%), Winsorized Mean(20%). From Table [V]it is observed that in
Day(4 & 27) all the estimates are close to each other and that the data seem to be around 99 and 49. In Day(7) even though there is a minimum Node Location Predefined Location
No of Leaf Nodes 1 to 31
Data sensed Numeric data may be Air Water, Noise pollution level, Temperature
Network Model Tree Structure
Protocol Used Destination Sequenced Distance Vector Routing Protocol
MEAN TRIMMED MEAN WINZORIZED MEAN
DAY S
5% 10% 15% 20% 5% 10% 15% 20%
1 99.43
(M) 100.80 (US) 102.73 (US) 103.82 (US) 103.26 (US) 99.21 (M) 101.13 (US) 104.91 (US) 103.69 (US)
4 99.73
(M) 100.38 (US) 100.42 (US) 99.88 (M) 99.53 (M) 100.34 (US) 101.21 (US) 100.56 (US) 99.17 (M)
5 149.0
(US) 150.23 (UH) 151.63 (UH) 151.82 (UH) 152.59 (UH) 149.08 (US) 151.34 (UH) 150.30 (UH) 143.86 (US)
6 199.17
(UH) 200.66 (VUH) 202.0 (VUH) 201.17 (VUH) 202.19 (VUH) 199.56 (UH) 203.21 (VUH) 199.17 (UH) 199.69 (UH)
7 199.73
(UH) 198.71 (UH) 197.52 (UH) 195.82 (UH) 194.26 (UH) 199.69 (UH) 200.04 (VUH) 198.86 (UH) 195.73 (UH)
9 195.69
(UH) 198 (UH) 200.63 (VUH) 200.35 (VUH) 200.46 (VUH) 195.82 (UH) 201.04 (VUH) 200.13 (VUH) 199.78 (UH) 20 49.916
(G) 50.85 (M) 50.52 (M) 50.17 (M) 49.53 (G) 51.13 (M) 51.04 (M) 51.43 (M) 50.56 (M) 27 49.913
[image:4.595.43.556.311.559.2] [image:4.595.68.530.620.708.2]2642 variation in estimates the range same as
UnHealthy. In Day(20) Mean and Trimmed Mean estimates value are very close to each other and the Winsorized Mean value is slightly different. In Day
[image:5.595.167.467.153.316.2](1,5,6,9) the Mean values are different from Trimmed mean values.The data are applied to the DSDV protocol under the nodes and the results obtained are tabulated inTable [5].
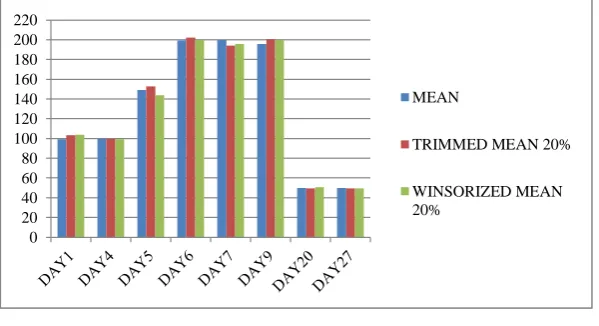
Figure 1 Graphical Representation of Table 5
Figure1 shows the comparision of pollution category using estimates mean,Trimmed mean 20% and Winsorized mean 20%. .Only after 20% elimination of data, the pollution category falls on similar type or some higher category of pollution range.
6.CONCLUSION
One of the essential techniques in WSN is Data aggregation. The simple and mostly used aggregation is mean. The major drawback of mean is that one or two very small or very large items underlie affect the average. To study the performance of robust estimators with classical mean the numerical illustrations are carried out by using NS2. If the data deviate from the Air quality Index the estimate based on the Mean are getting affected since they are highly non robust.Hence itis concluded that the robust estimators are not affected and provide the better results when outliers are present in the data. The next work is to apply various distribution methods that may be used for data aggregation in WSN.
REFERENCES [1] www.cpcb.nic.in
[2] Frederick J Gravetter ,Larry B.allnau Statistics for the behavioral science .
[3] Mohamed watfa,WilliamDaher and Hisham AI Azar, A sensor network data aggregation technique International journal of computer theory and engineering,volume.1,no.1,April 2009,pp:19-26.
[4]
NisheethShirvastava,Chiranjeebburagohain,Di vyakantAgrawal, Medians and beyond:New
aggregation techniques for sensor networks arxiv:cs/0408039v1[cs DC],aug 2004,pp:1-14. [5] KiranMaraiya,Karnalkant,NitinGupta,
Wireless sensor network: a review on data aggregation International journal of scientific
and engineering
research,Volume2,issue4,April 2011.
[6] HiiseyinAkcan and HerveBronnimann, A new deterministic data aggregation method for wireless sensor network Elsevier,May 2007. [7] P.zhou,B.W.Ang,K.L.Poh, Comparing
aggregation methods for constructing the composite environmental index: an objective measure Elsevier,Ecological s9,2006,305-311.
[8] KaviK,Khedo,RajivPerseedoss and
AvinashMungur A wireless sensor network air pollution monitoring system , International
journal of wireless and mobile
network,Vol.2,No 3,May 2010,pp:31-45.
[9]MahfuzurRahmanKhokan .Comparision Between Robust Trimmed and Winsorized Mean Based on Asymptotic Variance of the Influence Functions .
[10] A. M. H. Alkhazaleh and A. M. Razali New Technique to Estimate the Asymmetric Trimming Mean
[11] https://www.epa.gov/outdoor-air-quality-data/air-quality-index-report
0 20 40 60 80 100 120 140 160 180 200 220
MEAN
TRIMMED MEAN 20%