!
"!" # $ $"
% & ''' (
The Classification of Cancer Gene using Hybrid Method of Machine Learning
Y. K. JainDepartment of CSE SATI Vidisha, M.P., India
Geetika S Pandey
Department of CSE SATI Vidisha, M.P., India [email protected]
Deepak Kumar Gour*
Department of CSE SATI Vidisha, M.P., India [email protected]
Abstract:The purpose of this research work is to develop a method of classifying cancer using Gene expression data that is being used to gather information from tissue samples is expected to significantly improve the development of efficient cancer diagnosis and to provide understanding and insight into cancer related cellular processes. In this research, we propose a method for selection which uses factor analysis to further improve the SVM-based classification performance of gene expression data. We examine two sets of published gene expression data to validate the new feature selection method by means of Machine Learning with Binary Classification i.e. SVM classifier with different parameters. Experiments show that the proposed method can select a small quantity of principal factors to represent a large number of genes and SVM has a superior classification performance with the common factors which are extracted from gene expression data. Moreover, experiment results demonstrate successful cross validation accuracy of 93.75% for the breast cancer dataset and 98% for the leukemia dataset.
Keywords: Data mining, Support Vector Machine, Gene Expression Profile, Factor Analysis.
I. INTRODUCTION
Cancer is one of the atrocious diseases found in the living organism, which is one of the challenging studies for researchers since last 100 years. There were lot of proposal from various pioneers and detailed picture study was still going on. Basically Cancer is characterized by an abnormal, uncontrolled growth that may destroy and invade adjacent healthy body tissues or elsewhere in the body. Living organisms such as animals and plants are made of cells. The simplest organisms consist of just a single cell. The human body compromises of billions of cells; most of the cells have a limited life-span and need to be replaced in cyclic manner. Each cell is capable of duplicating themselves. Millions of cell divisions and replications take place daily in the body and it is astounding that the process occurs so perfectly most of the time every cell division requires replication of the 40 volumes of genetic coding. On rare circumstances there is some defect in a division and a rogue, potentially malignant cell arises. The immune system seems to recognize such occurrences and is generally capable of removing the abnormal cells before they have an opportunity to proliferate. Rarely, there is a failure of the mechanism and a potentially malignant cell survives, replicates and cancer is the result. The initiation of DNA microarray technology provides biologists with the ability to measure the expression levels of thousands of genes in a single experiment. With the development of this technology, a large quantity of gene expression data from such experiments has been accumulating quickly, so a novel means should be explored to extract its biological functions and to gather information from tissue and cell samples regarding gene expression differences that will be useful in diagnosing
disease. Therefore, diagnosing cancer is an important and direct application of gene expression data.
A support vector machine (SVM) [1] is a computer algorithm that learns by example to assign labels to objects. For instance, a common bioinformatics application of support vector machines is the automatic classification of microarray gene expression profiles. Theoretically, an SVM can examine the gene expression profile derived from a cancer sample or from peripheral fluid and arrive at a diagnosis or prognosis. Biological applications of SVMs involve classifying objects as diverse as protein and DNA sequences, microarray expression profiles and mass spectra [20]. In essence, an SVM is a mathematical entity, an algorithm (or recipe) for maximizing a particular mathematical function with respect to a given collection of data. The basic ideas behind the SVM algorithm, however, can be explained without ever reading an equation.
the dimensionality of data and to apply SVM to accurately classify gene expression data.
II. RELATED WORKS
A great deal of research has been done in the classification of gene expression data, the discovery of gene function and gene regulation network by utilizing unsupervised methods such as clustering [6] and self-organizing maps. While clustering the row or column vectors of gene expression data matrix, little prior biology knowledge is adopted, and we even don’t know the biological meaning of the clustering results. Supervised methods such as decision trees, SVM and multi-layer perceptrons have been broadly applied in order to classify normal and Cancer tissues [2][4][12] However, there exist many noises and redundancy in gene expression data, so feature selection plays a key role in the classification of gene expression data. Furlanello [7] describes a wrapper algorithm for fast feature ranking in classification problems, which is designed to support intensive model selection, and is an entropy-based recursive feature elimination method that can eliminate chunks of uninteresting features according to the entropy of the weights distribution of SVM classifiers. Tang [10] proposes a new problem of simultaneously mining phenotypes and informative genes from gene expression data. Nishimura [16] present a PCA
DNA microarray is composed of thousands of individual DNA sequences printed in a high density array on a glass microscope slide. Samples are generated under multiple conditions which may be a time series during a biological process or a collection of different tissue samples. Let G = {
g-1….gn} be a set of genes and S = {s1…sm }be a set of samples.
The corresponding gene expression matrix can be represented as M={Xi,j | 1 i m, 1 j n}. The matrix M is composed of and normal samples, which is a binary classification problem. A simple way to build a binary classifier is to construct a hyper-plane which separates Cancer members from normal members in feature space. Suppose wT ∩ wN = , wT ∪wN = normal tissues. To precisely classify Cancer we have to select genes, which is called informative genes, highly related to Cancer for classification. Therefore, to reduce unnecessary noise to the classification process, informative genes selection is of great importance in the analysis of gene expression data. Here we propose a novel method called hybrid method, which integrates factor analysis (FA) with Feature Score Criterion (FSC) that was used in [5], to drastically reduce the dimension of gene expression data and to minimize the information loss before using the SVM algorithm. The novel hybrid method introduce every step in algorithm in details in the next several sections
Step 1 Gene selection: selecting top-ranked genes Gtop, which
have higher feature score, and we can obtain a matrix
p
Mx
×
where p is the number of selected genes.Step 2 Extracting common factors: applying Factor Analysis
(FA) [17] to the top ranking genes G top to calculate r new latent factor variables as represents of Gtop, satisfying r<| G top | .We can obtain common factor matrix
Fm
×
r
.Step 3 Classification: training SVM with train sets and
applying SVM to classify
Fm
×
r
C. Gene Selection
the responses on a number of measured variables and as such is a “non-dependent” procedure. The primary objectives of FA are to determine the number of common factors influencing a set of measures and the strength of the relationship between each factor and each observed measure. Let observable vector be denoted as x=(x1,x2 ...,xn) and its mean vector be a vector = ( 1, 2…. m ) . So factor model can be generally denoted as x
= + Af + , where f = ( f1, f2 ,…., fr) (r m) is a common
factor vector, = ( 1, 2….. m ) is a specific factor vector, and
A = (a i,j )mxr is a factor loading matrix. Firstly we determine the optimal number of factors according to the Kaiser criterion stating that a number of factors should be equal to the number of the eigenvalues of the correlation matrix that are greater than one. Then we extract initial set of factors according to principal component method and rotate our factors to the final solution by means of Varimax orthogonal rotation. Hence each of measures will be linearly related to each of factors. The strength of this relationship is contained in the respective factor loading. This loading can be interpreted as a standardized regression coefficient, regressing the factor on the measures.
E. Support Vector Machines
SVM are a relatively new type of statistic learning theory, originally introduced by Vapnik and successively extended by a number of other researchers. The advantage of SVM is that its general capability can be improved by using structural risk minimization principle. In another words, we can get a relatively small error rate on independent testing sets under the circumstances of utilizing limited training sets. We are given some training data, D a set of npoints of the form
D = {(xi,yi | xi Rp, yi {-1,1}}ni-1
where the yi is either 1 or −1, indicating the class to which
the point Xi belongs. Each Xi is a p dimensional real vector. We want to find the maximum-margin hyperplane that divides the points having yi = 1 from those having yi = − 1. Any hyperplane can be written as the set of points X satisfying W.
X – b = 0, where denotes the dot product. The vector W is
a normal vector: it is perpendicular to the hyperplane the parameter b/||W|| determines the offset of the hyperplane from the origin along the normal vector W. We want to choose have to prevent data points falling into the margin, we add the following constraint: for each i either W. Xi –b 1for Xiof the first class or W . Xi - b -1 for Xi of the second, This can be
rewritten as: yi (W. Xi - b) 1, for all 1 i n We can put this together to get the optimization problem: Minimize (in W, b)
||W|| subject to (for any i=1,….n) yi (W. Xi – b) 1
IV. EXPERIMENTS
A. Sample Datasets
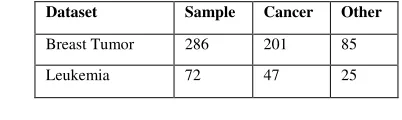
We have experiment with two datasets: Breast Tumor dataset and leukemia dataset (Table 1). This breast cancer domain was obtained from the University Medical Centre, Institute of Oncology, Ljubljana, Yugoslavia This is one of three domains provided by the Oncology Institute that has repeatedly appeared in the machine learning literature. This data set includes 201 instances of one class and 85 instances of another class. The instances are described by 9 attributes, some of which are linear and some are nominal. Number of Instances: 286, Number of Attributes: 9 + the class attribute, Attribute Information: Class: no-recurrence-events, recurrence-events, age: 10-19, 20-29, 30-39, 40-49, 50-59, 60-69, 70-79, 80-89, 90-99.menopause: lt40, ge40, premeno, tumor-size: 0-4, 5-9, 10-14, 15-19, 20-24, 25-29, 30-34, 35-39, 40-44, 45-49, 50-54, 55-59, inv-nodes: 0-2, 3-5, 6-8, 9-11, 12-14, 15-17, 18-20, 21-23, 24-26, 27-29, 30-32, 33-35, 36-39, node-caps: yes, no, deg-malig: 1, 2, 3, breast: left, right, breast-quad: left-up, left-low, right-up, right-low, central, irradiat: yes, no. The dataset is Available at [19]. The leukemia dataset is bone marrow samples that are taken from 72 patients with either acute myeloid leukemia (AML) or acute lymphoblastic leukemia (ALL) [5]. The dataset consists of 47 ALL samples and 25 AML samples, and contains expression levels for 7129 human genes produced by Affymetrix high-density oligonucleotide microarrays. The scores in the dataset represent the intensity of gene expression after being rescaled to make overall intensities for each chip equivalent. We collect dataset for experiment from. [18]
Table 1 Description of sample datasets regularization parameter C. However, finding the best choices for the kernel and parameters can be challenging when applied to real datasets. Generally, the recommended kernel for nonlinear problems is the Gaussian radial basis kernel:
K(x,y) = exp(-g|x-y|2 ) predefined interval. Performance of classifiers was tested by
Dataset Sample Cancer Other
Breast Tumor 286 201 85
utilizing a cross-validated method and accuracy of a diagnostic test can be expressed with cross validation accuracy
C. Results and Analysis
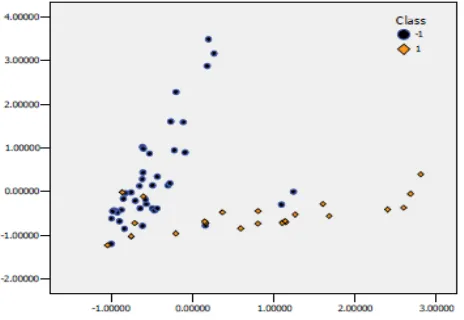
Initially, experiments are carried out only using hybrid method to select the 150, 50, 20 and 12 top-ranked genes as represents of genes in table 1, 2 respectively, and then on the basis of the selected genes we employ FA to extract their principal factors whose eigen values should be over 1 to be used as the input of SVM classifier. Table 2 and 3 show the experiment results of two methods under the different parameters (C, g), for two datasets, respectively, where last column represent about the accuracy of classification means the feature score (%) rate of factors and. Figure 1 plot graph for breast tumor dataset for top 12 selected genes and fig 2 respectively plot the graph for leukemia dataset for the top 12 selected genes. We obviously see that among 286 breast tumor samples are approximately divided into two classes: normal tissue and tumor tissue and 72 leukemia samples are also approximately divided into two classes: ALL and AML. Therefore, we can conclude that FA has the effect of clustering samples and our hybrid method is obviously superior to the single FSC method in reducing dimension for SVM classification and in improving performance of SVM classification while retaining the same recognition rate. Experiments also show that many genes are closely related and dominated by many latent factors; however, how to interpret those principal factors require more knowledge of biology.
Table 2 Results Comparison for Breast Tumor Dataset
Method
Selected Genes
Extracted
Factors C g
Cross Validation Accuracy
FCS
150 500 0.00008 90.32 %
100 500 0.00008 90.54 %
50 1000 0.00002 90.83 %
20 500 0.0001 91.00 %
12 1000 0.002 91.95 %
Hybrid
150 16 1500 0.00006 91.00 %
100 12 500 0.008 91.32 %
50 6 500 0.002 91.56 %
20 3 1500 0.001 92.22 %
12 2 500 0.02 93.75 %
Table 3 Result Comparison for Leukemia (ALL/AML) Dataset
Method
Selected Genes
Extracted
Factors C g
Cross Validation Accuracy
FCS
150 500 0.00008 90.32 %
100 500 0.00008 91.94 %
50 1000 0.00002 92.33 %
20 500 0.0001 92.88 %
12 1000 0.002 96.23 %
Hybrid
150 16 1500 0.00006 92.00 %
100 12 500 0.008 93.32 %
50 6 500 0.002 95.56 %
20 3 1500 0.001 96.22 %
12 2 500 0.02 98.00 %
2D scatter plot for the selected 12 genes using hybrid method on breast cancer dataset, where 1 means normal tissue and -1 means tumor tissue. (Fig 1 Image from Orange Canvas software)
2D scatter plot for the selected 12 genes using hybrid method on leukemia dataset, where 1 means ALL and -1 means AML
(Fig 2. Image from Orange Canvas software)
V. CONCLUSION AND FUTURE WORK
VI. REFERENCES
[1] Vapnik V.N., Statistical learning theory, Springer, New York, 1998.
[2] Terrence S. Furey, Nello Cristianini, Nigel Duffy, David W. Bednarski, Michel Schummer, and David Haussler, “Support vector machine classification and validation of cancer tissue samples using microarray expression data,” Bioinformatics, 2000, 16(10): 906-914.
[3] Krzysztof Simek, Krzysztof Fujarewicz, Andrzej Swierniak, Marek Kimmel, Barbara Jarzab, Malgorzata Wiench, and Joanna Rzeszowska, “Using SVD and SVM methods for selection, classification, clustering and modeling of DNA microarray data,” Engineering Applications of Artificial Intelligence, 2004, 17: 417-427. [4] I. Guyon J. Weston S. Barnhill and V. Vapnik, “Gene
selection for cancer classification using support vector machines,”Machine Learning, 2002, 46: 389-422.
[5] Golub T.R., Slonim D.K., Tamayo P., Huard C., Gaasenbeek M., Mesirov J.P., Coller H., Loh M.L., Downing J.R., Caligiuri M.A., Bloomfield C.D. and Lander E.S., “Molecular classification of cancer: class discovery and class prediction by gene expression monitoring,” Science, 1999, 286: 531-537.
[6] Eisen M., Spellman P., and Botstein D., “Cluster analysis and display of genome-wide expression patterns,” PNAS, 1998, 95: 14863-14868.
[7] Furlanello C., Serafini M., Merler S., and Jurman G., “An accelerated procedure for recursive feature ranking on microarray data,” Neural Networks, 2003, 16: 641-648. [8] Orange widgets and Canvas beta release (Nov 2010).
Check Orange’s web page www.ailab.si/orange.
[9] Cristianini N. and Shawe-Taylor J., An Introduction to Suppor Vector Machines, Cambridge University Press, Cambridge, UK,2000.
[10] Chun Tang, Aidong Zhang, and Jian Pei, “Mining phenotypes and informative genes from gene expression data,” Aug. Proceedings of the ninth ACM SIGKDD international conference on Knowledge discovery and data mining, 2003, 655-660.
[11] Topon Kumar Paul, and Hitoshi Iba, “Extraction of informative genes from microarray data,” Proceedings of
the 2005 Conference on Genetic and Evolution Computation, Washington DC, USA, 2005, 453-406. [12] Sung-Bae Cho and Hong-Hee Won, “Machine learning in
DNA microarray analysis for cancer classification,” Proceedings of the First Asia-Pacific Bioinformatics Conference on Bioinformatics, 2003, 189-198.
[13] Daisuke Komura, Hiroshi Nakamura, and Shuichi Tsutsumi, “Multidimensional support vector machines for visualization of gene expression data,” Bioinformatics, 2005, 21(4): 439-444.
[14] Michael P.S. Brown, William Noble Grundy, David Lin, Nello Cristianini, Charles Walsh Sugnet, Terrence S. Furey, Manuel Ares Jr., and David Haussler, “Knowledge-based analysis of microarray gene expression data by using support vector machines,” Proceedings of the National Academy of Sciences, 2000, 97(1): 262-267.
[15] Alon U., Barkai N., Notterman D.A., Gish K., Ybarra S., Mack D., and Levine A., “Broad patterns of gene expression revealed by clustering analysis of Cancer and normal Breats Tumor tissues by oligonucleotide arrays,” Proc. Nat. Acad. Sci. USA, 1999, 96: 6745-6750.
[16] Kunihiro Nishimura, Koji Abe, and Shumpei Ishikawa, Shumpei Ishikawa, Shuichi Tsutsumi, Koichi Hirota, and Hiroyuki Aburatani, “A PCA based method of gene expression visual analysis,” Genome Informatics, 2003, 14: 346-347.
[17] Hans Schneeweiss and Harald Mathes. “Factor analysis and principal components,” Journal of multivariate analysis, 1995, 55(1): 105-124.
[18] http://www.broad.mit.edu/cgi-in/cancer/datasets.cgi [19] http://www.molbio.princeton.edu/breatstumordata [20] William S Noble “What is support Vector Machine”
Nature Publishing Group http:// www. nature. com/ nature
biotechnology NATURE BIOTECHNOLOGY
VOLUME 24 NUMBER 12 DECEMBER 2006 1565-1567