Original Research Article
Evaluation of primigravida in labour using modified WHO partograph:
comparative study of 100 cases
Nivedita D., Mehvish Anjum*
INTRODUCTION
The safe mother hood initiative (SMI) emphasized that the monitoring of labour for early detection of dystocia is one of the most important approaches for reducing the mortality and the neonatal mortality. In the context partogram has been introduced by WHO to monitor labour in maternity clinics in the developing countries.
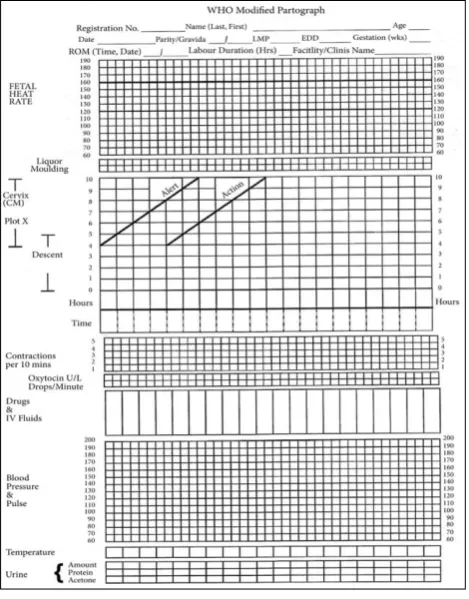
WHO modified the partograph in 2000 (Figure 1). The latent phase is excluded in this partograph. It is based on the following principle: Active phase of labour commenced at 4 cm of cervical dilatation. Cervical
dilatation is plotted on vertical line on the left side of the graph in cms (4-10 cms) against elapsed time on the horizontal line in hours. Onset of labour pains and cervical dilatation of 4 cms is taken as 0 Hrs. A guide line was drawn from 3 cms dilatation upwards at a slope of 1 cm/hr to full dilatation. This is termed as alert line and it alerts about delayed progress of labour.
Another line is drawn four hours parallel to the right of the alert line termed as action line which indicates need for active interference. The other features are same as the composite partograph. During active phase the rate of cervical dilatation should be least 1cm/hr. Conservative
ABSTRACT
Background: Prolonged labour has become a rarity in developed countries, but it still poses a problem in developing countries causing increase in maternal and perinatal morbidity and mortality. This study is undertaken to assess the efficacy of modified WHO partograph in monitoring progress of labour in primigravidae with spontaneous onset of labour and in patients with active management and to assess whether active management of labour helps in reducing the duration of labour.
Methods: In this study, 100 primigravidae partographs are analyzed, 50 patients are in active management group (early amniotomy and use of oxytocin) and 50 patients are in control group (spontaneously).
Results: The mean duration of first stage of labour in the study group is 6.73±2 and in the control group is 11.30±4.51hrs( statistically significant p<0.001).Mean duration of second stage of labour in study group is 33.73±28.77mins and in control group is 38±24.98 mins (p<0.079), mean total duration of labour in active group is 7.17±2.64 hr and in control group is 11.76hrs±-4.71hrs ( p<0.001).89% of study group patients had Spontaneous Vaginal Delivery as compared to the 80% in control group (p>0.05 ). Assisted vaginal delivery (vaccum) is found in 6% in the study group and 8% in control group patients (p>0.05). LSCS is found 10% in study group and 8% in control group patients (p>0.05).
Conclusions: Active management of labour significantly reduces the mean duration of 1st active stage, 2nd stage and
total duration of labour, but does not decrease the rate of the caesarean section.
Keywords: Amniotomy, Dysfunctional labour, Oxytocin, Partograph
Department of Obstetrics and Gynecology, KBNIMS, Kalburgi, Karnataka, India
Received: 02 January 2018
Accepted: 15 January 2018
*Correspondence:
Dr.Mehvish Anjum,
E-mail: [email protected]
Copyright: © the author(s), publisher and licensee Medip Academy. This is an open-access article distributed under the terms of the Creative Commons Attribution Non-Commercial License, which permits unrestricted non-commercial use, distribution, and reproduction in any medium, provided the original work is properly cited.
management is recommended until cervical dilatation curve reaches alert line. WHO recommends referral from health centre to hospital once the cervicograph reaches alert line.1
Figure 1: The modified WHO partograph.
The single factor that has contributed the most to the increase in ceasarean deliveries is increase in frequency of dystocia. Introduction of partograph with an agreed labour management protocol reduced both prolonged labour from 6.4% to 4%, emergency caesarean section rates reduced from 9.9% to 8.3% and intrapartum still birth reduced from 0.5% to 0.3%.
Among singleton pregnancies with no complicating factors outcome was marked with reduced caesarean section rates 6.2% nulliparas and 4.5% in multiparous women. On implementation the results provided evidence that the use of WHO partograph was a simple management protocol which improves the outcome of labour and reduces incidence of prolonged labour and operative intervention. Thus, the Partograph which is designed to decrease the incidence of dystocia therefore have potential for reducing rate of ceasarean section.2
The active management of labour has been proposed by Jose A et al as a strategy to reduce the incidence of dystocia.3 This approach involves the education of
patient, attention to the accurate diagnosis of labour. Early amniotomy, early use of relative high dose of oxytocin for abnormalities of labour. It was first implemented in1968 at the National Maternity Hospital
in Dublin, Ireland. Active management of labour reduces the incidence of dystocia and increase rate of vaginal delivery without increasing maternal or neonatal outcome.
This study is undertaken to assess the efficacy of modified WHO partograph in monitoring progress of labour in primigravidae with spontaneous onset of labour and in patients with active management and to assess whether active management of labour helps in reducing the duration of labour.
METHODS
It was a hospital based cross sectional study. The present study included 100 cases of primigravidae who were admitted in a Tertiary Care Centre. Study period-3 months.
Inclusion criteria
Primigravida in labour with
• With singleton pregnancy,
• 37 -40 weeks of gestation,
• Cephalic with vertex presentation,
• Weight of baby > 2.5 Kg -4kg (USG estimation),
• Without premature rupture of membranes.
Exclusion criteria
• Primigravida who came late in labour and with
cephalopelvic disproportion.
• Primigravida with any high risk pregnancy like
pregnancy induced hypertension, intra uterine growth
retardation, gestational diabetes mellitus,
macrosomia (>4kg baby weight) etc.
On admission to labour room a detailed history of patient was noted such as address (Rural/Urban/Slum area), age of the patient along with I. P. No and booked/ unbooked status. General examination: vital signs, Height, weight, anemia, pedal edema and are noted.
Systemic examination
Cardiovascular system and respiratory system.
P/A
and perineal floor as +5 (American classification).4 The
fetal heart Rate, regularity and position is noted.
Pelvic examination
Under aseptic precaution done to note position, consistency, effacement and dilatation of cervix. State of membranes whether intact or ruptured, if ruptured the colour of liquor is observed to know whether it was clear or meconium stained. Presentation, position and station of head is noted in relation to the plane of ischial spine. Assessment of pelvis is done clinically to exclude cephalo pelvic disproportion by Muller Hills maneuver.5
Routine investigations like blood group. Rh typing, Hb%, serological tests for HIV, HBsAg, VDRL and urine routine were done. Obstetric ultrasound was done for fetal biometry, Amniotic Fluid Index, EFW (Estimated Fetal Weight), placental localisation.
There are 50 patients in the control group and 50 patients in the active management group. Patients are diagnosed to be in labour, when at term painful uterine contractions are accompanied by any one ruptured membranes, bloody show, or complete cervical effacement.6 Patients in the
control group are allowed to go into normal labour and monitored by partograph.
In the active management artificial rupture of membrane is done even after one hour if uterine contractions are not adequate, oxytocin 5 units in 500ml given till patient gets 3 contractions lasting 30-40 sec in 10 minutes. Partograph is plotted when patient goes into active labour i.e. >4 cm dilatation and the study is done noting the duration of labour of first stage, second stage of labour and third stage duration is noted and any deviation from the normal progress.
After selection the cases were monitored as follows
Frequency and duration of uterine contractions and fetal heart rate are noted by CTG (cardiotocographically).
Per Vaginal Examination done to assess the progress of labour, every fourth hourly till cervical dilatation reaches 4 cm and second hourly if oxytocin is used for augmentation. Every second hourly if cervix is more than 7cm dilatation, hourly if cervix more than 9cm dilatation. If dysfunctional labour is diagnosed every second hourly examination is performed. If the membranes are ruptured noted the colour of liquor, clear or meconium stained and degree of moulding of the head.
Temp checked every 4th hourly, Blood pressure and pulse
is recorded every 30 minutes. Fetal heart sound is recorded every 15 min and uterine contractions checked every 30 min and documented. After per vaginal examination cervical dilatation is recorded every 2-3 hour along with descent of head. Liquor and moulding of the head. Drugs and I.V. fluids are noted. Urine is sent for routine and microscopy.
Observations recorded on modified partograph. Marking is done on the partograph whenever patients are in active phase of labour from 4 cm of cervical dilatation. Cervical dilatation is plotted on vertical line on the left side of the graph in cms (4-10 cms) against elapsed time on the horizontal line in hours. Onset of labour pains and cervical dilatation of 4 cms is taken as 0 Hrs.
A guide line was drawn from 3 cms dilatation upwards at a slope of 1 cm/hr to full dilatation. This is termed as alert line and it alerts about delayed progress of labour. Another line is drawn four hours parallel to the right of the alert line termed as action line which indicates need for active interference. Patients who are left to alert line are taken as Group A patients, those who crossed the alert line were said to be Group B patients and those who crossed action line were said to be in action zone Group C.
Treatment given, mode of delivery and indications for instrumental delivery were illustrated on the curve of partograph which ends at the delivery of baby. Evaluation of new born is done by Apgar score and third stage complications if any are also noted.
RESULTS
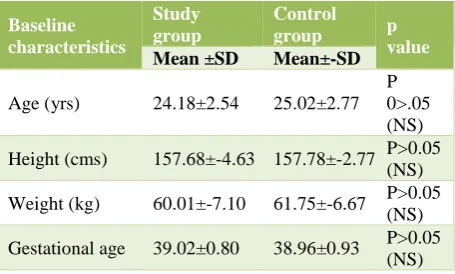
Table 1 shows the baseline parameters of both the groups. The mean maternal age of in study group is 24.18yrs and 25.02 yrs in the control group.
[image:3.595.315.543.556.693.2]The mean maternal height in study group is 157.68cms and control group is 157.78cms. The mean weight of patients in the study group is 60kgs and in control group is 61kgs. The mean gestational age of patients in both study group and control group is 39wks. It is found that both groups are matched with respect to the maternal age, height, weight and gestational age of patients.
Table 1: Distribution of cases according to the baseline characteristics.
Baseline characteristics
Study group
Control
group p
value
Mean ±SD Mean±-SD
Age (yrs) 24.18±2.54 25.02±2.77
P 0>.05 (NS)
Height (cms) 157.68±-4.63 157.78±-2.77 P>0.05
(NS)
Weight (kg) 60.01±-7.10 61.75±-6.67 P>0.05
(NS)
Gestational age 39.02±0.80 38.96±0.93 P>0.05
(NS)
Table 2: Distribution of patients according to the duration of labour.
Stages of labour
Study group Mean±SD
Control group
Mean±SD Significance
Active
phase 3.86±1.81 4.90±3.53 P<0.10
2nd stage 33.73±28.77 38.00±24.98 P<0.079
3rd stage 9.42±3.68 13.89±3.53 -
Total
duration 7.173±2.64 11.76±4.71 P<0.001(HS)
The mean duration of second stage of labour in study group is 33.73±28.77min and in control group is 38±24.98mins. P<0.079 is statistically significant. The mean of the total duration of labour in study group is 7.17±-2.64hrs and in control group is 11.76±-4.71hrs.
All patients in study group and control group had third stage duration <30 min. hence comparison was not done. The total duration of labour is decreased significantly in the study group as compared to the control group and this
is found to be statistically highly significant
p<0.001(HS).
Table 3: Distribution of cases according to the mode of delivery.
Study group Control group
N=50 % N=5 %
SVD 42 89 40 80 P>0.05 (NS)
AVD 3 6 6 12 P>0.05 (NS)
LSCS 5 10 4 8 P>0.05 (NS)
X2 =1.160, df=2, P>0.05, SVD-spontaneous vaginal delivery,
AVD- assisted vaginal delivery, LSCS- lower segment caesarean section
Table 3 shows in study group, patients with spontaneous vaginal delivery are 89% as compared to 80% in control group patients. Rate of Assisted Vaginal delivery (vaccum) is 6% in study group and 8% in control group patients. Surgical intervention like LSCS is found in 10% of the study group and 8% in control group patients, however mode of delivery in both the groups is not different and this is found to be statistically non significant.
Table 4: Distribution of cases according to the maternal complications.
Complications Study
group
Control group
Maternal No. % No. %
PPH 1 2 0 P>0.05(NS)
Cervical tear 0 1 2 P>0.05(NS)
Fetal P>0.05(NS)
Fetal distress 3 6 4 8 P>0.05(NS)
Table 4 shows that there is no difference in maternal and fetal complications in both groups and this is statistically non significant.
Table 5: Distribution of the cases according to the groups in the partogram.
Study group Control group
No. % No. %
Group A 38 76 28 56
Group B 10 20 17 34
Group C 2 4 5 10
Total 50 100 50 100
Group A: when they are to the left of the alert line; Group B: when they cross the alert line; Group C: when they cross the action line.
Table 5 shows distribution of cases into groups on partograph.
Table 6: Distribution of the cases in the study and control group according to the mode of delivery in the
Group A, Group B and Group C.
Control
group SVD AVD LSCS
No.=50 No. % No. % No. %
Group A
(n=28) 26 92.85 1 3.5 1 3.5
Group B
(n=17) 14 82.3 2 11.7 1 5.8
Group C
(n=5) 2 40 1 20 2 40
Study group, No.=50
Group A
(n=38) 35 92.1 2 5.26 1 2.6
Group B
(n=10) 8 80 0 2 20
Group C
(n=2) 0 0 2 100
Table 6 shows distribution of the cases in the study and control group according to the mode of delivery in the Group A, Group B and Group C.
Figure 2: Distribution of cases according to duration of second stage of labour of labour.
DISCUSSION
50 patients are in control group. Data shows that both the groups are comparable in respect of age, height and weight and gestational age where the P value is >0.05 and was found to be statistically non significant. As they were correctly matched the influence of these factors on labour outcome was eliminated.
In the present study, 94% of actively managed group and 56% of control group patients delivered within 12 hours which is significant. Active management of labour corrects inefficient uterine contractions and prevents prolonged labour and dystocia. This is found to be statistically highly significant (P <0.0001) and our results are comparable to the study done by Zeno L et al and Rogers et al.3,7
In present study the mean duration of second stage of labour in study group is 33.73±28.77min and in control group is 38±24.98mins. P<0.079 (S) is statistically significant. This study is comparable to Cammu (Mean duration of the 2nd stage of labour was 28 min in study group and 26 min in control group).8
In the present study all patients in study group and control group had third stage duration <30 min. The Mean duration of 3rd stage of labour in present study was 9.42±3.68 min in study group and 13.98±3.53 in control group. Result of the mean duration of third stage of labour is comparable to the study done by Rogers et al.9
Mean duration of the 3rd stage of labour (in minutes) was
[image:5.595.55.281.474.523.2]9 min in Roger et al study group and 8 min in control group.
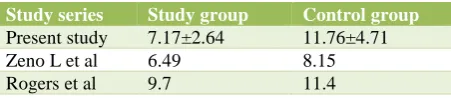
Table 7: Mean of total duration of labour (in hrs).
Study series Study group Control group
Present study 7.17±2.64 11.76±4.71
Zeno L et al 6.49 8.15
Rogers et al 9.7 11.4
Mean of total duration of labour in present study is comparable to the study done by Zeno L et al and Rogers et al (Table 7).3,7
In this study, spontaneous vaginal delivery is achieved in 84% in active management group compared to 80% in the control group patients suggesting that number of patients having vaginal delivery in active management group increased marginally which is statistically non-significant (P>0.05). These results are comparable to Roger et al6 study (spontaneous vaginal delivery was 81% in Roger et all study group and 82% in control group).
10% of cases in the active management group and 8% in the control group patients had ceasarean section, this difference in the caesarean section rate is not significant (P >0.05) suggesting that there is no decrease in the overall caesarean section rate. Some of the studies have
shown that there is no change in the caesarean section rate.
The present study is comparable to study done by Sandler et al.9 Ceasarean section Rate in Sander et all study is
10% in both study as well in control group. Also, the mode of delivery in the three groups A, B and C is comparable with that of Philpot et al.10 Thus, Partograph
is the simple and inexpensive tool in monitoring progress of labour.
The clarity of information obtained from it, simplifies data collection on application helps in decreasing the maternal, fetal mortality and morbidity. Also, Active management of labour significantly reduces the mean duration of all stages of labour as well total duration of labour, but does not decrease the rate of the caesarean section.
By comparing the study and control group it is clearly evident that a close supervision of parturient women can significantly reduce the incidence of dysfunctional labour.
Funding: No funding sources Conflict of interest: None declared
Ethical approval: The study was approved by the Institutional Ethics Committee
REFERENCES
1. Yisma E, Dessalegn B, Astatkie A, Fesseha N.
Completion of the modified World Health
Organization (WHO) partograph during labour in public health institutions of Addis Ababa, Ethiopia. Reproductive health. 2013 Apr 18;10(1):23.
2. Kwast BE, Lennox CE, Farley TM, Olayinka I.
World Health Organization partograph in
management of labour. Lancet. 1994 Jun
4;343(8910):1399.
3. Jose A, Zeno L, Peaceman A, Joseph A. A
controlled trial of a program for the active management of labour. The New Eng J Med 1992;326:450-4.
4. Friedman E, Sachtleben BS. Station of the fetal presenting part: pattern of descent. Am J Obstet Gynecol. 1965;93:522-9.
5. Gary Cunningham F, Kenneth J, Steven L, John C,
Larry Gilstrap, Katherine D. Labour and
Delivery.Williams Obstetrics. 23nd edition. Mcgraw Hill; 2010:474.
6. O’Driscol K, Stronge JM, Minogue M. Active
management of labour. Br Med J. 1973;3:135-7.
7. Rogers R, Gilson GJ, Miller AC, Izquierdo LE,
Curet LB, Qualls CR. Active management of labor: does it make a difference?. Am J Obstet Gynecol. 1997;177(3):599-605.
8. Cammu H, Van Eeckhout E. A randomised
amniotomy and oxytocin infusion in nulliparous labour. Br J Obstet Gynecol. 1996;103:313-18.
9. Sadler LC, Davison T, McCowan LM. A randomised
controlled trial and meta analysis of active management of labour. Br J Obstet Gynecol. 2000;107:909-15.
10. Philpot RH, Castle WM. Cervicographs in the
management of labour in primigravidae. J Obstet Gynecol Br Common Wealth. 1972;79:592-602.
Cite this article as: Nivedita D, Anjum M.