DOI: http://dx.doi.org/10.26483/ijarcs.v9i4.6278
Volume 9, No. 4, July – August 2018
International Journal of Advanced Research in Computer Science
RESEARCH PAPER
Available Online at www.ijarcs.info
ISSN No. 0976-5697
ISSN No. 0976-5697
IMPROVING THE ACCURACY FOR SENTENCE LEVEL SENTIMENT
ANALYSIS
Akshita Jaitly, Sachi Ahuja
Manipal University, Jaipur,India
[image:1.595.328.559.583.702.2]Abstract: Sentiment Analysis is one of the trending topics in the Information and Technology field. In this paper, we tried to increase the efficiency of sentiment analysis. To achieve maximum accuracy, a sentence level analysis was performed by taking into account oxymoron (i.e. Figure of speech in which apparently contradictory terms appear in conjunction). We addressed the problem of sentiment analysis in twitter by classifying the tweets according to the sentiment expressed in them.
Keywords: Sentiment Analysis, Negative word, Positive word, oxymoron, accuracy, Twitter, data.
I. INTRODUCTION
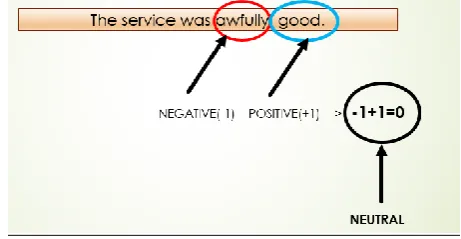
The main purpose of sentiment analysis is to conclude positive sentiments, neutral sentiments or negative sentiments from given opinionated text. The positive words would get a +1 or above score and the negative words would get a -1 or below score. Our focal point is to take into consideration sentences containing Oxymoron (i.e. a figure of speech in which apparently contradictory terms appear in conjunction) and increase the accuracy of results. Oxymoron, if not taken into consideration will give a neutral sentiment to an otherwise positive/negative sentence. In this paper, we propose a model with an increased accuracy of sentiment analysis. We worked on Twitter data by analyzing tweets about Mr. Narendra Modi and Mr. Donald Trump. First, an individual analysis was performed and the two results were compared. Then, the results were showcased through histograms and density plots.
This model can be used in areas like hospitals, airlines, crime rate detection, business product reviews etc as the efficiency of their analysis is of utmost importance and is achieved through less number of neutral sentences as compared to other models.
ADVANTAGES
● Adjust marketing strategy
● Measure ROI of your Marketing campaign ● Develop product quality
● Improve Customer service
● Crisis management through constant monitoring ● Sales Revenue
Literature Review
Kim and Hovy [1] proposed a system that automatically identifies the people who hold opinions about that topic and the sentiment of each opinion. Liu B [2,3] in his handbook provided basics of sentiment analysis and subjectivity (or opinion mining). Due to a wide variety of practical applications, it has been a very active research area in recent years. Pak and Paroubek[4] focused on using Twitter, the most popular micro blogging platform, for the task of sentiment analysis. Authors provided the mechanism that how to automatically collect a corpus for sentiment analysis
and opinion mining purposes. They perform linguistic analysis of the collected corpus and explain discovered phenomena. Using the corpus, they build a sentiment classifier that is able to determine positive, negative and neutral sentiments for a document. Experimental evaluations show that proposed techniques are efficient and perform better than previously proposed methods. Whitelaw et al. [8] used appraisal groups to propose sentiment classification. An appraisal group is represented as a set of attribute values in several task-independent semantic taxonomies, based on Appraisal Theory. Semi-automated methods were used to build a lexicon of appraising adjectives and their modifiers. Approach is implemented on movie reviews reported an accuracy of 90.2%. Similar other works [5,6,7] have been proposed by researchers in this field.
II. PROPOSED MODEL
The common approach suggests that positive words would get a +1 score and the negative words would get a -1 score, according to a file containing positive and negative words. This caused a problem in the sentences which contained oxymoron, a figure of speech in which apparently contradictory terms appear in conjunction.
(Fig.3) Example of oxymoron in a sentence
an overall negative meaning and the sentences starting with a negative word had an overall positive meaning.
(Fig.4) Negative and Positive
(Fig.5) Examples of Oxymoron with scores
III. METHODOLOGY
We started by creating a Twitter Application which provided us with various keys such as API key, API secret key, Access token and Access Token secret which allowed us to set up a connection between RStudio and the established API. A list of positive and negative words was compiled and stored in separate files. This was followed by fetching a given number of tweets of both, Donald Trump and Narendra Modi. For effective analysis, cleaning of the tweets was performed by removing punctuations, URLs, stop-words etc. After successful cleaning of data, we combined and converted the positive and negative word files into a dataframe with their corresponding values (i.e. -1 for negative and +1 for positive). In the sentence by sentence analysis, each word of the sentence was compared with the dataframe of positive and negative words to find a match. If a match is found, the corresponding value of the match would be added to the score variable for that particular sentence. If the score comes out to be 0 it means that an Oxymoron may or may not exist. The score is overwritten by the value of the current matched word and further evaluated through histograms and density-plot graphs.
(Fig.6) Circuit
IV. TECHNOLOGY USED
● Twitter Application ● R-Studio 1.0.153 ●
➢ TwitterR- an R package which provides access to the Twitter API. Most functionality of the API is supported, with a bias towards API calls that are more useful in data analysis as opposed to daily interaction.
➢ ROAuth- Provides an interface to the OAuth 1.0
specification allowing users to authenticate via OAuth to the server of their choice.
➢ Tm- A framework for text mining applications within R.
➢ Plotly- Easily translate 'ggplot2' graphs to an
interactive web-based version and/or create custom web-based visualizations directly from R. Once uploaded to a „plotly‟ account, „plotly‟ graphs (and the data behind them) can be viewed and modified in a web browser.
➢ Ggplot2- A system for 'declaratively' creating
graphics, based on "The Grammar of graphics". You provide the data, tell 'ggplot2' how to map variables to aesthetics, what graphical primitives to use, and it takes care of the details.
V. IMPLEMENTATION
● FETCHING OF TWEETS
A thousand tweets of Narendra Modi and Donald Trump each was fetched, through 'searchTwitter' in the 'twitteR' package.
● CLEANING OF DATA
The data was cleaned by first creating a corpus of the respective data frames. Stopwords, whitespaces, punctuations, and URLs were then removed. Conversion from upper to lowercase form was also performed.
which each positive word was assigned a +1 value and each negative word was assigned with a -1 value.
ii. Each word of the sentence was compared with all the words in the 'wordsDF' to find a match. When a match was found, the score of the current sentence was incremented by the corresponding value of the match. If the score comes out to be zero, then we conclude that oxymoron may or may not exist. If it exists then we add the value of the current match to the scoring.
VI. RESULTS
(Fig.7(a)) Hist. Of Narendra Modi before
(Fig.7(b)) Hist. Of Narendra Modi after
(Fig.8(a)) Histogram of Donald Trump before
(Fig.8(b)) Histogram of Donald Trump after
Before:
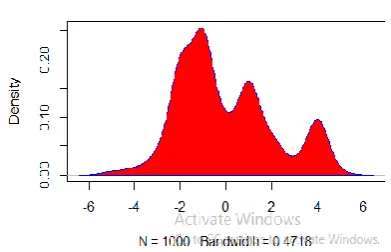
(Fig.9(a)) Density Plot of Narendra ModiAfter:
Figure 1(Fig.10(a)) Density Plot of Donald Trump
Fig.10(b)) Density Plot of Donald Trump
(Fig.11(a))Comparison without oxymoron
(Fig.11(b)) Comparison with oxymoron
The first two graphs (Fig.7(a) & 7(b)) represent the results obtained after the sentiment scoring of Narendra Modi tweets. Fig.7(a) shows the results obtained before the oxymoron logic was incorporated. After the incorporation of the logic, we get more accurate results shown in Fig. 7(b). The number of neutral sentences had an evident decrease in frequency, hence increasing the accuracy of the result. Similarly, the same was done with tweets of Donald Trump and results are shown in Fig. 8 (a) & 8(b).
The density plots in Fig.9(a) & 9(b) shows the result of sentiment scoring of Narendra Modi. From Fig.9(a) we can conclude that he had the highest number of neutral tweets. But, after the incorporation of oxymoron logic, we observe that the actual number of neutral tweets were much lower. Similar was the case with Donald Trump. The Fig.10(a) shows the representation of results before and Fig10(b) shows the results after the implementation of our proposed logic.
Fig11(a) shows a comparison between the results obtained from Tweets of Narendra Modi and Donald Trump before and Fig11(b) shows a comparison after the implementation of the proposed model.
VII. CONCLUSION
With the large amount of data driving business decisions, accuracy is imperative. Through our model, we were able to understand the nature of neutral sentences and categorize them as a singular positive or negative. This will lead to a better understanding of human language opinions and better processing of human thought by a machine.
There still exist a few challenges to overcome before sentiment analysis becomes a perfect mechanism. For example, differentiating sarcasm from sincere text or correctly analyze the specific contextual meaning of a word. Also, if the spelling is wrong the machine cannot identify that and therefore ignores it.
Use of acronyms or word abbreviations also has interpretation challenges. Furthermore, mixed opinions such as “I like the phone quality, but it is too expensive,” can be difficult to classify. It is also unlikely that an automated system could identify biased or fake reviews on a product or service.
REFERENCES
[image:4.595.326.550.64.196.2] [image:4.595.52.248.69.195.2][3] Liu B, Hu M, Cheng J (2005) Opinion observer: Analysing and comparing opinions on the web In: Proceedings of the 14th International Conference on World Wide Web, WWW ‟05, 342–351. ACM, New York, NY, USA.
[4] Pak A, Paroubek P (2010) Twitter as a corpus for sentiment analysis and opinion mining In: Proceedings of the Seventh conference on International Language
Resources and Evaluation. European Languages
Resources Association, Valletta, Malta.
[5] Pang B, Lee L (2004) A sentimental education:
Sentiment analysis using subjectivity summarization based on minimum cuts In Proceedings of the 42Nd Annual Meeting on Association for Computational
Linguistics, ACL ‟04. Association for Computational Linguistics, Stroudsburg, PA, USA.
[6] Pang B, Lee L (2008) Opinion mining and sentiment analysis. Found Trends Inf Retr2 (1-2): 1–135.
[7] Turney PD (2002) Thumbs up or thumbs down?:
Semantic orientation applied to unsupervised
classification of reviews In Proceedings of the 40th Annual Meeting on Association for Computational Linguistics, ACL ‟02, 417–424. Association for Computational Linguistics, Stroudsburg, PA, USA.
[8] Whitelaw C, Garg N, Argamon S (2005) Using appraisal