Available online:
http://edupediapublications.org/journals/index.php/IJR/
P a g e | 989Physicochemical Parameters Assessment and Seasonal
Variations of Surface Water Quality of the Volta Lake in
Ghana
Kingsley Kodom*
1, Afolayan Adedotun Onoyinka
2, Isabela Thomas Mkude
3, Solomon Ayeboafo Otu
1& Joy Okai Yeboah
11
Department of Applied Science, Radford University College, 83A Lagos Ave, Accra, Ghana
2Tissue Culture Section, Biotechnology Unit, National Centre for Genetic Resources and
Biotechnology, Moor Plantation, Ibadan, Nigeria.
3
Department of Environmental Studies, The Open University of Tanzania, Tanzania
*Corresponding author
:
kingkodom@gmail.com
;
kkodom@radforduc.edu.gh
Abstract:
Data for nine (9) physicochemical parameters (EC, SAL, ERes, Turb, pH, DO, TDS, Temp and % sat of DO) were investigated from 13 sampling locations of the Volta Lake, to assess the seasonal and spatial variations in surface water quality, using multivariate statistical techniques (PCA and EFA). The range of the assessed parameters were observed to have seasonal significant difference for EC (76.20 - 124.09 µS/cm), SAL (36.15 - 52.56 mg/L), ERes (10.0 - 16.44 KΩ.cm), Turb (0.44 - 13.98 NTU), pH (6.18-8.17), DO (3.22 - 6.90 mg/L), TDS (30.59 - 49.24 mg/L), Temp (23.6 - 32.9 °C) and % sat of DO (60.4 - 89.2 %), of which, pH, DO (% Sat), Temp and SAL were observed to be maximum, though marginal, in the Dry season. From the entire stretch of the lake, all the parameters recorded mean maximum values from the UVS, except for ERes (15.15 KΩ.cm) and Temp (31.8 °C), whose mean maximum values were respectfully recorded from the MVS and LVS. Conversely, the UVS recorded mean minimum values of pH (6.9), ERes (11.16 KΩ.cm) and Temp (26.6 °C) throughout the 2 seasons. But, that of SAL (37.7 mg/L), EC (82.91 µS/cm), TDS (33.18 mg/L) and Turb (4.91 NTU) were observed at the MVS (all in the Dry Season). For the LVS, DO (5.0 mg/L) and % sat of DO (74.3 %) were observed in the Dry season. The PCA/EFA showed both spatial and seasonal variations for the parameters at all the 13 sample locations. The seasonal correlations according to the PCA and EFA, slight changes were observed in the selection of the most significant parameters (EC, DO (% Sat), DO, SAL, TDS and ERes) responsible for seasonal variations of the Lake’s water quality based on a rotated factor correlation coefficient selection criterion. In view of this, seasonal variations of parameters must always be considered in water quality assessment when selecting parameters for environmental monitoring purposes in the reservoir because, parameters considered significant in contributing to water quality variations in a particular season may, or may not, be considered important in another season. Due to the unique biodiversity the reservoir supports, and the socioeconomic services it provides to thousands of
surrounding communities, extensive monitoring network throughout seasons should be encouraged since changes in land-use practices and climate variability can significantly affect the reservoir.
Keywords
Physicochemical parameters; Multivariate statistics; Seasonal variations; Surface water quality; Reservoir
1.
Introduction
About seventy-one percent (71%) of the Earth's surface is estimated to be covered with water. Likewise, about sixty percent (60%) of an average body of a human adult, is composed of water. This majority composition of water on Earth and in Humans, according to the WHO (WHO/UNEP, 2017), are the two major facts which illustrate critical linkage between water, health and ecosystems.
The quality of water, however, as stated by Lianthuamluaia et al. (2013), is the physical characteristics which influence the beneficial usage, in addition to ecosystem sustainability. And that, in any ecosystem, water quality is considered a key component with regards to available resources needed for life sustenance and in particular, suitability for human use. Water quality assessment and monitoring, therefore, provides significant information for managing water resources and further protecting the environment, since the resource is of critical importance to both natural ecosystem and human development.
Available online:
http://edupediapublications.org/journals/index.php/IJR/
P a g e | 990 and Patil (2008), Garg et al. (2009), Prabhakar et al.(2012), Saxena and Saksena (2012), are therefore used to ascertain the conservation and utilization of the resource, as well as, the general management for the purpose of fishing, irrigation and drinking or for other domestic and commercial use.
Aside anthropogenic activities, which affect the quality of freshwater resources (including rivers and lakes), seasonal variations driven by precipitation (mainly rainfall), surface runoff, groundwater flow and abstraction, also have significant effect on the concentration and accumulation of pollutants (Mahvi et al., 2005; Monavari and Guieysse, 2007; Khadka and Khanal, 2008; Mtethiwa et al., 2008 and Altaf et al., 2013) and as a result, affecting the surface water quality.
Variations in the quality of water bodies (especially far above or below acceptable levels) can be detrimental to fishes and humans, as well as, other ecosystems which depend heavily on them. And according to the UN, human beings are at the center of concern for sustainable development. However, over a billion people are globally
estimated to lack access to safe drinking-water supplies, which, together with other factors, results in the death of an estimated 1.7 million people every year (WHO, 2002). The worst of it all is, the projection by the Global Environment Outlook (GEO-2000) that, if the current global consumption patterns of existing water resources continue, two out of every three persons on the globe may be living in water-stressed conditions by the year 2025 (UNEP, 1999).
According to Sharifinia et al. (2013), surface water reservoirs, including lakes, are considered the most essential freshwater resources on the planet, and provides countless benefits in the ecosystem. The Volta Lake reservoir, however, serves the surrounding communities as a key source of water supply for domestic, irrigation and aquatic life (especially fish), as well as sustaining the ecology in and around the wetland by providing life for the ecosystems. The water of the reservoir is also used as a source of tourism, recreation and hydroelectric power generation (Akosombo Dam).
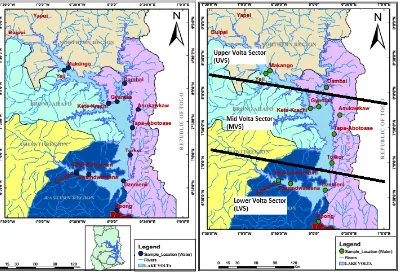
Figure 1. Study area showing sampling locations and sectors of the Lake Volta.
Since aquatic pollution is globally increasing significantly (WHO/UNEP, 1997), it is therefore of great necessity to assess and ascertain the quality of water of the Volta lake reservoir in order to provide scientific basis to propose or determine appropriate remedies to sustain human life, as well as, the aquatic ecosystem‟s biodiversity. In view of this, the study however, seeks to assess the seasonal variations of water quality of the
reservoir of the Lake Volta in Ghana by evaluating some selected physicochemical parameters.
2.
Materials and Methods
2.1 Study Area
Available online:
http://edupediapublications.org/journals/index.php/IJR/
P a g e | 991 398,000 km2 (153,800 sq. miles) and an average annualdischarge of 1,210 m3 (42,700 cubic feet) per second,
occupies about 28% of the total West Coast of West Africa and is shared by six West African countries, namely; Burkina Faso (42.07%), Ghana (40.21%), Togo (6.25%), Benin (3.62%), Cote d‟Ivoire (3.24%) and Mali (4.57%) (FAO, 1997; CSIR, 2006). This River system, therefore, ends its course by discharging into the Volta Lake reservoir (in Ghana).
After this magnificent River system was dammed to construct the Akosombo Dam (from 1961 - 1965), it resulted in the creation of the Volta Lake, which is considered the largest man-made lake in the world by surface area (Andah et al., 2003; Barry et al., 2005 and Ghansah et al., 2016), and the fourth largest by volume (ILEC, 2009; Ghansah et al., 2016).
The reservoir is completely located within Ghana between latitudes 9° 00′0″ N to 6° 00′0″ N and longitudes 1° 30′0″ W to 0° 30′0″ E (Fig. 1). It has a surface area of 8,502 km2 (3,283 sq. mi), which constitute 3.6 % of
Ghana‟s total land surface area. The storage capacity of
the reservoir (at full level) is estimated to be 148 km3 of
water, with an average and maximum depth of about 18.8 m and 75 m respectively, as well as, a shoreline of about 4,800 km (ILEC, 2009). The entire stretch of the Volta Lake is about 400 km (250 miles) long and 25 km (16 miles) wide, and extends upstream from the Akosombo Dam (southern part of Ghana) through to Yapei (northern part of Ghana).
2.2 Sampling and Analytical Procedures
2.2.1 Sampling
Water samples were collected to cover both the Dry season (from October 30, 2015 to December 22, 2015) and the Rainy season (April 20, 2016 to July 7, 2016) from selected fishing communities noted to be among the major landing sites for fishing from the Lake. For the purpose of this research, the entire area was divided into three sectors (Fig. 1); Lower Volta sector (LVS), Mid Volta sector (MVS), and Upper Volta sector (UVS).
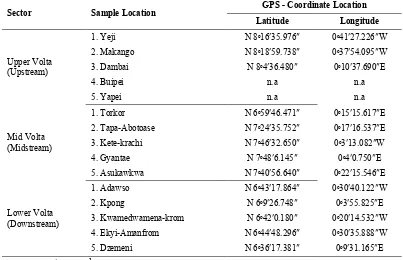
Table 1. Sampling locations (with Coordinates) from the Volta Lake
Sector Sample Location GPS - Coordinate Location
Latitude Longitude
Upper Volta (Upstream)
1. Yeji N 8ᵒ16′35.976″ 0ᵒ41′27.226″W 2. Makango N 8ᵒ18′59.738″ 0ᵒ37′54.095″W 3. Dambai N 8ᵒ4′36.480″ 0ᵒ10′37.690″E
4. Buipei n.a n.a
5. Yapei n.a n.a
Mid Volta (Midstream)
1. Torkor N 6ᵒ59′46.471″ 0ᵒ15′15.617″E 2. Tapa-Abotoase N 7ᵒ24′35.752″ 0ᵒ17′16.537″E 3. Kete-krachi N 7ᵒ46′32.650″ 0ᵒ3′13.082″W 4. Gyantae N 7ᵒ48′6.145″ 0ᵒ4′0.750″E 5. Asukawkwa N 7ᵒ40′56.640″ 0ᵒ22′15.546″E
Lower Volta (Downstream)
1. Adawso N 6ᵒ43′17.864″ 0ᵒ30′40.122″W
2. Kpong N 6ᵒ9′26.748″ 0ᵒ3′55.825″E
3. Kwamedwamena-krom N 6ᵒ42′0.180″ 0ᵒ20′14.532″W 4. Ekyi-Amanfrom N 6ᵒ44′48.296″ 0ᵒ30′35.888″W 5. Dzemeni N 6ᵒ36′17.381″ 0ᵒ9′31.165″E n.a – not accessed
Aside turbidity (Turb), all the chosen physicochemical parameters, which includes pH, Temperature (Temp), Electrical Conductivity (EC), Electrical Resistivity (ERes), Dissolved Oxygen (DO), percent saturation of Dissolved Oxygen (DO % Sat), Salinity (SAL), and Total Dissolved Solids (TDS), were determined in-situ, using the Oakton Waterproof PCD 650 Multi-parameter Handheld Meter, consisting of probes capable of simultaneously measuring and displaying results upon button-press. The Data-sets of these variables were, however, collected about 30-50 m away from the Lake-shore (with canoe-ride assistance
from local fisher-folks), and each variable was recorded twice to determine and record their average values.
Available online:
http://edupediapublications.org/journals/index.php/IJR/
P a g e | 992 °F) in order to keep the samples at almost similarconditions before collection. In all, data set of 13 water quality sampling sites with 9 physicochemical parameters were evaluated from 3 main sectors of the reservoir. From each sector, five (5) sampling locations (Table 1) were identified for sampling, except for the UVS, where Buipei and Yapei were not sampled due to road accident encountered by the research team on the field.
2.2.2 Analytical procedure
Prior to the in-situ determination of the parameters, the multi-parameter handheld device was calibrated to guarantee the highest accuracy in all measurement ranges. Readings were, therefore, taken by immersing the probes of the device directly into the surface water, and readings noted, after „stable' indication is observed on the LCD of the device.
Transporting water samples into the Lab for turbidity analysis is normally not recommended rather, to ensure highly accurate data, it is always necessary to do in-situ measurements. However, due to field equipment constraints throughout the study, the turbidity data were obtained from laboratory procedures. Nevertheless, all necessary efforts were made to ensure better results in the Lab, following standard procedures of APHA, (1992) for water and wastewater analysis. Colorimeter (HACH DR/890) which works with a principle of a UV spectrophotometer was employed to determine the entire turbidity data. Following the instructions recorded in the procedures manual of the manufacturer, measurements were done in duplicate runs for each sample taken at temperatures similar to as they were collected from the field (HACH, 2013). Using the Absorptometric method (according to the manufacturer), the results were recorded in Formazin Attenuation Units (FAU), which were converted to Nephelometric Turbidity Units (NTU) using the conversion factor as; 1 FAU=1 NTU=1 FTU (when measuring formazin).
2. 3 Statistical analysis
All the physicochemical data obtained from the two seasons (Dry and Rainy) were subjected to both
descriptive and multivariate statistical analysis. The mean, standard deviation (SD), the range, and standard error of the mean, amongst others, were descriptively evaluated. Likewise, using the coefficient of variation (CV), one-way analysis of variance (ANOVA) at 5 % level of significance and the paired-samples t-test, the spatial and temporal or seasonal variations of the observed water quality parameters were evaluated. Moreover, the Pearson correlation coefficient (r) was estimated to test the degree of relationship between the parameters. The Principal Component Analysis (PCA) and Exploratory Factor Analysis EFA) were evaluated for each season as part of the multivariate statistics, to obtain the latent factors or components responsible for water quality variations in each season. All statistical analyses were performed using IBM SPSS (v. 24.0), SigmaPlot (v. 13.0), and XLSTAT (v. 2017.1) software packages.
3.
Results and Discussions
3.1 Descriptive statistics of parameters
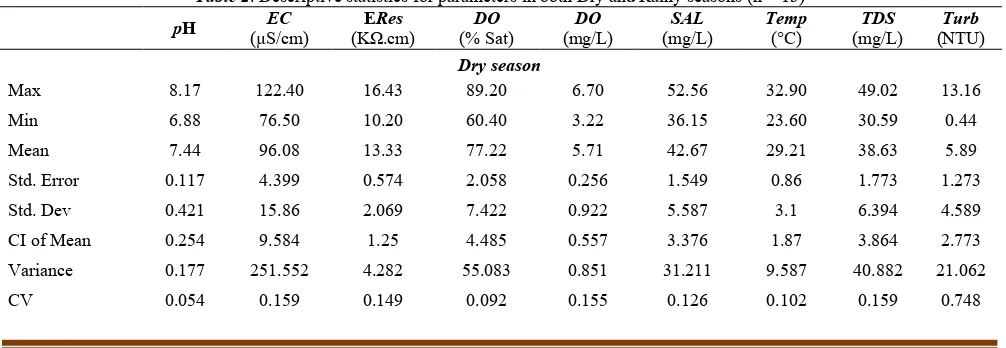
Descriptive statistics of the quantitative data for the 9 physicochemical parameters (pH, Temperature, Electrical Conductivity, Electrical Resistivity, Dissolved Oxygen, percent saturation of Dissolved Oxygen, Salinity, and Total Dissolved Solids) for the two seasons (Dry and Rainy) are summarized in Table 2. These include, but not limited to, seasonal range of variation (Max-Min), mean, Standard error of the mean (Std. Error), Standard Deviation (Std. Dev), Coefficient of Variation (CV), Variance (Var) and 95 % Confidence Interval (CI of Mean)
pH
The measured mean pH value of the surface water from the study sites entirely ranged (7.12 - 7.44), respectively representing (lowest - highest) values in the Rainy and the Dry seasons. This, clearly, indicates slightly an alkaline pH, which is similar to the work of Lianthuamluaia et al., 2013. This range of pH - values obtained can be considered to be
Table 2. Descriptive statistics for parameters in both Dry and Rainy seasons (n = 13)
pH (µS/cm)EC (KΩ.cm)ERes (% Sat) DO (mg/L)DO (mg/L)SAL Temp(°C) (mg/L)TDS (NTU)Turb
Dry season
Available online:
http://edupediapublications.org/journals/index.php/IJR/
P a g e | 993 Rainy seasonMax 8.12 124.09 16.44 89.00 6.90 52.08 32.80 49.24 13.98 Min 6.18 76.20 10.00 62.30 4.29 36.86 24.60 30.60 0.74 Mean 7.12 98.43 12.81 78.53 5.89 42.95 29.44 39.13 6.21 Std. Error 0.116 4.746 0.603 1.888 0.199 1.495 0.67 1.788 1.294 Std. Dev 0.419 17.111 2.174 6.807 0.718 5.391 2.4 6.448 4.666 CI of Mean 0.253 10.34 1.314 4.113 0.434 3.258 1.45 3.897 2.82 Variance 0.175 292.801 4.727 46.336 0.515 29.067 5.744 41.582 21.772 CV 0.057 0.167 0.163 0.083 0.117 0.121 0.078 0.158 0.722 potential of hydrogen (pH), Temperature (Temp), Electrical Conductivity (EC), Electrical Resistivity (ERes), Dissolved Oxygen (DO), percent saturation of Dissolved Oxygen (DO % Sat), Salinity (SAL), and Total Dissolved Solids (TDS)
within the international limits (6.5 - 8.5) set out for drinking and other domestic purposes (WHO, 1993), as well as, limits (6 - 9 ) set for protecting fish culture and the general aquatic life according to the EU (Chapman, 1996). However, considering the individual sampling sites, in the Dry season, the minimum (6.88) and the maximum (8.17) pH were respectively recorded at Kete-krachi and Ekyi-Amanfrom, located in the MVS and LVS respectively. Whereas, a respective minimum and maximum pH of 6.18 and 8.12 were also respectively recorded for the same sampling sites during the Rainy season. Therefore, the aquatic ecosystem, with regards to these two sampling sites, is not threatened based on the obtained pH-values. Neither is its usage for irrigation, recreational and domestic purposes are adversely also affected. From the paired-samples t-test, significant variation in pH, t (12) = 2.855, p < 0.05 (2-tailed) exists among the 2 seasons. The range of measure of relative variability (% CV = 5.66 % – 5.88 %) for the two seasons was statistically evaluated. This parameter, however, recorded the least range of variance (Var = 0.175-0.177) for both seasons, which indicates closely spread data around the mean value. There was, however, no strong positive correlation between pH and all the other observed parameters according to the correlation coefficient analysis. However, even though not strong enough, it showed some negative correlation with ERes, Temp, and Turb.
Electrical Conductivity (EC)
The highest (124.09 µS/cm) and lowest (76.20 µS/cm) mean EC values were both recorded in the Rainy season at respective locations of Adawso and Gyantae within the LVS and MVS of the reservoir respectfully. However, amongst the two seasons, variation in EC was distinctly evaluated with % CV ranging from 16.51 % - 17.38 %. The range of variability in variance (Var = 251.55 – 292.80) evaluate between the 2 - seasons also indicated varied data around the mean value. Using paired-samples t-test, the difference among seasons of the EC values was statistically significant, t (12) = -2.843, p < 0.05 (2-tailed). The higher values of the variable recorded in the Rainy season can, therefore, be attributed to the anthropogenic activities at the immediate surroundings of the Lake's
shore which include (but not limited to) runoff from farmlands and domestic waste, of which similar observations were made by Bhat et al. (2014).
Electrical Resistivity (ERes)
The mean surface water ERes values respectfully vary slightly from (12.81KΩ.cm) to (13.33 KΩ.cm) for both Dry and Rainy seasons. However, relatively wide variations were shown from the maximum (16.44 KΩ.cm) and minimum (10.00 KΩ.cm) values both recorded in the Rainy season at Gyantae and Ekyi-Amanfrom respectively. From the coefficient of variation (CV), the range of relative variability (% CV = 15.53 % – 16.97 %) was evaluated with respect to the two seasons. Likewise, with respect to the mean, the spread-out of the ERes data, around the mean, from the two seasons ranged from (Var = 4.28 - 4.73) which is relatively far lower than that of the EC parameter discussed above. With a significant value of (Sig. = .013, 2-tailed), the difference among seasons of the parameter is statistically considered significant, t (12) = 2.929, p < 0.05.
DO (% saturation) and DO (conc)
Available online:
http://edupediapublications.org/journals/index.php/IJR/
P a g e | 994 Moreover, no statistically significant difference amongseasons for DO (% sat) (t (12) = -1.386, p > 0.05) as well as, for DO (conc) (t (12) = -1.918, p > 0.05) were recorded considering their respective significance values of (Sig. = .191, 2-tailed) and (Sig. = .079, 2-tailed).
Salinity (SAL)
Considering all the 5 sampling locations, the highest (42.95 ±5.39 mg/L) and lowest (42.67 ±5.59 mg/L) mean salinity values were respectively recorded in the Rainy and the Dry season. However, seasonally, the maximum SAL value (52.08 mg/L) was recorded at Adawso (Lower Volta), whiles the minimum (36.86 mg/L) at Asukawkaw (Mid Volta) in the Rainy season. Similarly, in the Dry season, the maximum (52.56 mg/L) and the minimum (36.15 mg/L) values were respectively observed at Ekyi-Amanfrom (LVS) and Gyantae (MVS). The relative variability between seasons ranged from (CV = 12.55 % - 13.09 %) whereas, the range in variance (Var = 29.067-31.211) obtained among seasons estimates the general idea of the spread of the obtained data around the mean value. Furthermore, the difference among seasons of the obtained SAL values was statistically insignificant, (t (12) = -1.256, p > 0.05) given the significance value (Sig. = .233, 2-tailed).
Temperature (Temp)
Even though the highest temperature value (32.9 ºC) was recorded in the Dry season at Ekyi-Amanfrom (LVS), ironically, the mean maximum temperature value of (29.44 ± 2.40 ºC) was evaluated in the Rainy season whiles, a mean minimum values of (29.21 ± 3.10 ºC) was obtained in the Dry season. Seasonally, temperature showed some level of relative variability (CV= 8.14 – 10.60). However, spatially, the parameter showed distinct variation about the mean value within sampling points, with variance ranging from (Var = 5.74 - 9.59). This variability can be attributed to the fluctuation nature of surface water temp between day and night. However, for any highly substantial seasonal temp change to be observed, data have to be collected from the Lake over a longer period of time. According to RAMP, 1997, anthropogenic activities coupled with local conditions such as agriculture and forest harvesting can also be a factor. Again, temperature of water inputs such as precipitation, surface runoff and water from upstream tributaries cannot also be ignored. Water temperature may also vary along the length of streams, but then, depending on local conditions, there could also be variations between smaller sections few meters apart.
Based on the level of solar radiation penetration and mixing characteristics, the temperature of lakes can vary with depth. However, this effect can be ignored for the purpose of this study, since sampling was not done with depth.
All sampling sites downstream, for both seasons, recorded Temp values above 30ºC, with exception of Dzemeni (29.8 ºC) in the Dry season. There was, however,
no significant difference (p > 0.05) among seasons for Temp parameter.
Total Dissolved Solids (TDS)
The mean maximum (39.13 ± 6.45 mg/L) and minimum (38.63 ± 6.39 mg/L) values of TDS from all sampled locations within the study area, were respectively observed in the Rainy and Dry seasons. However, spatially, observations from specific locations recorded the highest TDS value (49.24 mg/L) in the Rainy season at Ekyi-Amanfrom (LVS) whereas, the least (30.59 mg/L) recorded in the Dry season at Gyantae (MVS). From the paired-samples t-test, highly significant difference (p < 0.05, 2-tailed) in TDS existed among the 2 seasons. These variations observed among the seasons, however, contributed to the range of relative variability (CV = 16.48 % - 16.55 %) evaluated with respect to the mean and SD. Likewise, with regards to the spread of data around the mean value between sampling locations, greater variation (Var = 41.58) was observed in the RS whiles in the DS (Var = 40.88) was relatively slightly reduced. The maximum value (49.24 mg/L) recorded is about ten times less than the upper limit value of 500 mg/L set by some international bodies (USEPA, USPHS, AWWA, BIS etc.) as recommended standards for drinking purposes, and about thousand times less than the upper limit set for freshwater bodies, but this is dependent on geologic and climatic factors (RAMP, 1997). It is observed that, all sampled sites in the upper sector of the Volta Lake recorded TDS values 40.00 mg/L but < 50.0 mg/L (similar to purified water) for both seasons. It is well noted that extremely high TDS can have a detrimental effect on the survival and reproduction rates of fishes (Fondriest, 2014). However, very low levels (below that of distilled or deionized water) can also cause cells of organisms to swell (Southard, 2006), affecting cell density balance of aquatic life.
Turbidity (Turb)
Available online:
http://edupediapublications.org/journals/index.php/IJR/
P a g e | 995 some locations within the entire study area may beattributed to several factors.
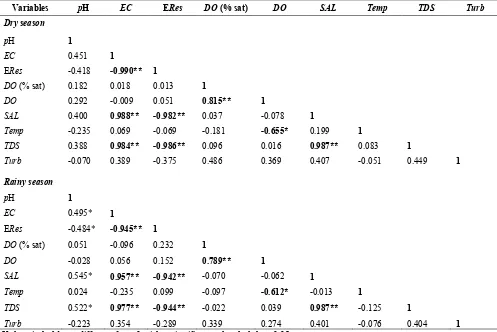
Table 3. Seasonal correlation matrix (Pearson) of water quality parameters from Volta Lake (n = 13)
Variables pH EC ERes DO (% sat) DO SAL Temp TDS Turb
Dry season
pH 1
EC 0.451 1
ERes -0.418 -0.990** 1
DO (% sat) 0.182 0.018 0.013 1
DO 0.292 -0.009 0.051 0.815** 1
SAL 0.400 0.988** -0.982** 0.037 -0.078 1
Temp -0.235 0.069 -0.069 -0.181 -0.655* 0.199 1
TDS 0.388 0.984** -0.986** 0.096 0.016 0.987** 0.083 1
Turb -0.070 0.389 -0.375 0.486 0.369 0.407 -0.051 0.449 1
Rainy season
pH 1
EC 0.495* 1
ERes -0.484* -0.945** 1
DO (% sat) 0.051 -0.096 0.232 1
DO -0.028 0.056 0.152 0.789** 1
SAL 0.545* 0.957** -0.942** -0.070 -0.062 1
Temp 0.024 -0.235 0.099 -0.097 -0.612* -0.013 1
TDS 0.522* 0.977** -0.944** -0.022 0.039 0.987** -0.125 1
Turb -0.223 0.354 -0.289 0.339 0.274 0.401 -0.076 0.404 1
Values in bold are different from 0 with a significance level alpha=0.05
**Correlation is significant at p < 0.01 level (2-tailed– Dry season; 1-tailed – Rainy season). *Correlation is significant at p < 0.05 level (2-tailed– Dry season; 1-tailed – Rainy season).
But the key among them could be the late time of sampling at those specific locations, during which the busy activities by local fishermen and traders at the landing sites are at its peak. Although it is ideal to sample at early mornings when there is little or no surface water disturbance, due to long-distance travel between sample locations, this may not be achieved for all of the sampled stations. Again, farming and other indiscriminate activities done close to the Lakeshore (especially in the Rainy season) may cause the loose top-soils to easily erode due to accelerated runoffs (facilitated by rainfalls) and may wash soil and other particulate matter (silt, clay, and organic materials) into the Lake, increasing the turbidity subsequently. For such locations, the effect of this high turbidity (if persistent) may cause sedimentation and siltation, of which the habitat for the fisheries and other aquatic life would be badly affected resulting in low productivity and loss of species.
3.2 Multivariate Statistics (PCA / EFA)
3.2.1 Seasonal correlation of parameters
As part of the PCA, the generated data in table 3 provide, a seasonal correlation matrix (Pearson product-moment, r) of all the water quality parameters analyzed. Also, table 4 is considered as a guide to describe the strength of correlation between the measurable variables (showing absolute values of r with boundaries).
Available online:
http://edupediapublications.org/journals/index.php/IJR/
P a g e | 996 The correlation coefficients between ERes and otherparameters fell below the absolute value of 0.40 (indicating weak to very weak correlations) except with SAL (-0.982) and TDS (-0.986) which both showed very strong negative correlation for all seasons. DO (% Sat) and DO (mg/L) demonstrated very strong positive
correlation (0.815) in the Dry season but the strength slightly reduced to strong correlation with the absolute value of the correlation coefficient given as 0.789 in the Rainy season.
Table 4. Suggested strength of correlation for absolute values of r (modified from Evans, 1996).
Absolute value of r Strength of correlation Description
1.00 perfect correlation Usually denotes is an extreme correlation valueperfect linear strength for self-paired data; r = ±1
0.80 ≤ r ≤ 1.00 very strong correlation Denotes very strong linear strength for paired data 0.60 ≤ r ≤ 0.79 strong correlation Paired variables display strong linear strength 0.40 ≤ r ≤ 0.59 moderate correlation Moderate linear strength for paired variables 0.20 ≤ r ≤ 0.39 weak correlation Paired variables show weak linear strength 0.00 ≤ r ≤ 0.19 very weak correlation Denotes very weak linear strength for paired data
0.00 no (linear) correlation Denotes an extremeno linear correlation value relationship between paired variables; r = 0 is r - Correlation coefficient
Constraints: -1.00 ≤ r ≤ +1.00
Closer the value is to 1 or –1, the stronger the linear correlation
Table 5. KMO - MSA test values classification (modified from Årestedt, 2013)
KMO Test Values Classification Description
< 0.50 Unacceptable Inadequate sample; may require further test 0.50 – 0.70 Poor but acceptable Moderate sample adequacy for Factor Analysis 0.70 – 0.90 Good Good sample adequacy for Factor Analysis > 0.90 Excellent Excellent sample adequacy for Factor Analysis Constraints: 0 < KMO < 1
Bartlett's Test of Sphericity (Sig. = .000; p < 0.05)
Table 6. Eigenvalues and the corresponding factors (PCA dimension) for the Dry and Rainy seasons
Factors F1 F2 F3 F4 F5 F6 F7 F8 F9
Dry season
Eigenvalue 4.374 2.390 1.213 0.691 0.276 0.042 0.007 0.006 0.000
Variability (%) 48.605 26.557 13.478 7.674 3.066 0.468 0.082 0.066 0.004 Cumulative % 48.605 75.162 88.640 96.314 99.380 99.848 99.930 99.996 100.000
Rainy season
Eigenvalue 4.341 2.217 1.134 0.981 0.221 0.058 0.028 0.015 0.004
Available online:
http://edupediapublications.org/journals/index.php/IJR/
P a g e | 997 Figure 2. Scree plots showing eigenvalues of PCs in Dry and Rainy seasonsInterestingly, DO (% Sat) exhibited very weak negative correlation with temperature for both Dry and Rainy seasons whereas, stronger correlation was expected. This is because, the concentration at 100 % saturation of DO for most lakes tend to decreases as temperature increases. However, DO (mg/L) showed strong negative correlation (-0.655) in the Dry season, as well as, (-0.612) in the Rainy season with temperature. The relatively higher correlation in the Dry season (though marginal) could be ascribed to seasonal variations; as in the Dry season (warmer temperatures), the rates of photosynthesis and decomposition tends to speed-up than in the Rainy season. According to Michaud (1991), other seasonal events, such as changes in lake water levels, the volume of inflows and outflows, and presence of ice-cover, can also cause natural variation in DO concentrations. Contrariwise, the relatively feeble correlation of DO (% Sat) with temperature in the study could be due to the fact that, temperature itself revealed a very weak correlation with all parameters (except for DO) for both seasons (Table 3).
Salinity had a very strong positive increase in correlation with TDS (0.987) for both seasons but failed to have any relatively higher correlation with other parameters, except for turbidity (0.407) which produced a moderate correlation. With the exception of EC, ERes and SAL, for all seasons, the TDS showed very weak to weak correlation with all parameters.
Although turbidity, according to the correlation matrix, recorded moderate positive correlation with DO (% Sat), SAL and TDS in the Dry season, such pattern slightly changed in the Rainy season, as it showed moderate positive correlation with only SAL and TDS. Therefore, having correlation strength ranging from very weak to weak, with the other parameters.
3.2.2 Temporal correlation of parameters
Due to the complex relationships obtained between variables in the seasonal correlation matrix discussed above, it becomes difficult to draw clear conclusions, as to which parameters are significant for seasonal variation of the measured water quality parameters. Therefore, the need for principal component analysis (PCA) to explain the relationships among numerous important variables with a smaller set of independent variables, and consequently, retain the most important factors and physicochemical parameters affecting the water quality using exploratory factor analysis (EFA).
Available online:
http://edupediapublications.org/journals/index.php/IJR/
P a g e | 998 variables hence, further confirming the KMO test that, thedata-set from the study are suitable for PCA/EFA.
The eigenvalues generated from the PCA (Table 6) were used to determine the number of principal components (PCs) that can be retained for further and
clear analysis. Considering, therefore, the eigenvalues obtained from the PCA for the two seasons, it is quite obvious to notice from the scree plot (Fig. 2) that, there exists a distinct slope change after the third eigenvalue.
Table 7. Factor Loadings showing correlation matrix between variables and factors
Variable F1 F2 F3 F1 F2 F3
Dry Season Rainy Season
pH 0.484 0.253 -0.676 0.573 -0.141 -0.604 EC (µS/cm) 0.985 -0.114 -0.065 0.981 0.038 -0.026 ERes (KΩ.cm) -0.977 0.147 0.061 -0.961 0.156 -0.024 DO (% Sat) 0.155 0.827 0.318 -0.070 0.825 0.015 DO (mg/L) 0.087 0.977 -0.050 0.002 0.961 -0.212 SAL (ppm) 0.981 -0.174 0.034 0.986 -0.055 0.086 Temp (°C) 0.056 -0.668 0.476 -0.141 -0.579 0.411 TDS (ppm) 0.987 -0.076 0.029 0.991 0.039 0.040 Turb (NTU) 0.493 0.413 0.645 0.383 0.477 0.738
Figure 3. Correlation circle projecting variables in factor space (for Dry and Rainy season)
Hence, for further analysis, these first three PCs whose eigenvalues are greater than one (>1) were selected. This, is in accordance with Liang and Yu (2000); Liu et al. (2003); Shrestha and Kazama (2007); Pejman et al. (2009); Lianthuamluaia et al. (2013); Bhat et al. (2014); Finkler et al. (2016) and Köse et al. (2016), who have indicated that, any factor with an eigenvalue greater than one (>1) is considered significant for further analysis.
It, however, implies that, the nine studied physicochemical parameters are reduced to three main
Available online:
http://edupediapublications.org/journals/index.php/IJR/
P a g e | 999 eigenvalues of less than one and were consideredinsignificant hence their rejection.
A correlation matrix of these variables was computed amongst themselves, and factor component or loadings (Table 7) were defined to explore the nature of variations and principal patterns, which is in accordance with the work of Aruga et al. (1993) and Bhat et al. (2014). These component loadings are the linear combinations for each PC and they express the correlation between the original variables and the newly formed components. Moreover, they are just considered as projections of the original variables on the subspace of the PCs which in effect, coincides with the correlation coefficients between the PCs and variables. These component loadings, according to Ouyang et al., (2006), can be used to determine the relative importance of variables (or study parameters) as compared to other variables in a PC and do not reflect the importance of the component itself.
For further analysis, out of the three retained PCs, the correlation circle (Fig. 3) present component or factor loadings for only the first two for each season. On the two PCA axis (F1 and F2), two-dimensional charts are represented. Both axes (F1 and F2) carry 75.16 % and 72.88 % of the information from the initial data-set of the Dry season and Rainy season respectively.
In the Dry season, the principal component 1 (PC1) explained 48.61% of the total variance and was positively and largely contributed by TDS, EC, and SAL, whiles negatively affected by ERes parameter. Therefore, the measured ERes decreases with increasing TDS, EC and SAL and vice versa. This component (PC1), according to the correlation circle (Fig. 3) further reveals that, in the Dry season, pH and turbidity (though positively linked) were comparatively less important with regards to water quality variations since their loading coefficients were low. However, since they produce shorter vector lengths on both PCA dimensions (axis F1 and F2), their information are not very well represented (Fig. 3). Instead, they are mostly associated with the third principal component (PC3) which is not represented in this 2-D plot. The PC2 on the other hand, explained 26.56 % of the total variance and was positively contributed to, by DO
and DO (% sat) whiles, negatively affected by temperature parameter (Fig. 3).
The Rainy season also showed similar component loading pattern for PC1 (explained 48.24 % of total variance) and PC2 (explained 24.64 % of total variance) as in the Dry season, except that pH (though not well represented on this PCA axis) is observed to be positively linked to TDS, EC, and SAL, even though slight changes occur between their positions (or angles) with respect to the PCA dimensions or axis (Fig. 3). Unlike in the Dry season, very narrow angles existed between EC and TDS variables in the Rainy season, which implied very high positively linked parameters (mutual correlation). Also, turbidity (with shorter vector length) was observed to show no significant linkage between any of the investigated variables in the correlation circle, hence its rejection as an important parameter with regards to water quality variations in the Rainy season.
3.3. Significant Seasonal Variables
Since figure 3 showed PCs (for the two seasons) highly influenced (either negatively or positively) by most of the variables, further analysis needs to be done to clearly identify which parameters mostly or significantly influence the water quality variations within a particular season. Therefore, the principal factor analysis (PFA) was executed to identify the parameters which are significantly important for seasonal variation.
After the Varimax rotation, table 8 presents the rotated correlation coefficient data for the first two varifactors (VF1 and VF2) in each season. This account for the total variances of approximately 71.27 % in the Dry season and 70.61% in the Rainy season. For the purpose this study, as shown in table 9 and in accordance with factor loading classification of Liu et al. (2003) and Singh et al. (2004), any water quality parameter with an absolute correlation coefficient value > 0.75 is considered to have strong factor loading and in effect, selected as a significant parameter contributing to seasonal variations (Table 10).
Largely, strong positive loadings were observed in EC, DO, and TDS whereas, ERes demonstrated
Table 8. Correlations between variables and factors after Varimax rotation
Variable
Dry season Rainy season
VF1 VF2 VF1 VF2
pH 0.408 0.205 0.479 -0.026
EC 0.987 -0.019 0.970 0.117
ERes -0.979 0.050 -0.953 0.082 DO (% Sat) 0.076 0.648 -0.135 0.848
DO 0.000 0.842 -0.067 0.973
SAL 0.987 -0.070 0.976 0.020
Temp 0.092 -0.439 -0.100 -0.570
TDS 0.983 0.016 0.977 0.117
Available online:
http://edupediapublications.org/journals/index.php/IJR/
P a g e | 1000Variance (%) 47.93 23.34 46.975 23.639
Cumulative (%) 47.930 71.273 46.975 70.614
VF - Varifactor
Table 9. Classification of factor loading (modified from Liu et al., 2003; Singh et al., 2004)
Absolute loading Values Classification of factor loading Explanation
> 0.75 Strong Depicting strong variable and factor relationship
0.75-0.50 Moderate Showing moderate correlation between variables and factors.
0.50-0.30 Weak Depicting variables and factors weak relationship between
Table 10. Selected significant variables contributing to seasonal variations
Season Correlated parameters
Strong Positive Loading Strong Negative Loading Dry EC, DO, SAL and TDS ERes
Rainy EC, DO (% Sat), DO, SAL
and TDS ERes
Selection criterion: Factor correlation coefficients > 75 %
strong negative loadings for both VF1 and VF2 in the Dry season. A similar pattern of loadings was observed in the Rainy season for both factors, except for the addition of DO (% Sat) as a strong positive factor loading. Therefore, from the study, it is clearly shown that throughout the seasons of the year, EC, DO (% Sat), DO, SAL, TDS and ERes are the selected parameters which are significant to water quality variations. Interestingly, these selected parameters remain unchanged, if parameters were selected with factor correlation coefficients greater than 95 % (> 0.95), as was used as a selection criterion by Ouyang et al. (2006).
However, since the selected results were not entirely the same for the two seasons, similar conclusions from Ouyang et al. (2006); Pejman et al. (2009) and Lianthuamluaia et al. (2013) can be drawn with regards to this study that; parameters considered important in contributing to water quality variations in a particular
season may not be considered important in another season. Moreover, since the selection criteria slightly change the outcome, it can be reported from this study that, physicochemical parameters considered important in contributing to water quality variations in a particular season may or may not be considered important in another season based on the rotated factor correlation coefficient selection criterion.
Available online:
http://edupediapublications.org/journals/index.php/IJR/
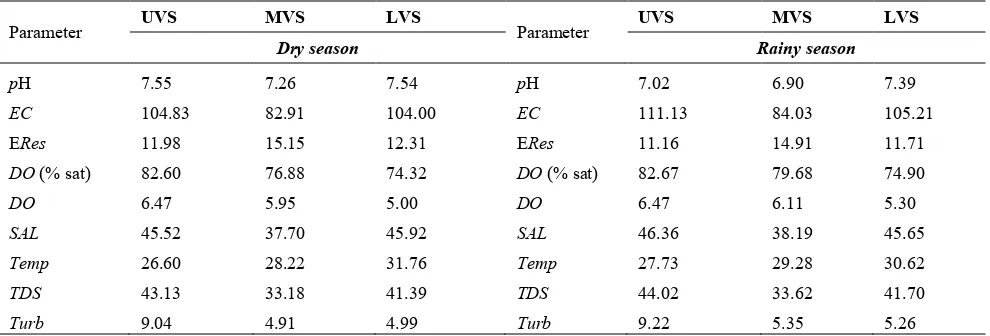
P a g e | 1001 Figure 4. Observations chart and Biplot respectfully showing active observations and variables on 2-D mapTable 11. Mean Physicochemical parameters for Upper, Mid and Lower Volta
Parameter UVS MVS LVS Parameter UVS MVS LVS
Dry season Rainy season
pH 7.55 7.26 7.54 pH 7.02 6.90 7.39
EC 104.83 82.91 104.00 EC 111.13 84.03 105.21
ERes 11.98 15.15 12.31 ERes 11.16 14.91 11.71
DO (% sat) 82.60 76.88 74.32 DO (% sat) 82.67 79.68 74.90
DO 6.47 5.95 5.00 DO 6.47 6.11 5.30
SAL 45.52 37.70 45.92 SAL 46.36 38.19 45.65
Temp 26.60 28.22 31.76 Temp 27.73 29.28 30.62
TDS 43.13 33.18 41.39 TDS 44.02 33.62 41.70
Turb 9.04 4.91 4.99 Turb 9.22 5.35 5.26
DO (% sat)-percent saturation of dissolved oxygen
observed seasonally.
Even though the EFA subsequently done, was intended to further reduce the selected parameters which contribute to seasonal variations, as in the case of Pejman et al. (2009) and Ouyang et al. (2006), nonetheless, not much difference was shown compared to the PCA with reference to the two seasons. Rather, the VFs obtained from the PCs according to the EFA indicated confirmation of the selected parameters responsible for water quality variations. This indifference could be attributed to the relatively less number of physicochemical parameters initially analyzed in this study compared to the works of Pejman et al. (2009) and Ouyang et al. (2006).
Similarly, the observations chart (Fig. 4), developed from PC1 and PC2, display all sampling sites on a two-dimensional map which in effect, may identify trends or substantiate any clustering of samples from specific sampling location (site). Thus, with regards to the factors, sampling sites that are clustered or grouped near each other have similar characteristics. It, however, depicts
spatial distribution, as well as, a mutual correlation between sampled locations. Likewise, the correlation Biplot (Fig. 4), simultaneously relate the similarities between sampled locations to the measured parameters in PCA space. In other words, it is the combination of the correlation circle and the observations chart represented in a new space on a two- dimensional map. It is observed that, in the Dry season, Ekyi-Amanfrom and Adawso are linked with a high increase in the concentration of EC, SAL and TDS whereas, Gyantae and Tapa-Abotoase are associated with a high negative increase in ERes. However, Kpong is associated with high negative temperature increase whiles Asukawkaw and Yeji were noted to have positive increase concentration of DO and DO (% sat). A similar trend is depicted in the Rainy season except that, the negatively high increasing ERes is related to Gyantae, Torkor and Dzemeni on the PC1 dimension.
Available online:
http://edupediapublications.org/journals/index.php/IJR/
P a g e | 1002 3.4.1 DO, DO (% sat), SAL, TDS, EC and EResOxygen, generally, is vital to both aquatic and terrestrial life, and when it dissolves in water, it becomes a key component with regards to the existence of most aquatic organisms. Moreover, in an aquatic environment, the concentration of dissolved oxygen (DO) is always an essential indicator of water quality. Interestingly, the level of DO in water is biologically considered as an essential measure of water quality, than even faecal coliform content (Lenntech, 2017). And according to Wetzel (2001), with the exception of water itself, the parameter is noted as the most essential factor with regards to the study of lakes and other freshwater or inland water bodies.
Even though the diversity of organisms in water is greatest at higher DO concentrations, DO levels, when too high (> 15 mg/L) or too low (< 3 mg/L), can be very detrimental to aquatic life and subsequently affect the quality of water (Fondriest, 2014) hence, for good water quality, adequate DO is required.
The mean DO concentration level recorded for the entire stretch of the Lake (Upper, Mid and Lower) ranged from (5.00 - 6.47) mg/L at 31.8 °C – 26.6 °C Temp, and (5.30 - 6.47) mg/L at 30.6 °C – 27.7 °C Temp for both Dry and Rainy seasons respectively. These mean values are within the required range (4 - 6.5 mg/L), for many freshwater fishes (especially, for adult salmonids) considered for optimum growth and survival (EPA, 2012; Fondriest, 2014). The mean DO (% Sat), on the other hand, ranged from 74.3 – 82.6 % in the Dry season. This, slightly increased in the Rainy season to a range of 74.9 – 82.7 %, with both seasons recording maximum and minimum percent saturation at the Lower Volta and Upper Volta respectively. Therefore, the surface water quality for the entire study area is within the acceptable (60 - 79%) and adequate (80 - 89%) percent saturation level of DO.
Even though none of the sampled locations recorded values at supersaturated levels (i.e. % sat of DO ≥ 101 %) as well as, poor levels (i.e. % saturation of DO < 60 %), Kpong (at LVS) recorded 60.4 % and 62.3 % of DO respectively in the Dry and Rainy seasons. These relatively low values (close to poor water quality level) could be attributed to the large growth of aquatic plants (such as algae and phytoplankton) observed at the water surface. However, the death of an appreciable number of these aquatic plants makes use of large quantities of DO, since microbes in the water responsible for decomposing the organic matter will, eventually, consume large oxygen concentration (NASA, 2010; Sallenave, 2011; Fondriest, 2014 and Oram, 2014). This, moreover, gives much meaning to the high-temperature values recorded at this same sampling site, since the solubility of oxygen generally decreases as temperature increases (Wetzel, 2001).
3.4.2 SAL, TDS, EC and ERes
From the three classified sectors of the Lake (UVS, MVS & LVS), the mean values of EC, SAL and TDS
respectively ranged from (82.91 - 104.83 µS/cm), (37.70 - 45.52 mg/L) and (33.18 - 43.13 mg/L) in the Dry season, as well as, (84.03 - 111.13 µS/cm), (38.19 - 46.36 mg/L) and (33.62 - 44.02 mg/L) in the Rainy season. Though these mean values are generally low, their slight increase in the Rainy season and the high variability in the EC, could be attributed to contaminants from agricultural runoffs (from surrounding farmlands), surrounding soils (especially Clayed) and sediments, as well as, possible untreated sewage leakages and anoxic discharges which could be facilitated into the water body due to the accelerated rainfalls. These runoffs, generally constitute high nutrients (Perlman, 2014), extra chloride, phosphate, nitrate and other ions with high dissolved solids (salts) concentration capable of influencing the EC which will eventually have an impact on water quality and aquatic life.
The mean Electrical Resistivity (ERes) from the study, however, ranged from (11.98 - 15.15 KΩ.cm) and (11.16 - 14.91 KΩ.cm) respectively in the Dry and Rainy season. Even though the maximum mean values for ERes were obtained at the MVS (for both seasons), the mean minimum values were basically observed to have a strong inverse relationship with that of the EC (Table 11). The ERes parameter is however affected by almost the same factors as that of the EC due to their reciprocal definition. Hence, a high concentration of dissolved salts (calcium, sodium, potassium, chloride, and magnesium) introduced into the surface water (by any means) will record low ERes values, and vice versa.
4.
Conclusions
The study successfully assessed the surface water quality, as well as, the spatial and seasonal or temporal variability between measured parameters of the Volta Lake using both descriptive and multivariate statistics (PCA and EFA).
Available online:
http://edupediapublications.org/journals/index.php/IJR/
P a g e | 1003 located at the northern part of the Lake (around Buipe,Aveme and part of Krachi District).
According to the observations chart and the correlation circle charts (PCA/FA), sampled locations, together with all the analyzed parameters also showed significant spatiotemporal variability. The EFA results revealed a confirmation from the PCA that, out of the nine investigated physicochemical parameters, in the Dry season, EC, DO (% Sat), DO, SAL, TDS and ERes were considered most significant parameters which always contribute to water quality variations in the Volta Lake whiles EC, DO, SAL, TDS and ERes were considered for the Rainy seasons. Therefore, based on a correlation coefficient selection criterion, the physicochemical parameters considered important in contributing to water quality variations in a particular season may or may not be considered important in another season. Hence, this may serve as a reference-point information (RPI), vital for the management of the reservoir in finding out which parameters need to be monitored in different seasons to save time and cost.
The Volta Lake (as a Ramsar site) is a major and an important source for sustaining aquatic life and ecosystems biodiversity, as well as, directly providing domestic, agricultural, and industrial services for over 1,232 fishing villages (MOFA, 2003) including over 300, 000 fisher-folk‟s livelihood dependence (Braimah, 1995, 2003). Therefore, Water Quality Standards Act (WQSA) requiring minimum concentrations of key physicochemical parameters (such as DO) need to be instituted in order to manage the influence of factors such as land-use and climate change.
Since its construction, the nutrient level of the reservoir has generally been reported by many earlier researchers including Biswas (1966a); Obeng-Asamoah (1984); Antwi (1990) and Ofori-Danson and Ntow (2005) as very low. The study by Antwi (1990), however, attributed this to the naturally poor nutrient catchment area and the low solubility of the Precambrian granites located in the upper catchment (Zwieten et al., 2011). However, from the outcome of this work, seasonal variation of parameters must also be considered in future studies to give the true picture of the variability of nutrient or physicochemical parameters level of the Lake.
5.
Acknowledgements
This work was supported by a collaborative research grant from the International Foundation for Science (IFS), Sweden. The authors also wish to acknowledge the Applied Science Department of Radford University College, Ghana and the Department of Marine and Fisheries Sciences of University of Ghana, as well as, the Environmental Studies Department of The Open University of Tanzania, and the Tissue Culture Section, Biotechnology Unit, National Centre for Genetic Resources and Biotechnology, Moor Plantation, Ibadan,
Nigeria, for the provision of laboratory space and logistics support.
6.
References
[1]. WHO-UNEP, “Water, health and ecosystems”, The WHO-UNEP Health and Environment Linkages Initiative (HELI): Review of initial findings, 2017.
Available at:
http://www.who.int/heli/risks/water/water/en/
[2]. Lianthuamluaia, Asha, T. Langde, C. S., Purushothaman, Geetanjali Deshmukhe and Karankumar K. Ramteke, “Assessment of seasonal variations of water quality parameters of Savitri reservoir, Poladpur, Raigad district, Maharashtra”,
The Bioscan 8(4), 2013, pp. 1337-1342.
[3]. Pejman, A. H., Bidhendi, G. R. N., Karbassi, A. R., Mehrdadi, N. and Bidhendi, M. E., “Evaluation of spatial and seasonal variations in surface water quality using multivariate statistical techniques”, Int.
J. Environ. Sci. Tech. 6 (3), 2009, pp. 467-476.
[4]. Ahamed, M. and Krishnamurthy, R., “Hydrobiological Studies of Wohar reservoir Aurangabad, (Maharashtra State) India”, J.
Envoiron. Biol. 11, 1990, pp. 335-345.
[5]. Chavan, R. J., Sawat, R. J., Himara, C. J. and Tat, M. B., “Studies on water quality of Manjara Project reservoir in dist. Beed, Maharashtra”, J.
Aqua. Biol. 19, 2004, pp. 73-76.
[6]. Kirubavathy, A. K., Binukumari, S., Mariamma, N. and Rajammal, T., “Assessment of water quality of Orathupalayam reservoir, Erode district, Tamil
Nadu”, J. Ecophysiol. Occup. Hlth. 5, 2005, pp.
53-54.
[7]. Surve, P. R., Ambore, N. E. and Pulle, J. S., “Hydrobiological studies of Kandhar dam water, district Nanded (M.S.)”, India. J. Ecophysiol. Occup.
Hlth. 5, pp. 61-63.
[8]. Garg, R. K., Saksena, D. N. and Rao, R. J., “Assessment of physico-chemical water quality of Harsi reservoir, district Gwalior, Madhya Pradesh”,
Available online:
http://edupediapublications.org/journals/index.php/IJR/
P a g e | 1004 [9]. Mustapha, M. K., “Assessment of the WaterQuality of Oyun Reservoir, Offa, Nigeria, Using Selected Physico-Chemical Parameters”, Turk. J.
Fish. Aquat. Sci. 8, 2008, pp. 309-319.
[10]. Narayana, J., Puttain E. T. and Basavaraja, D. “Water quality characteristics of Anjanapura reservoir near Shikaripur, district Shimoga,
Karnataka”. J. Aqua. Biol. 23, 2008, pp. 59-63.
[11]. Gonjari, G. R. and Patil, R. B., “Hydrobiological studies on Triputi reservoir near
Satara, Maharashtra”, J. Aquat. Biol. 23, 2008, pp.
73-77
[12]. Garg, R. K., Rao, R. J. and Saksena, D. N., “Water quality and conservation management of Ramsagar reservoir, Datia, Madhya Pradesh”, J.
Environ. Biol. 30, 2009, pp. 909-916.
[13]. Prabhakar, C., Saleshrani, K., Tharmaraj, K. and Kumar, V. M., “Seasonal variation in hydrological parameters of Krishnagiri dam, Krishnagiri district, Tamil Nadu, India”, Int. J.
Pharm. Biol. Arch. 3, 2012, pp. 134-139.
[14]. Saxena, M. and Saksena, D. N., “Water quality and trophic status of Raipur reservoir in Gwalior,
Madhya Pradesh”, J. Nat. Sci. Res., 2, 2012, pp.
82-96.
[15]. Mahvi, A. H.; Nouri, J.; Babaei, A. A.; Nabizadeh, R., “Agricultural activities impact on groundwater nitrate pollution”, Int. J. Environ. Sci.
Tech., 2 (1), 2005, pp. 41-47.
[16]. Monavari S. and Guieysse B., “Development of water quality test kit based on substrate utilization and toxicity resistance in river microbial
communities,” Int. J. of Environ. Res., 1 (2), 2007,
pp. 136–142.
[17]. Khadka R. B. and Khanal A. B., “Environmental management plan (EMP) for melamchi water supply project, Nepal,” Int. J. of
Environ. Res., 2 (1), 2008, pp. 87–96.
[18]. Mtethiwa A. H., Munyenyembe A., Jere v, and Nyali E., “Efficiency of oxidation ponds in
wastewater treatment,” Int. J. of Environ. Res., vol. 2
(2), 2008, pp. 149–152.
[19]. Altaf F., Meraj G., and Romshoo S. A., “Morphometric Analysis to Infer Hydrological B ehaviour of Lidder Watershed, Western Himalaya,
India,” Geography Journal, vol. 2013, 2013. Article
ID 178021.
[20]. WHO. “The World Health Report 2002: Reducing Risks, Promoting Healthy Life”, Geneva, World Health Organization, 2002.
[21]. UNEP, “The state of the environment; freshwater”, GEO-2000: Global Environment Outlook, United Nations Environment Programme, Nairobi, 1999.
[22]. Sharifinia M., Ramezanpour Z., Imanpour.J., Mahmoudifard A., and Rahmani T., “Water quality assessment of the Zarivar Lake using physico-chemical parameters and NSF-WQI indicator, Kurdistan Province-Iran”, Int J. of Adv. Biol. and
Biom. Res.; 1(3), 2013, pp. 302-312. Online:
http://www.ijabbr.com
[23]. WHO/UNEP, “Water Pollution Control - A Guide to the Use of Water Quality Management Principles”; Edited by Richard Helmer and Ivanildo Hespanhol on behalf of the UNEP, Water Supply &
Sanitation Collaborative Council and the WHO. 1st
Ed., E. & F. Spon publications, UK, 1997, pp. 1-459.
ISBN 0 419 22910 8. Source:
http://www.who.int/water_sanitation_health/resourc esquality/watpolcontrol.pdf
[24]. FAO, “Irrigation potential in Africa: A basin
approach”, FAO Land and Water Development
Division. FAO LAND AND WATER BULLETIN 4,
1997, ISBN 92-5-103966-6. Online:
http://www.fao.org/docrep/W4347E/w4347e0u.htmv
[25]. CSIR, “Review Of Volta Lake Fisheries”, Development Actions (Draft), CSIR Water Research Institute, Ghana, CPWF-PN 34 PROJECT TEAM, 2006, June, pp. 1-37.
[26]. Andah, Winston E.I., Nick van de Giesen, and Charles A Biney, "Water, Climate, Food, and Environment in the Volta Basin." Contribution to the project ADAPT - Adaptation strategies to changing
environments, 2003. Available at;
Available online:
http://edupediapublications.org/journals/index.php/IJR/
P a g e | 1005 [27]. Barry, B., Obuobie, E., Andreini, M., Andah,W. & Pluquet, M.., “The Volta River Basin: comparative study of river basin development and
management”, Draft report. Comprehensive
Assessment of Water Management in Agriculture and International Water Management Institute (IWMI), 2005.
[28]. Ghansah, B., Asare, Y. M., Tchao, E. T. and Forkuo, E. K., “Mapping the spatial changes in Lake
Volta using multitemporal remote sensing
approach”, Lakes Reserv Res Manage, 21, 2016, pp.
206–215. doi:10.1111/lre.12138
[29]. ILEC, International Lake Environment Committee, “VOLTA LAKE”. Promoting Sustainable Management of the World's Lakes and Reservoirs,
2009, May. Online:
https://web.archive.org/web/20090506103815/http:// www.ilec.or.jp/database/afr/afr-16.html
[30]. APHA-American Public Health
Association,“Standard methods for the examination
of water and wastewater”. 18th ed. American Public
Health Association, Washington, DC, 1992.
[31]. APHA-American Public Health Association. “Standard Methods for the Examination for Water and Wastewater”- 19th edition, Byrd Prepress Springfield, Washington, DC, 1995.
[32]. HACH, “DR/890 Colorimeter Procedures Manual- 48470-22”. HACH Company, U.S.A, te/dk 03/13 10ed, 2013.
[33]. WHO, “Guidelines for drinking water quality”,
2nd Ed., 1993. World Health Organization, Geneva.
[34]. Chapman D. V., “Water Quality Assessments - A Guide to Use of Biota, Sediments and Water in
Environmental Monitoring”, 2nd Ed., E&FN Spon,
London UK Published on Behalf of
UNESCO/WHO/UNEP, 1996, 651 pages
[35]. Bhat S. A., Meraj G., Yaseen S., and Ashok K. Pandit, “Statistical Assessment of Water Quality Parameters for Pollution Source Identification in Sukhnag Stream: An Inflow Stream of Lake Wular (Ramsar Site), Kashmir Himalaya,” Journal of
Ecosystems, vol. 2014, Article ID 898054, 2014, pp.
1-18, doi:10.1155/2014/898054
[36]. RAMP, 1997. Water Quality Indicators: Temperature and Dissolved Oxygen. The Regional
Aquatics Monitoring Program (RAMP)
http://www.ramp-alberta.org/river/water+sediment+quality/chemical/t emperature+and+dissolved+oxygen.aspx
[37]. Fondriest “Conductivity, Salinity and Total Dissolved Solids.” Fundamentals of Environmental Measurements. Fondriest Environmental, Inc., 3
Mar 2014. Online:
http://www.fondriest.com/environmental-
measurements/parameters/water-quality/conductivity-salinity-tds/
[38]. Southard, J., “Introduction to Fluid Motions,
Sediment Transport, and Current-Generated
Sedimentary Structures”, Course Textbook. In MIT Open Courseware: Massachusetts Institute of
Technology, 2006. Online:
http://ocw.mit.edu/courses/earth-atmospheric-and- planetary-sciences/12-090-introduction-to-fluid- motions-sediment-transport-and-current-generated-sedimentary-structures-fall-2006.
[39]. Evans, J. D., “Straightforward statistics for the
behavioral sciences”. Pacific Grove, CA:
Brooks/Cole Publishing, 1996.
[40]. Michaud, J.P., “A citizen's guide to understanding and monitoring lakes and streams”, Publ. no. 94-149. Washington State Dept. of Ecology, Publications Office, Olympia, WA, USA (360), 1991, pp. 407-7472.
[41]. Årestedt K., “Factor Analysis; Exploratory Approaches”, 2013, pp. 1-29. Available at:
https://old.liu.se/medfak/larc-old/utbildning- information/forskarutbildningskurser/multivariate-
statistics/course-material/1.564432/Faktoranalys_frelsning.pdf
[42]. Wang X, Cai Q, Ye L, Qu X., “Evaluation of spatial and temporal variation in stream water quality by multivariate statistical techniques: A case study of the Xiangxi River basin, China”, Elsevier; Quaternary International, 282, 2012, pp. 137–144. Online: www.elsevier.com/locate/quaint