Available online: https://edupediapublications.org/journals/index.php/IJR/ P a g e | 4047
A Study of the Financial Performance of Selected Public Sector and Private
Sector Bank through: CAMEL Model
Dr. Deepak GuptaAssistant Professor in Commerce (I.G.U., Meerpur, Rewari)
&
Ms. Poonam kumari
Research Scholar (I.G.U., Meerpur, Rewari)
Email: dkguptartk2006@gmail.com
Abstract:
Bank is a financial intermediary that accepts money for deposits and lend money to the people for expenditure and investment purpose and an institution providing the services of transferring money from abundance to scarceness and generating income. Therefore, present study has been conducted to know the financial performance and health of selected private sector banks and public sector banks through CAMEL model. In India, several private banks operating but present study only limited to top 5 private banks i.e. ICICI Bank, Axis Bank, HDFC Bank, Yes Bank and Kotak Mahindra Bank and five public sector banks SBI, PNB, IDBI, Bank of India,
Oriental Bank of Commerce. Time period for study is taken from financial year 2012-13 to
2016-17. Data collected for study purpose is purely secondary in nature and collected manly from annual report of banks, journals, thesis, published documents and relevant websites.
KEYWORDS: CAMEL, Capital Adequacy Ratio, Credit Deposit Ratio, Net Profit, NPA,
Return on Average Assets._____________________________________________________________________________
INTRODUCTION
Bank is a financial intermediary that accepts
money for deposits and lend money to the
people for expenditure and investment
purpose and an institution providing the
services of transferring money from
abundance to scarceness and generating
Available online: https://edupediapublications.org/journals/index.php/IJR/ P a g e | 4048 the middle French word named “banque”.
Due to the importance of banks in the
financial system and national economy, they
are extremely regulated in most countries
and now become the component and pack of
everybody’s life. The banking organization
has played a critical role in the mobilization
of funds and encouragement of economic
development. As the real economy is
vibrant, it is very important that the banking
system is adaptive and competitive
sufficient to manage with various demands
and objectives made on it by a variety of
constituents of the economy. From the point
of view of financial insertion also, there is a
requirement to make accessible the
monetary services to the expelled segments
of the society. The banking industry has
become a reality in today's financial system,
as it is witness a development both in terms
of the number of institutions and in terms of
the total of money regulate by actions. In
spite of this growth and successes achieved
by the banking organizations universal, it
still have challenges which will need further
concentrated efforts on the part of these
organizations, such as to improve the value
of its yield and services, to progress upon
their personage performances and to keep
pace with the quick growth taking place in
the world. The commercial banks those were
dominating the markets have been effected
by the globalization, struggle and explosive
market active pressures.
REVIEW OF LITERATURE
Manas Kumar Baidya and Debabrata
Mitra (2012) studied for calculated and
evaluated the technical efficiency of 26
Indian public sector banks as of the
cross-section statistics of the financial year
2009-2010 and to present ranking of effectiveness
to these banks by means of two accepted
data envelopment analysis models: CCR and
Andersen and Petersen's super-efficiency
model. The outcome exposed that average
technical efficiency of whole sample is
86.5% and that just seven banks (23%) are
originate to be fully competent. As a result,
there was a capacity of efficiency
development of 19 public sector banks in
India. The study had establish that, the
banks which were by means of additional
labour for as long as their services are
comparatively more incompetent. In
regulate to improve the competence; most of
the incompetent banks should track the good
Available online: https://edupediapublications.org/journals/index.php/IJR/ P a g e | 4049 Bank, Allahabad Bank, State Bank ofIndia
and Corporation Bank. State Bank of India
had been experiential to be the majority
competent bank followed by Indian Bank,
Corporation Bank for every super-efficiency
score where, most incompetent bank was
United Bank of India.
Kumar and Sharma (2014) studied on
“Performance Analysis of Top Indian Banks Through Camel Approach”. This study
analyzes the various factors of performance
and strongness in the country Banking
sector, by CAMEL model. The study based
on top 8 market capitalized banks and
calculates many factors determining these
by used of econometric analysis of the
Secondary Data collected from various
reliable and authentic sources for a period
of 6 years, financial year 2007-08 to
2012-13. This study identified that PNB bank is
highly management efficient bank. They
found that earning quality of SBI and PNB
are on top position. SBI is highest NPA
level among all peer banks followed by
ICICI bank .
Khatik and Nag (2014) studied on
“Analyzing soundness of Nationalized
Banks in India: a camel approach”. The
objective of study observe the overall
performances and soundness of nationalized
banks with the use of CAMEL Model
approach .For find out the result they used
Camel approach incorporating important
factors like earning quality, management
efficiency, assets quality, capital adequacy
and liquidity. They concluded that Bank of
Broda was on the top position, the Union
Bank of India and Dena Bank hold 2nd
position and on 4th position was SBI. UCO
Bank was on last position.
Trivedi et al (2015) studied on “A
Comparative Analysis of Performance of
Public & Private Sector Banks In India
Through Camel Rating System”. The
objective of the study was evaluating the
performance of the banks according to the
CAMEL model. The performance of 4
banks (two public & two private) was
studied for the period 2008-2009 to
2012-2013. The authors concluded that the
competition was very tough and customers
got better service quality better bargains.
Kaur and Kaur (2016) studied on “Camel
analysis of selected public sector banks”.
The study concentrates on 10 public banks
Available online: https://edupediapublications.org/journals/index.php/IJR/ P a g e | 4050 for the ten years (2004-05 to 2013-14).In
this study the authors used CAMEL
Approach was applied to evaluate the
financial performance of selected public
sector banks. Based on the set indicator as
defined by CAMEL framework the financial
performance evaluated with the help of
various ratios. On the basis of Camel model,
the researchers found that Bank of Baroda
and PNB were considered the most stable
banks. Indian Bank and IDBI banks, Canara
Bank & SBI were considered average, and
the Union Bank, Bank of India, Syndicate
Bank & CBI were considered below
average, and were closely monitored to
ensure their viability.
Objective of the Study
To study the financial performance of
selected Public sector and Private sector
bank through CAMEL model;
CAMEL Rating System
CAMEL model is a simple and appropriate
model for managerial and financial
assessment of organizations. It is classified
as a modern approach to evaluate the
performance. This method has been used
more in foreign countries but in our country
little efforts has been done to introduce this
model and use it to measure their
performance. But it is not used as a formal
method which Central Bank introduces it.
So there is still a need for further
investigation in this field. For this purpose
we measure the dimensions of the CAMEL
model such as capital adequacy , asset
quality, management quality, earning
performance and
liquidity(www.slideshare.net). This rating
system is designed to take into account and
reflect all significant financial and
operational factors for evaluating a credit
union performance.
The banks were judged on five different components under the acronym C-A-M-E-L:
C – Capital Adequacy
A – Asset Quality
Available online: https://edupediapublications.org/journals/index.php/IJR/ P a g e | 4051 E – Earnings Capacity and
L – Liquidity
Research Methodology
This study is a descriptive and analytical
research as it calculates and interprets the
various ratios under CAMEL model for the
selected Indian banks after global financial
crisis in order to arrive at appropriate
conclusion.
Data Collection
The data has been collected for the study
from secondary source. In order to collect
the data for analyzing the financial
performance of banks, bank’s financial
statement like balance sheets, profit & loss
A/C, explanatory notes are used. The data of
the sample banks for a period of 2012-13 to
2016-17 have been collected from the
annual reports published by the banks and
RBI website.
DATA ANALYSIS AND INTERPRETATION
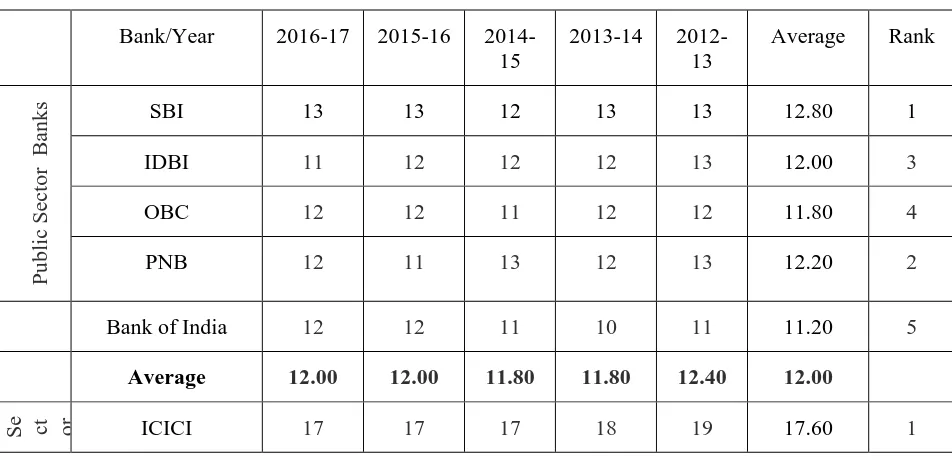
Table No. 4.1
Capital Risk Adequacy Ratio
(value in %)
Bank/Year 2016-17 2015-16
2014-15
2013-14
2012-13
Average Rank
Pu
bl
ic Sector
B
ank
s SBI 13 13 12 13 13 12.80 1
IDBI 11 12 12 12 13 12.00 3
OBC 12 12 11 12 12 11.80 4
PNB 12 11 13 12 13 12.20 2
Bank of India 12 12 11 10 11 11.20 5
Average 12.00 12.00 11.80 11.80 12.40 12.00
Available online: https://edupediapublications.org/journals/index.php/IJR/ P a g e | 4052
Axis 15 15 15 16 17 15.60 4
Yes 17 17 16 14 18 16.40 3
Kotak Mahindra bank
17 16 17 19 16 17.00 2
HDFC 14.6 15.50 9 9 15.94 12.81 5
Average 16.12 16.10 14.80 15.20 17.19 15.88
Source:(www.moneycontrol.com)
Figure - 4.1 : Capital Risk Adequacy Ratio
INTERPRETATION
Table 4.1 and figure 4.1 shows that in
public sector banks SBI leads the all
public banks with average in Capital
Adequacy Ratio (CRAR) 12.80%
followed by PNB bank (12.20%) and
IDBI bank (12.00%. In private sector
banks ,ICICI leads all private banks with
average of CRAR 17.60% followed by
Kotak Mahindra bank (17.00%) and YES 0
2 4 6 8 10 12 14 16 18 20
percen
tag
e
of r
ati
o
Banks
Capital Risk Adequacy Ratio
Available online: https://edupediapublications.org/journals/index.php/IJR/ P a g e | 4053 bank (16.40%) . All these banks fulfilled the
minimum requirement of Capital adequacy
i.e.9%. the trend of CRAR are fluctuating
during the period of study. The overall
average of CRAR of five private sector
banks (15.88%) is higher than the five
public sector banks(12.00%) during the
period of study (2012-13 to 2016-2017).
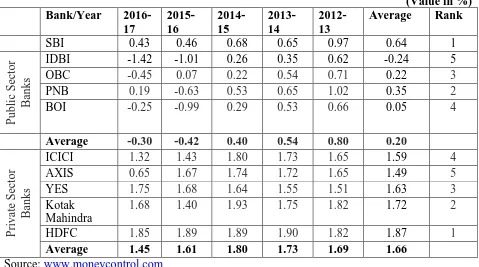
Table No. 4.2 Net Profit to total fund
(Value in %) Bank/Year
2016-17
2015-16
2014-15
2013-14
2012-13
Average Rank
SBI 0.43 0.46 0.68 0.65 0.97 0.64 1
Publi
c Sec
to
r
Banks
IDBI -1.42 -1.01 0.26 0.35 0.62 -0.24 5
OBC -0.45 0.07 0.22 0.54 0.71 0.22 3
PNB 0.19 -0.63 0.53 0.65 1.02 0.35 2
BOI -0.25 -0.99 0.29 0.53 0.66 0.05 4
Average -0.30 -0.42 0.40 0.54 0.80 0.20
Priva
te S
ector
Banks
ICICI 1.32 1.43 1.80 1.73 1.65 1.59 4
AXIS 0.65 1.67 1.74 1.72 1.65 1.49 5
YES 1.75 1.68 1.64 1.55 1.51 1.63 3
Kotak Mahindra
1.68 1.40 1.93 1.75 1.82 1.72 2
HDFC 1.85 1.89 1.89 1.90 1.82 1.87 1
Average 1.45 1.61 1.80 1.73 1.69 1.66
Available online: https://edupediapublications.org/journals/index.php/IJR/ P a g e | 4054 Fig. - 4.2: Net Profit to total fund
INTERPRETATION
Table 4.2 and Fig. 4.2 Exhibits that in case
of public sector banks, SBI is on top
position with average of Net Profit to total
fund 0.64% followed by PNB bank (0.35%)
and PNB bank (0.22%). In private sector
banks, HDFC is on top position with
average of Net Profit to total fund 1.87%
followed by, Kotak Mahindra bank (1.72%)
and YES bank (1.63 %). The overall grand
average of Profit per Employee of five
private sector banks (1.16%) is much better
than the five public sector banks (0.20%)
during the period of study (2012-13 to
2016-2017).
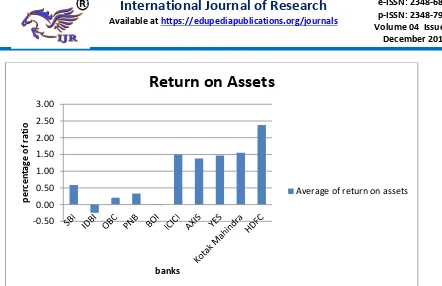
Table No. 4.3
Return On Assets -0.50
0.00 0.50 1.00 1.50 2.00
Per
centa
ge
of
Ra
tio
Banks
Net Profit to total fund
Available online: https://edupediapublications.org/journals/index.php/IJR/ P a g e | 4055 (Value in %)
Bank/Year 2016-17 2015-16 2014-15 2013-14
2012-13
Average Rank
Publi
c Sec
to
r
Banks
SBI 0.38 0.44 0.63 0.6 0.9 0.59 1
IDBI -1.42 -0.97 0.24 0.34 0.58 -0.25 5
OBC -0.43 0.06 0.21 0.51 0.66 0.20 3
PNB 0.18 -0.59 0.5 0.6 0.99 0.34 2
BOI -0.24 -0.99 0.27 0.47 0.6 0.02 4
Average -0.31 -0.41 0.37 0.50 0.75 0.18
Priva
te S
ector
Banks
ICICI 1.26 1.34 1.72 1.64 1.55 1.50 3
AXIS 0.61 1.56 1.59 1.62 1.52 1.38 5
YES 1.54 1.53 1.47 1.48 1.31 1.47 4
Kotak Mahindra
1.58 1.08 1.76 1.71 1.62 1.55 2
HDFC 2.21 2.45 2.35 2.4 2.48 2.38 1
Average 1.44 1.59 1.78 1.77 1.70 1.66
Available online: https://edupediapublications.org/journals/index.php/IJR/ P a g e | 4056 Fig - 4.3 : Return on Assets
INTERPRETATION:
Table 4.3 and Fig. 4.3 Exhibits that in case
of public sector banks , SBI is on top
position with average of Return on Assets
0.59% followed by PNB bank (0.34%)
and OBC bank (0.20%). In private sector
banks, HDFC is on top position with
average of Return on Assets 2.38% followed
by, Kotak Mahindra bank (1.55%) and
ICICI bank (1.50 %). The overall grand
average of Return on Assets of five private
sector banks (1.66%) is better than the five
public sector banks (0.18%) during the
period of study (2012-13 to 2016-201
Findings:
The followings are the major findings that
are drawn from this study.
Each of the sampled public and
private banks has gone above the
minimum capital adequacy ratio of 9 -0.50
0.00 0.50 1.00 1.50 2.00 2.50 3.00
perce
nta
ge
of
ra
tio
banks
Return on Assets
Available online: https://edupediapublications.org/journals/index.php/IJR/ P a g e | 4057 %prescribed by the RBI. So all the
banks have maintained level of capital
sufficient to tackle the risk of
shortage of capital.
In private sector Banks, HDFC bank,
Kotak Mahindra Bank’s net profit to
total fund more which is a safe and
regular source of income of banks as
compare to public sector banks.
Earning capacity of Kotak Mahindra
Bank, HDFC and ICICI bank in
private Banks is more satisfactory by
earning more profit, return on asset as
compare to SBI bank, PNB bank in
public sector banks. Private sector
banks also provide more profit other
than banks.
The overall conclusion is that
performance of private sector banks is
more efficient as compare to public
sector banks
References:
Ansari, Mohd. Samim (2014).
“Performance Evalution of
Nationalized Commercial Banks In India Through Camels Model In the
Post Liberlisation Era”, Department
of Economics & Finance,
Bundelkhand, Jhansi, (5-feb-2014), pp.1-253.
Bala Neetu and Kumar Sunil (2011) –
How efficient are public sector banks in India? An empirical investigation; Journal of Banking Financial
Services and Insurance Research, Vol. (1), issue (3) pp.39-62.
Biresh Sahoo and Anandadeep
Mandal (2011) – Examining the performance of Banks in India: Post
Transition period. IUP Journal of
Bank Management. Issue 2; pp. 7-31.
.Hitesh Arora and Padmasai Arora
(2012) – Bank Productivity
measurement using Hicks-Moorteen
Indices:evidence from JPSB –
International Journal of Business
Performance Management. Vol.13,
issue 3/4 pp.386-407
Jagjeet Kaur, D. H. (2016). Camel
analysis of selected public sector
banks. GIAN JYOTI E-JOURNAL .
Malhotra, P.K. (May 2013).
Performance Appraisal of Indian
Public Sector Banks. World Journal
of Social Sciences , 71-88.
Manas Kumar Baidya and
Available online: https://edupediapublications.org/journals/index.php/IJR/ P a g e | 4058
approach; International Journal of
Business performance Management.
Vol.13, issue 3/4.pp.341-365.
Mohan and Ray (2004). Comparing
performance of Public and Private Sector Banks : Revenue maximisation
Efficiency approach. Economic and
political weekly, 1271-1276.
Mukesh Kumar (2010) –
Benchmarking Indian Banks using DEA in Post-reform period: a progressive time-weighted mean approach. Academia edu.
Mukund. (March 2012). performance
of public and private sector bank: A
comparative study. EPRA
International
Nag, S. A. (2014). Analyzing
soundness of Nationalized Banks in
India: a camel approach. Applied
Studies in Agribusiness and
Commerce .
Namita Rajput and Monika Gupta
(2011) – Efficiency of Public Sector Banks Operating in India: Post reforms period analysis – Afro – Asian Journal of Finance and
Accounting, Vol.2 No (4).
Pp.349-368, 2011.
Nandhini, D.S. (2015). An analysis of
selective Indian public sector banks.
International Journal of Applied
Research , 626-630.
Panner Selvam, R., and Radjaramane
.V (Jan, 2012)-A study on the
financial performance of Nationalised Banks in India: A post liberalization Analysis; Vol.4, issue 1, pp.262-267.
Poonam Mahajan Aparna Bhatia and
SubhashChander, 2012 – ROA performance of public sector banks in
India. IUP Journal of Bank
Management, Vol. XI issue 3,
pp.22-35.
PriyaPonraj and GurusamyRajendran
(2012) – Financial Strength as an indicator for Measuring Bank competitveness. An Empirical evidence from Indian Banking
Industry; Journal of Applied
Economic Sciences. Vol.7 issue 2(20)
pp.179-188, 2012
Sharma, S.K. (2014). Performance
Analysis Of Top Indian Through
Came Lapproach. International
Journal of Advanced Research
inManagement and Social Sciences ,
81-96.
Shiva Ghasempour, M.S. (October
2016,). Ranking Iranian Private
Banks Based on the CAMELS Model
Using the AHP Hybrid Approach and
TOPSIS. International Journal of
Academic Research in Accounting,
Finance and Management Sciences,